Week-4 Challenge WOT Condition Part-2
AIM:
WOT CYCLE for the different drivetrain.
OBJECTIVE :
- What is the difference between a mapped and dynamic model of engine, motor and generator? How can you change model type?
- How does the model calculate miles per gallon? Which factors are considered to model fuel flow?
- Run the HEV ReferenceApplication with WOT drive cycle. Change the grade and wind velocity in the environment block. Comment on the results.
- Keeping all other parameters the same, compare the simulated results of hybrid and pure electric powertrains.
Introduction :
Hev powertrain design types :
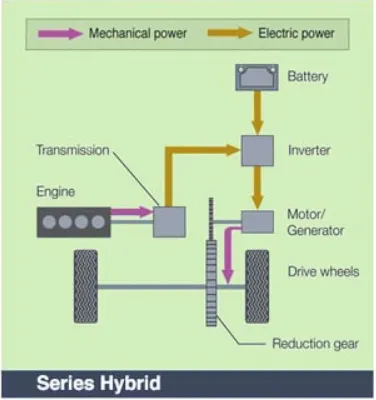
Series (Extended-Range) Hybrid
A series hybrid is like a battery electric vehicle (BEV) in design. Here, the combustion engine drives an electric generator instead of directly driving the wheels. The generator both charges a battery and powers an electric motor that moves the vehicle. When large amounts of power are required, the motor draws electricity from both the battery and the generator. Series hybrids may also be referred to as extended-range electric vehicles (EREVs) or range-extended electric vehicles (REEVs) since the gas engine only generates electricity to be used by the electric motor and never directly drives the wheels. Modern examples include the Cadillac ELR, Chevrolet Volt, and Fisker Karma.
Parallel Hybrid
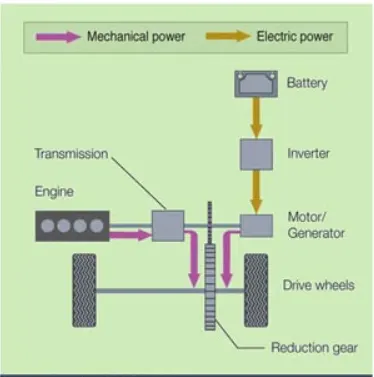
A parallel hybrid is propelled by both an internal combustion engine (ICE) and an electric motor connected to a mechanical transmission. Power distribution between the engine and the motor is varied so both run in their optimum operating region as much as possible. There is no separate generator in a parallel hybrid. Whenever the generator's operation is needed, the motor functions as generator. In a parallel mild hybrid, the vehicle can never drive in pure electric mode. The electric motor turns on only when a boost is needed.
Series-Parallel
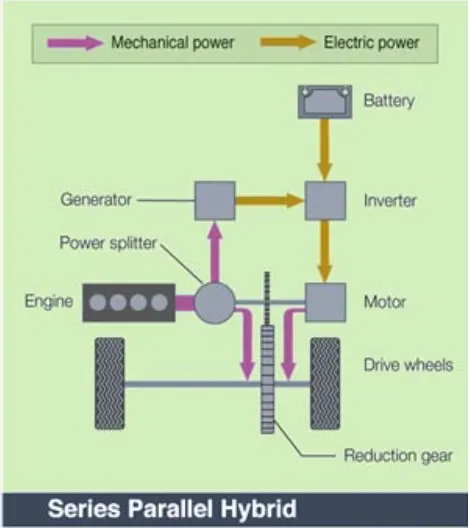
The vehicle can be powered by the gasoline engine working alone, the electric motor by itself, or by both energy converters working together. Power distribution between the engine and motor is designed so that the engine can run in its optimum operating range as much as possible.
What Is MPG?
MPG, or miles per gallon, is the distance, measured in miles, that a car can travel per gallon of fuel. MPG is also the primary measurement of a car's fuel efficiency: The higher a car's MPG, the more fuel efficient it is.
The U.S. Environmental Protection Agency, or the EPA, is the government agency responsible for certifying a vehicle's MPG figures, notes How Stuff Works.
A car's MPG can be inconsistent because it is affected by a number of different factors, so it is difficult to get an accurate measurement. For example, factors like traffic and road conditions can affect MPG in any given context. That's why the EPA runs tests over a standard set of courses, then averages the results to calculate a vehicle's official MPG.
SOLUTIONS:
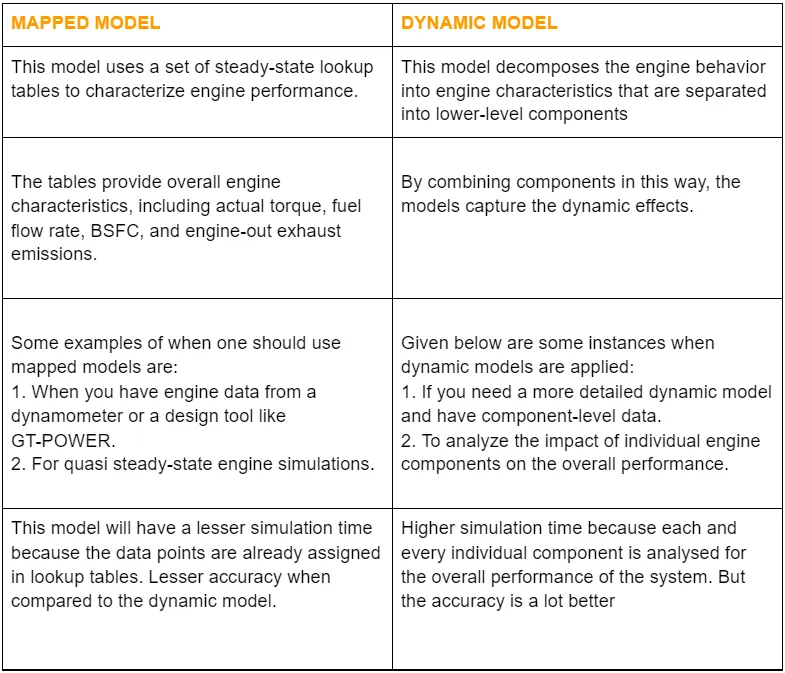
1. Difference between mapped and dynamic models of engine, motor, and generator? How can you change the model type?
Changing the model variant :
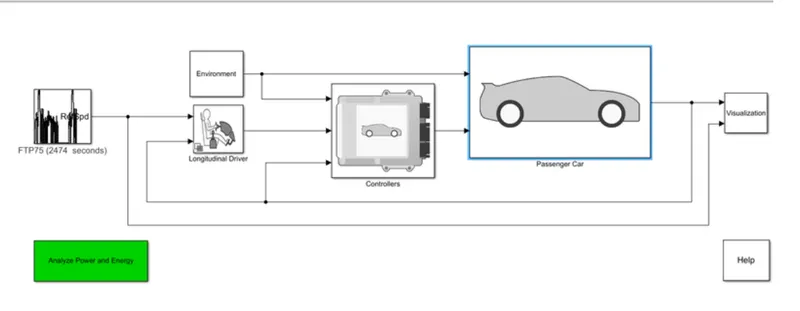
- Go to the POWERTRAIN block set the module in MATLAB. Select any reference vehicle model. Here, we have selected the HEV reference application blockset. Its block diagram is shown below.
- Next double click on the PASSENGER CAR block. Inside that block, there will be an ELECTRIC PLANT block. Click on that block to view the contents inside.
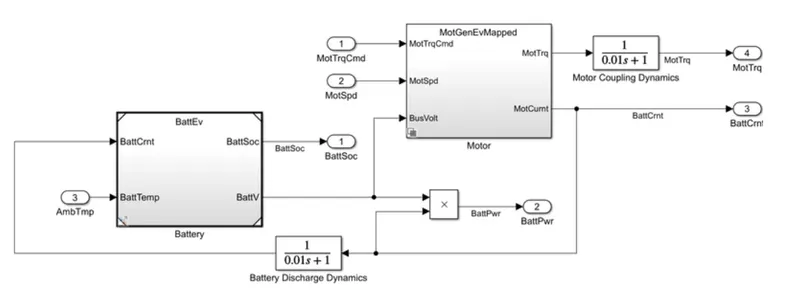
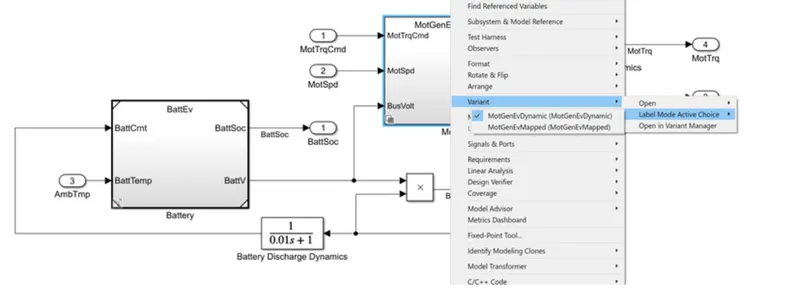
3.In the motor block as you can see the model is set as a mapped model. In order to change that into a dynamic model, just right-click on that block and select VARIANT-LABEL MODEL ACTIVE CHOICE. Now you can set that model into dynamic.
2. How does the model calculate miles per gallon? Which factors are considered to model fuel flow?
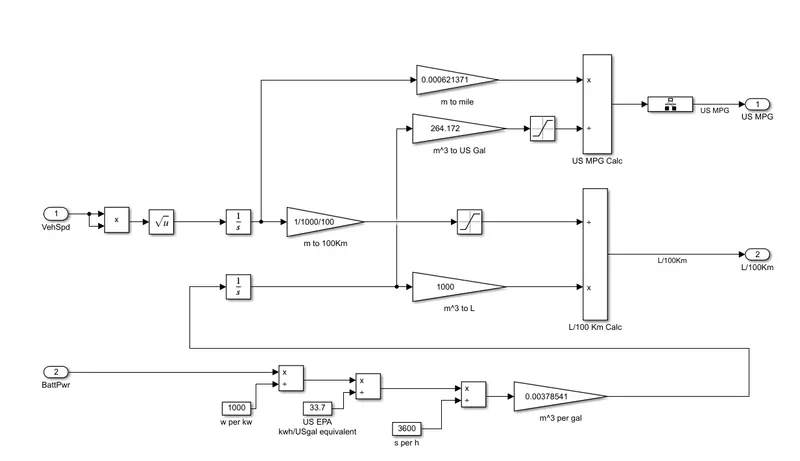
In the POWERTRAIN blockset the fuel economy is calculated as follows:
Open any vehicle model available in the POWERTRAIN blockset module.
VEHICLE SPEED:
- Here our fuel in this case is the battery pack. The model considers the vehicle speed, which is the drive cycle input here, and the battery power of the vehicle to calculate the fuel economy.
- Now in the above vehicle speed block, we can see that there is conversion happening.
- When we integrate speed with time, we get the distance. This distance is converted from m into 100kms as well as miles and fed into two blocks, L/100 and the US MPG block. (In the US, the MPG is calculated for miles). (1m = 0.000621 miles).
- We are measuring the number of litres of fuel (in this case equivalent battery power) required to travel for 100 km. And also the distance covered for US MPG. Then these results are compared.
BATTERY POWER:
- The initial battery power is in Watts and it is converted into KW(Dividing by 1000). Then power is converted into energy by multiplying with time. Then we convert energy into equivalent energy in US gallons (Dividing energy with 33.7).
- Further, divide it by 3600 to convert KWh into KWs. Then we have to convert it to the volume of fuel flow. The fuel flow unit is m^3/gallon and it has to be multiplied by a factor of 0.00378541 with the energy value.
- This fuel flow is further integrated to convert it into m^3. It is multiplied by 1000 to convert it into liters. This is fed into the L/100kms block.
- Then it is also converted into equivalent US gallons by multiplying m^3 units to 264.172. This is fed into the US MPG block.
- Then the integrated distance measured is converted into miles and fed into the US MPG block. It is again converted to 100kms and fed to the L/100kms block. These results are then used for comparison.
- Finally, the distance measured and the energy flow are calculated and they are divided to get the result in miles/gallon.
3.Run the HEV ReferenceApplication with WOT drive cycle. Change the grade and wind velocity in the environment block.
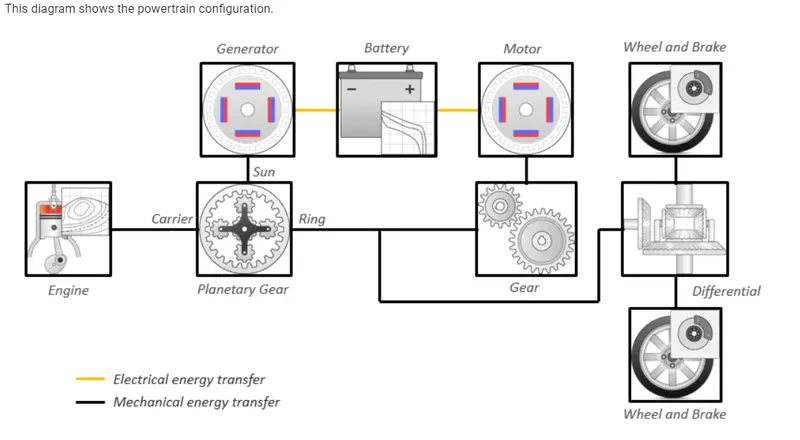
- Open the Power train block set in the help section and select the Hybrid Electric Vehicle (HEV)- Multimode and open the model.
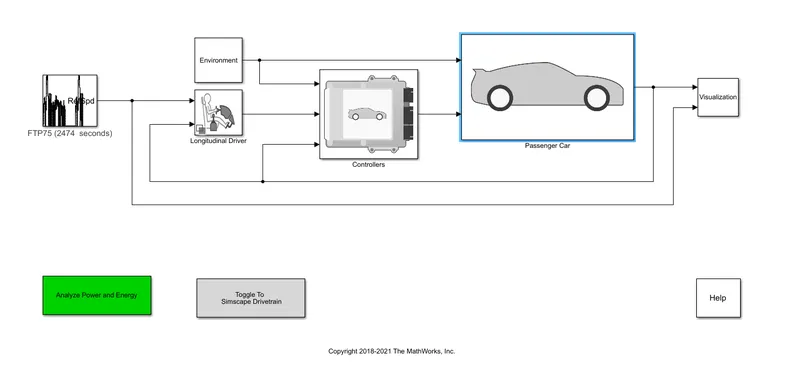
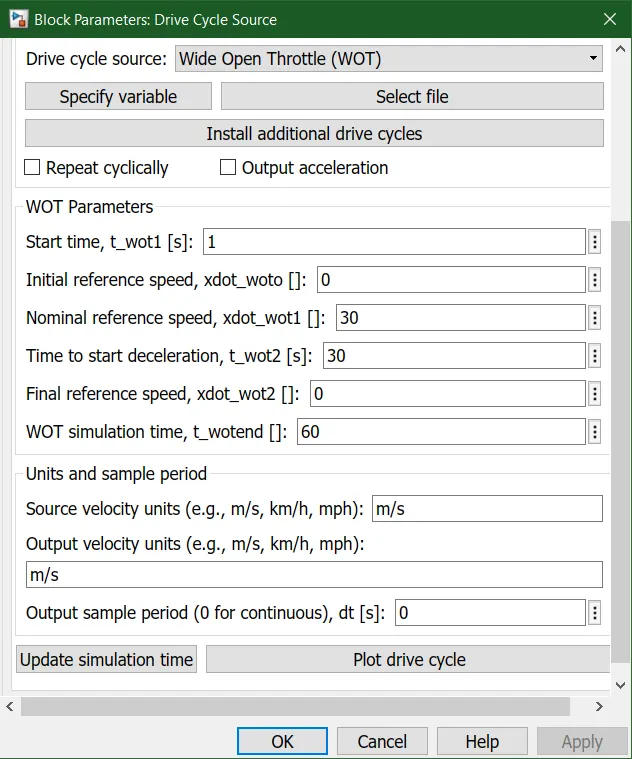
- Double- Click on the Drive Cycle Source, a new dialog box opens
- In the Drive Cycle source, select the Wide Open Throttle (WOT) . Here we will be taking the nominal speed of 30 m/s and simulation time to 60s sec and then click OK.
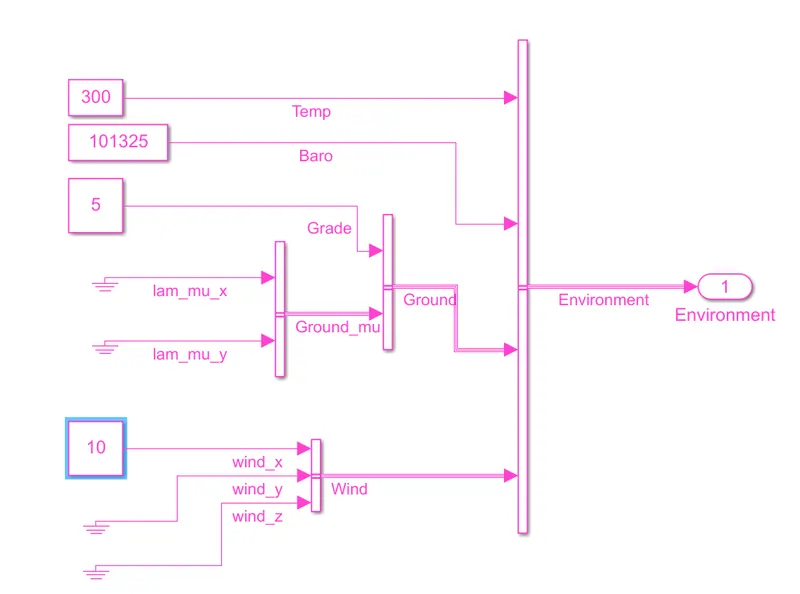
- Now, In the Environment block, initially, check the grade and Wind velocity (they are taken as 0).
- Run the model and open the Visualization of the performance and FE scope.
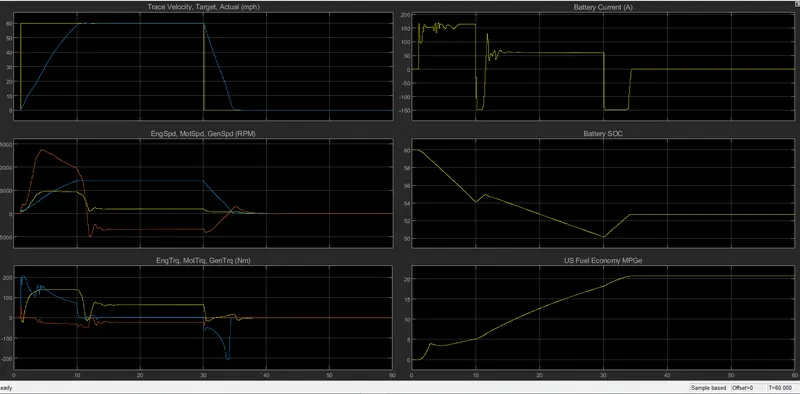
Explanations :
- The first plot shows us the target velocity graph and the actual velocity. The plot clearly depicts the actual and Trace velocity lines are overlapping each other. Though the time taken for the vehicle to achieve the reference speed is slow, almost taking around 10 sec. And for the deceleration time from max to min was found to be 5 secs approximately.
- The second plot shows us the speeds of the motor, generator, and engine. From the plots, it is evident that the RPM is considerably greater while the vehicle is accelerating and lower when decelerating.
- The third plot shows us the torque for the motor, engine, and generator. We can observe the same pattern as the torque is high while acceleration and low when deceleration. It also shows the torque generated while the vehicle is decelerating or braking.
- The fourth plot shows us the battery current in ampere. The current flow is clearly high when the vehicle is at the accelerating period and it decreases sharply during deceleration.
- The fifth plot shows us the SOC of the battery during the WOT cycle. As we see the battery is charged at 60%.The SOC depletes during acceleration and gradually increases during deceleration and also due to the regenerative braking.
- The final plot shows us the fuel economy as US MPG. The economy is clearly higher when the vehicle is battery-driven. But it starts to decrease when the IC engine starts to drive the vehicle.
Changing the wind and gradeability :
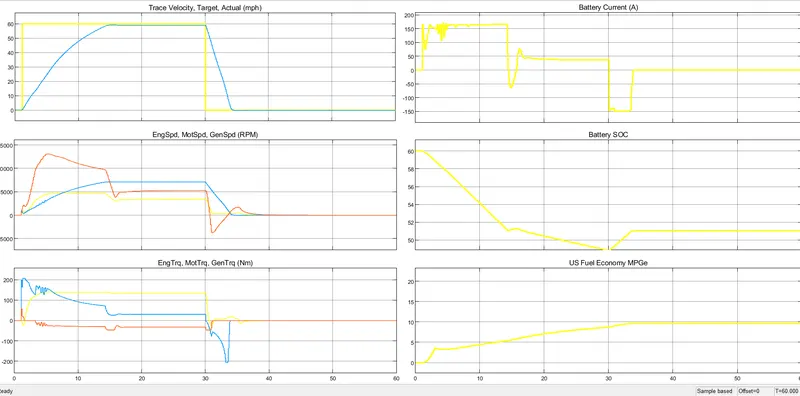
- Now change the Grade and Wind Velocity to 5 degrees and 10 m/s and run the model.
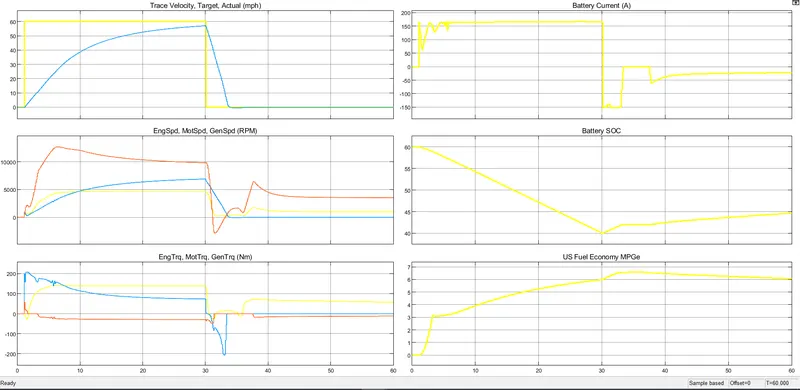
- Following the same now change the grade and wind velocity to 10 degrees and 10 m/s and run the model again.
Explanation:
- The first plot of the velocity shows that the vehicle is unable to match the reference speed due to the wind resistance and grade number. This difference between the two speeds is more in the second case (10 degrees and 10 m/s ).
- Now for the battery state of charge, both cases show a deep battery charge state during the cycle. But at the end of the cycle, the SOC of the first is more as compared to the second.
- Also, the MPGe of the first case is better than the other one.
- The rest of the plot is somewhat the same with a few changes in the battery discharging the current for the particular driving cycle.
4.Keeping all other parameters the same, compare the simulated results of hybrid and pure electric powertrains.
- A pure EV uses only a battery propulsion system to run a vehicle. The powertrain setup of a pure EV is shown below.
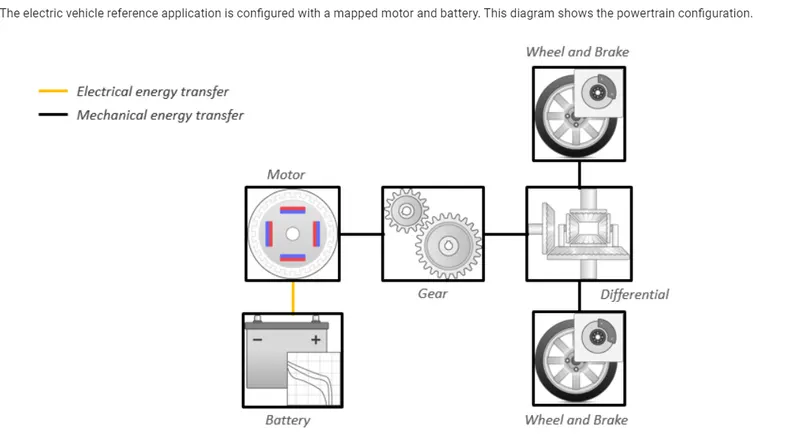
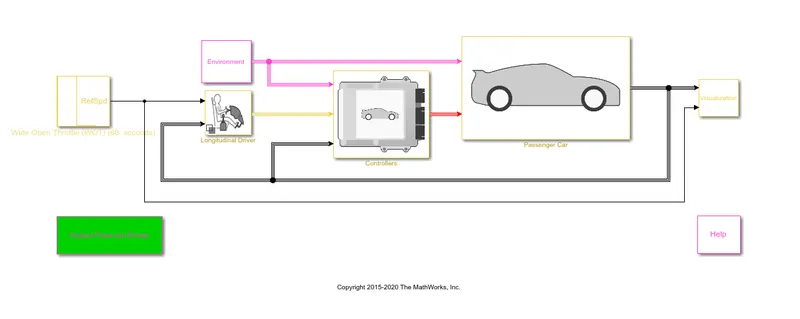
- Since we have already discussed the performance of the HEV above, we will look into the performance of a pure EV with the same input parameters.
- The same WOT drive cycle is followed as above but with zero wind resistance and gradeability.
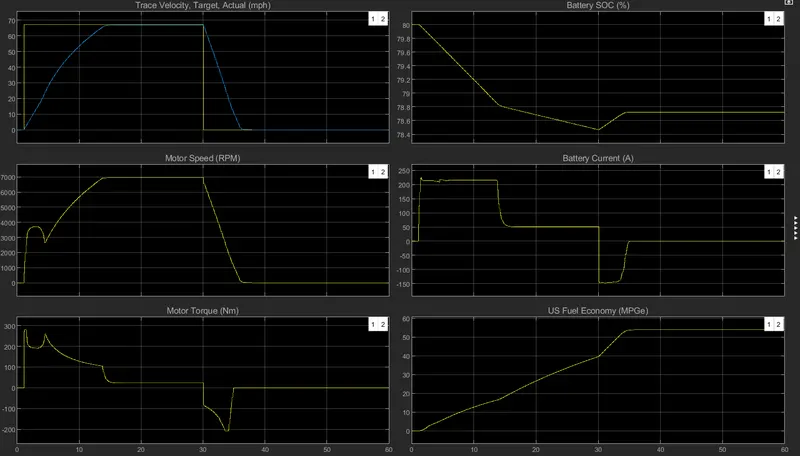
- Now we run the simulation for 60sec and the results can be seen from the scope below.
Results explanation comparing the HEV model :
- In the first plot of velocities, both vehicles are able to reach the reference speed. But the time taken to reach the speed is a little bit quicker in the HEV model as compared to the EV drivetrain model.
- The second plot of the rpm shows the HEV model has a peak value of around 4500 rpm while the EV model where motor the drive source has the value of 7000 rpm.
- The torque shows the Motor of EV is developing slightly more starting torque as compared to the HEV drivetrain.
- The battery is charged at 80% for EV and 60% for the HEV drivetrain. Now the battery is discharged only 2% in the EV model which is much better than the HEV where it is around 10-12%.
- It is quite obvious the current required to run the vehicle will be more for the EV model.
- For the MPGe, the EV vehicle shows around 55 MPG while it was 22 MPG for the HEV vehicle. That means the EV vehicle is better in terms of mileage.
- In addition to this, EV vehicle has zero emissions which makes them environment friendly.