Week-4 Challenge WOT Condition Part-2
- What is the difference between mapped and dynamic model of engine, motor and generator? How can you change model type?
MAPPED ENGINE:
- The Mapped CI Engineblock implements a mapped compression-ignition (CI) engine model using power, air mass flow, fuel flow, exhaust temperature, efficiency, and emission performance lookup tables.
- The block set is used for different purposes:
- Hardware in the loop in engine control design.
- Vehicle level full economy and power level simulations.
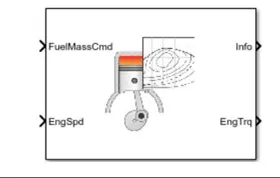
- The block enables you to specify lookup tables for these engine characteristics:
- Power
- Air
- Fuel
- Efficiency
- Hydrocarbon emissions
- Carbon monoxide emissions
- Particulate matter emissions.
MAPPED MOTOR:
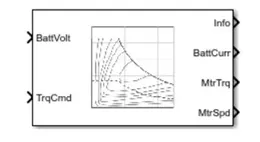
- The Mapped Motorblock implements mapped motor and drive electronics operating in torque-control mode. The output torque tracks the torque reference demand and includes a motor-response and drive-response time constant. Use the block for fast system-level simulations when you do not know detailed motor parameters, for example, for motor power and torque tradeoff studies.
- It can specify torque range, electrical loss.
DYNAMIC ENGINE:
- the model is based on the inputs that are given at the time of the running of the engine when the velocity of the vehicle is increased or decreased based on the speed of the vehicle.
- Time taken for the simulation will take long time compared to that of the mapped engine.
HOW CAN YOU CHANGE MODEL TYPE?
- We are going to open an HEV base model in which the system or the model consists of mapped engine and the dynamic engine model.
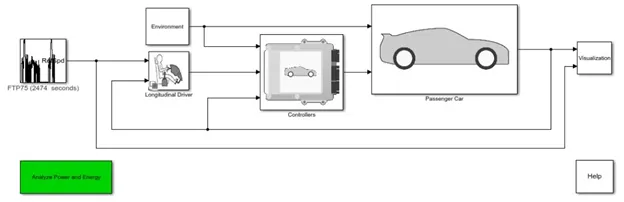
- Before changing the mapping engine to dynamic engine. The model looks like as shown in below.
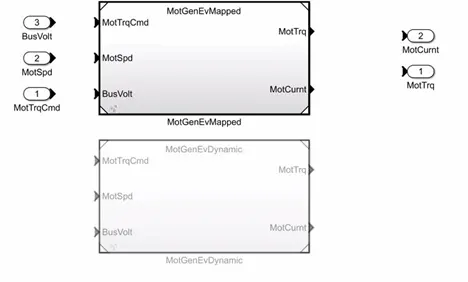
- The motor generator mapped is active and the motor generator EV dynamic is in active.
- To make that block active there are some systematic procedures for making the block to active.
- When we open the model, we will have an option called ‘variant manager’
- after clicking on the model, we will have number of options in which we have to select electric plant > motor > set as variable mode active choice.
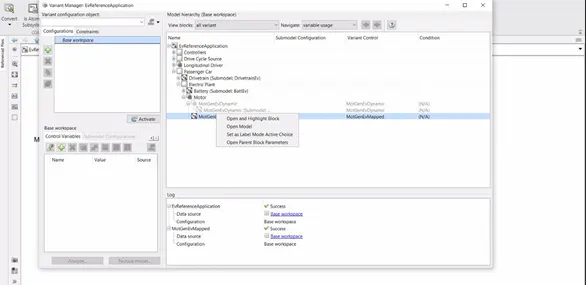
- After doing the steps the dynamic model looks like in this way.
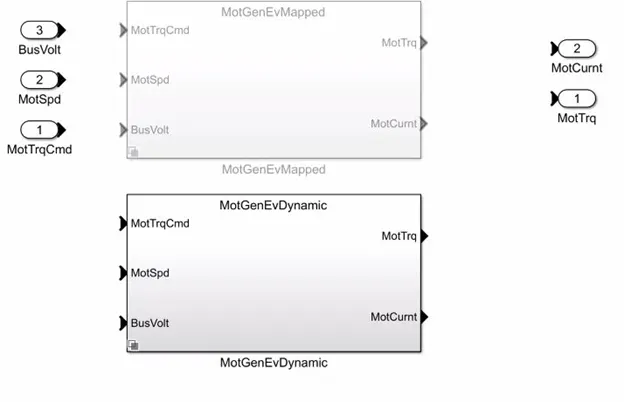
- This is how the mapped model is changed to the dynamic model.
- How does the model calculate miles per gallon? Which factors are considered to model fuel flow?
- MPG is known as miles per gallon, which represents that the distance covered by the car, per gallon of fuel.
- when the MPG is high it specifies that, the car travel more distance and having higher efficiencies.
- The US environmental agency is responsible to certify the vehicle MPG figures.
- The MPG can be affected by different factors which makes it difficult to calculate the efficiency of the vehicle.
- These can be solved by taking the averages of the MPG’s for the specified conditions.
- In this model the vehicle fuel efficiency is calculated by using the below block:
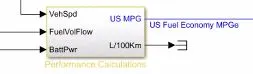
- This block takes the input from the battery or the fuel source and calculate the fuel economy by considering the vehicle speed, fuel volume flow and battery power required to the vehicle.
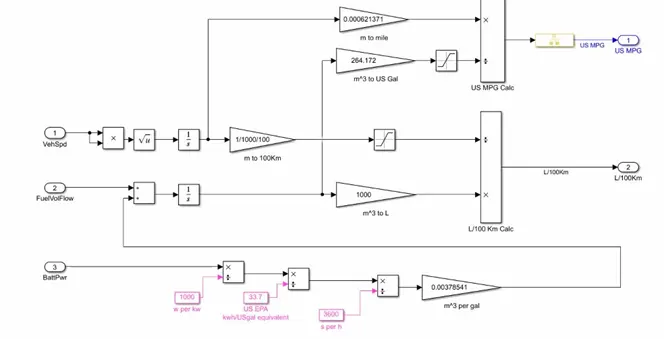
BATTERY POWER:
- In this block, the battery power is converted from watt to kilo watt dividing it with 1000. The output power is in kilo watt and is divided with 33.7 to convert it into KW/h to meet the US EPA standard. The output is in the form of KW/h and is divided into 3600 to convert it into second and the output unit is KWs/US gal.
- This value is converted for volume of fuel flow by multiplying it with 0.00378541 and the result is in m^3 per gal.
FUEL VOLUME FLOW:
- In this, the fuel volume flow and the conversion done in the volume flow are added together to get the output that is required.
- This output is known and then integrated by using the integration block for getting the m^3. The output is now converted into liter for calculating the fuel consumption of vehicle.
VEHICLE SPEED:
- The vehicle acceleration is dependent on the consumption of the fuel to calculate the milage per distance.
- Here the vehicle speed is split into two parts and these are multiplied, and the square roots are taken for the values. At the end both the values will be same just to avoid the error of the negative terminal.
- Now we can integrate the values and the result will be in meter. To convert meter to 100kilo meter, it is multiplied with 1/1000/100 for the conversion of the distance.
- Know the values for fuel volume flow and the vehicle speed are divided in the block to get the value in liter/100 km calc. And the output is shown for the milage for 100 km.
CONVERSION FOR MILES PER GALLON:
- For the conversion of the miles per gallon, the fuel volume flow in m^3 is multiplied with 264.172 to convert into US Gal.
- In vehicle speed derivation after the integration of the speed are multiplied by 0.000621371 to convert the m to mile.
- The values from the fuel volume flow and the vehicle speed flow, it gives the values in US Miles per Galan in US standard.
- Run the HEV Reference Application with WOT drive cycle. Change the grade and wind velocity in the environment block. Comment on the results.
- The model is based on the hybrid vehicle design, in which the vehicle is having the both the normal combustion engine and the battery source.
- This vehicle is used to distribute the power which is required to the vehicle.
- When the vehicle wants high initial torque, the battery power is used to supply high power to the motor which in return gives high torque which makes the vehicle to run.
- After getting the required torque the normal conventional engine will give the necessary momentum to the vehicle.
- By making the necessary distribution of the power between the battery source and the fuel gives the hybrid electric vehicle a better shot at performance.
- This makes the vehicle to go to higher torques when ever required and can travel longer distance when ever it is required.
- The HEV model is opened and shown in below:
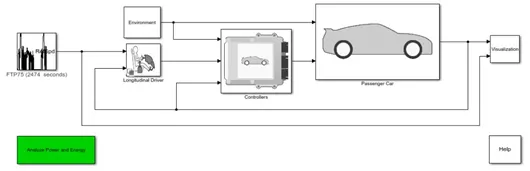
- the drive cycle is changed from FTP75 to WOT (wide open throttle).
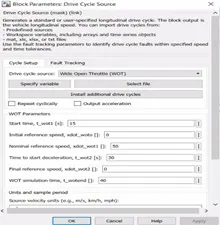
- In this block parameter the normal reference speed is changed to 50, the time for deceleration is fixed to 30 and the WOT simulation time to 40.
- After fixing the parameters the model is made to run for 40 sec without giving any inputs to the grade angle and wind velocity.
- The result for the model is shown with different plots:
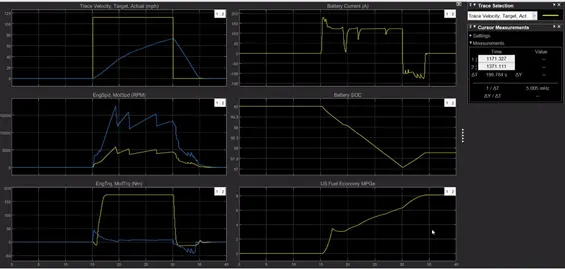
- The actual velocity is less than the reference velocity, the current drawn from the battery is having the highest of 180 amps when the velocity is reached at the initial of pick up of the motor/ generator.
- The motor speed is almost equal to 17000 rpm and reaches to zero at the end of the drive cycle and the battery SoC comes from 60 percent to 57 percent at the end of the drive cycle.
- When the vehicle is moving initially it wants high torque which is supplied by the motor and after some time the engine takes the load and gives the necessary torque output.
- The fuel economy of the model varies from zero to eight (MPGa).
WHEN THE GRADE ANGLE AND THE WIND VELOCITY ARE GIVEN:
- The grade angle and the wind velocity are given as:
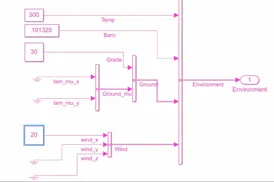
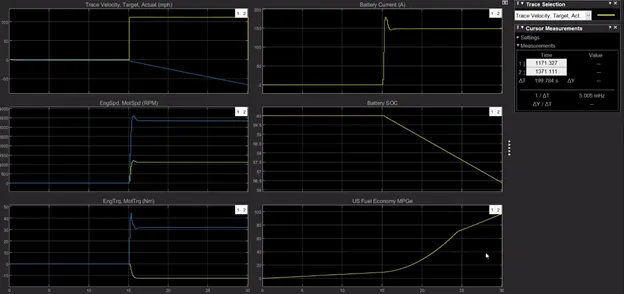
- The model is compiled once again and the results are as shown below:
RESULT:
- In the model, after adding the grade angle and the wind velocity the actual velocity is always less than that of the reference velocity.
- The engine speed is reduced to 3500 rpm to move the vehicle at the initial moment.
- The engine torque is very less compared to the free flow of the vehicle, because at the start of the vehicle moment the vehicle requires higher torque and less speed.
- The battery current reaches maximum at the start of the initial moment when the torque is high.
- The battery SOC is reduced from 60 percent to 56 percent.
4. Keeping all other parameters same, compare the simulated results of hybrid and pure electric powertrains.
PURE ELECTRIC VEHICLE:
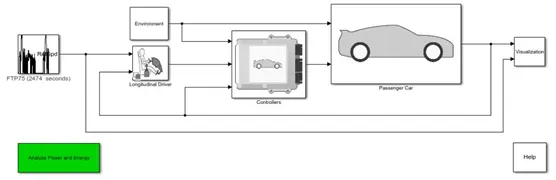
- The vehicle is having only pure electric vehicle which means it only consists of battery as the fuel source to run the vehicle.
- In this model, the vehicle is made to run by converting the stored electrical energy to the motors.
- These motors convert the electrical energy to mechanical power output by running the vehicle in the forward or reverse direction.
- The pure electric reference vehicle model is opened and the drive cycle model is changed to WOT dive cycle.
- The necessary parameters are changed and the model is compiled for the results.
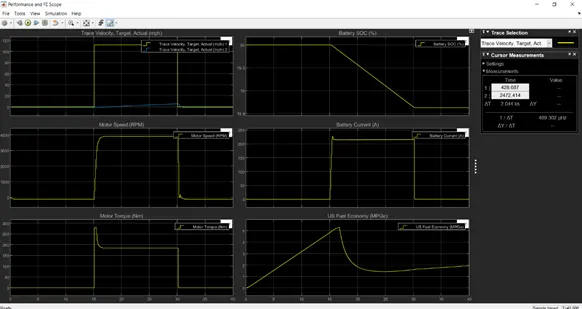
- The simulation is made to ran for 40 sec and the necessary data is shown below:
RESULT:
- The model is simulated, and the actual velocity is always less than the reference velocity.
- The motor speed is reached to 4000 rpm at the start of the 15 sec and is declined at the end of 30 sec.
- The motor torque is high at the initial moment of the vehicle at the start of the 15 sec.
- The battery SOC is reduced from 80 percent to 78.5 percent from the start of 15 sec to 30 sec.
- The battery current is reached to a maximum of 220 amps and becomes zero at the end of 30 sec.
- The fuel economy, starts from zero to five at 15 sec and comes down below 1.5 at the end of 30 sec.