Week - 4
Q1 -
Implement control logic of a “washing machine” using Stateflow as per given sequence:
- If the power supply is available, the system gets activated
- If the Water supply is not available, stop the process & indicate through LED
- Soaking time should be 200s followed by Washing time of 100s.
- Then rinsing happens for next 20s & dryer runs for 50s
After all the processes have completed turn on the finished LED.
Solution :-
Flow Chart :-
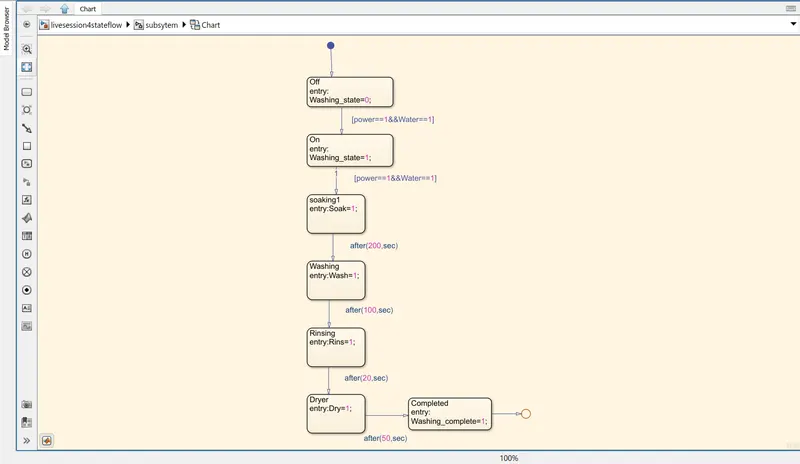
When the power and water is equal to 1 then only my next state will be On
If any one of them is not equal to 1 then my next state not activated.
In First state, we use washing_state is equal to 1. That is in off state.
When my power and water is equal to one, then normally the next that is on state will be activated.
And as following power is equal to one and water is equal to one condition is given.
After that. Soaking, Washing, Rinsing, Dryer,
That all states will be activated after some delay time.
At the last. Complete state is given.
Symbol Pane :-
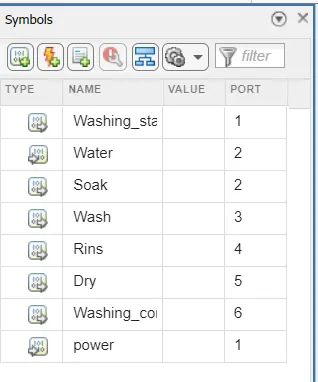
Water and Power both are Input signals.
And the remaining 6 states are Output signals.
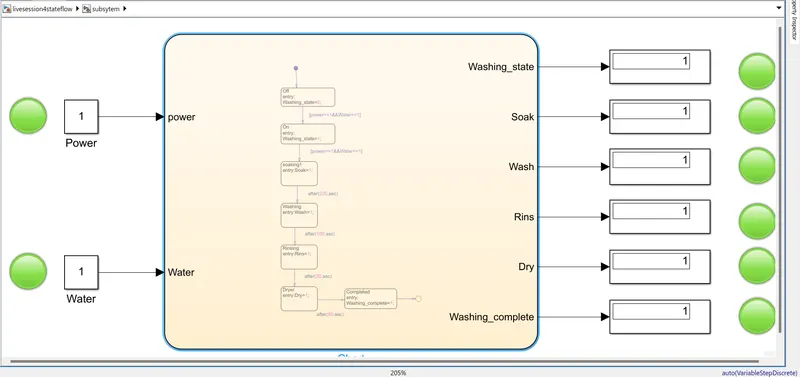
In the input side, you saw 2 states, that is power States and water states.
For both states we use constant block and along with that block we use a lamb. That is indicates green and red light.
When the input is 0 then Lamp shows red light. When the input is 1, then lamp shows the green light. Same for the output side also.
Condition 1 :-
- If the power supply is available, the system gets activated
Condition 2 :-
- If the Water supply is not available, stop the process & indicate through LED.
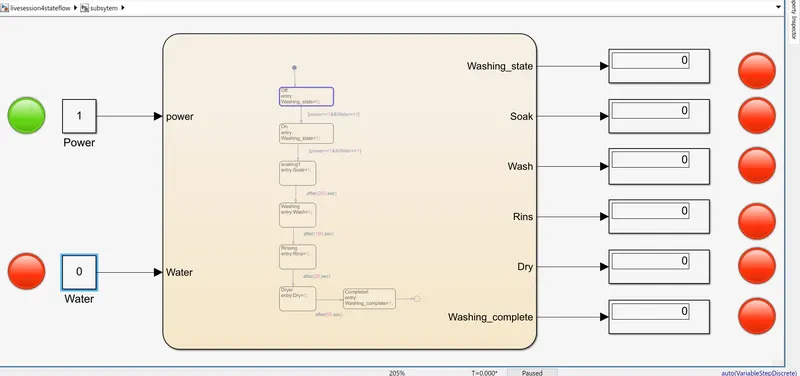
when the power supply work. Water is zero, then only state one is activated and power lamp shows green signal. First power supply showing one value and other remaining all the Red lamp showing zero value.
Q2 -
Make a Simulink chart for the “Gear shift” logic as per below conditions:
Speed Range(kmph) Gear
0 to 15 1
16 to 25 2
26 to 40 3
41 to 60 4
Above 61 5
Give speed input while the simulation is running & display the gear number.
Solution :-
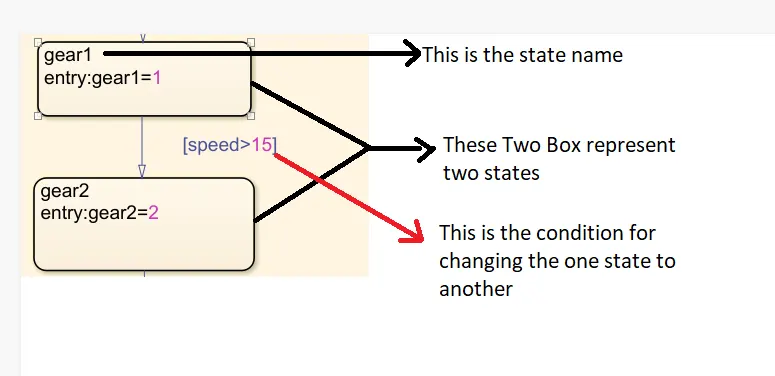
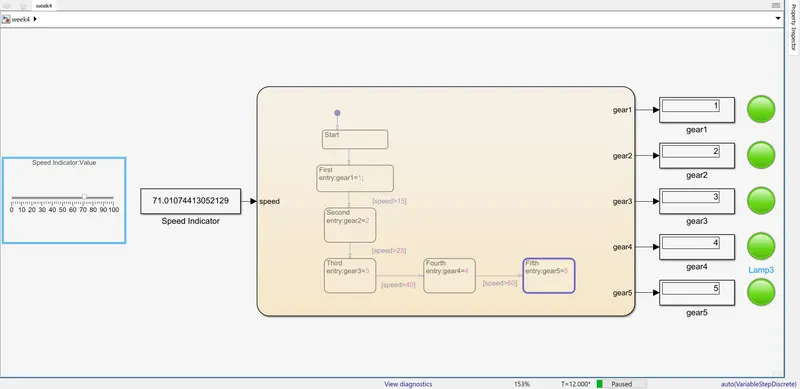
Here i am trying to show How states created and applied transition condition.
- gear1 is state name which represent State.
- gear1 = 1 this is the output it means when speed is below 15 output shows 1
- Arrow used for connecting two states and certain condition is given for changing the state.
- In this case we give [speed > 15 ]
- It means when speed is above 15 then transition happen and state change from gear1 to gear2
State flow Chart :-
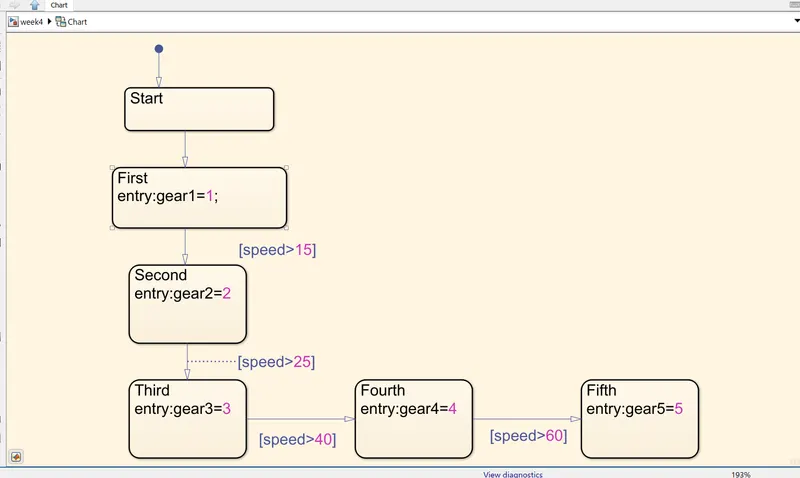
Symbol Pane
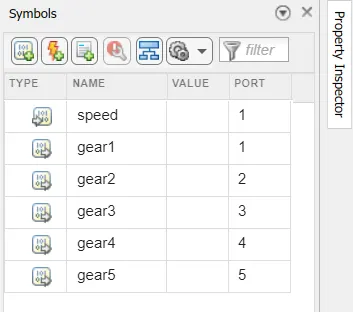
Here Speed is Input Signal and
Remaining all gears are output signal
- For input signal we used slider block connected to constant block.
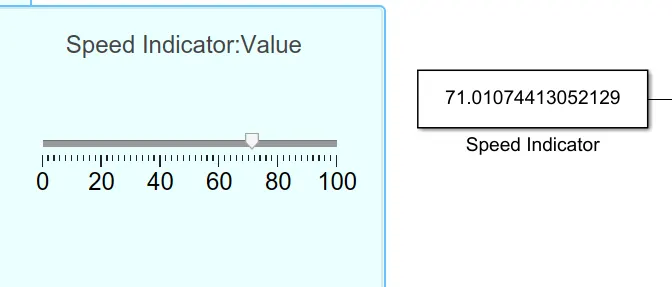
In this slider block just slide the arrow to increase or decrease the speed.
Then speed is reflected to constant block
Constant block is connected to chart.
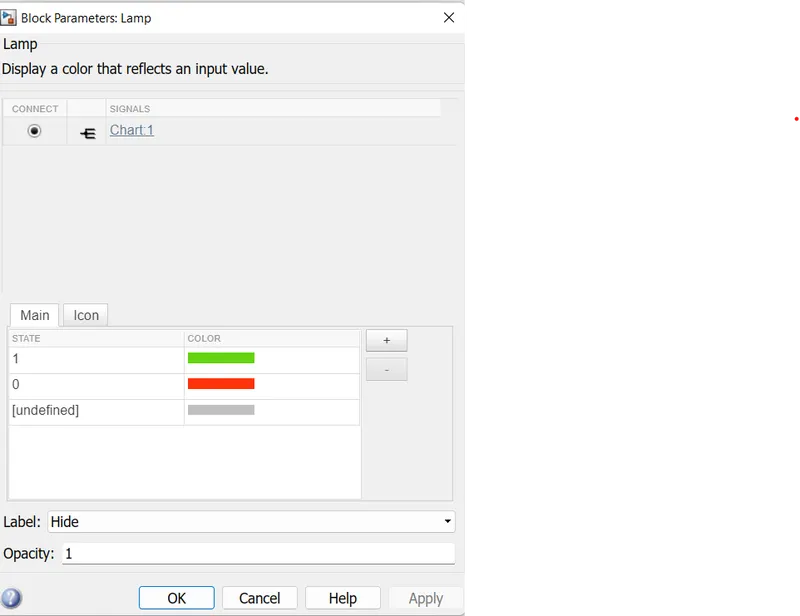
- Lamp use for every gear display
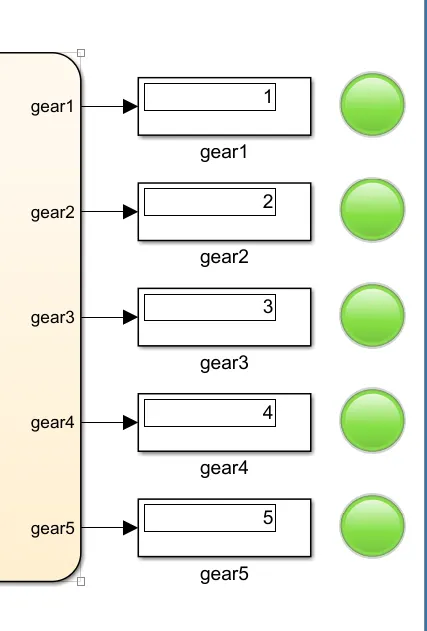
when gear display shows 1 then it indicates Green light.
when gear display shows 0 then it indicates Red light.
gear 2 = 2 indicate Green Light, 0 indicates Red light.
gear 3 = 3 indicate Green Light, 0 indicates Red light.
followed for further gears
Procedure :-
1 Initial Condition
At the starting conditon when speed is = 0, then all gear displays shows 0 value
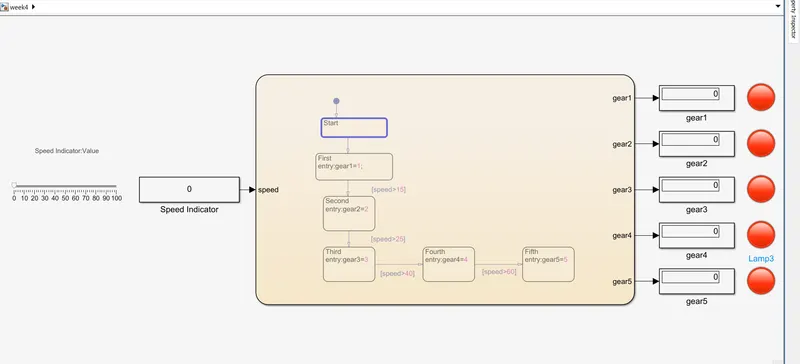
As we increase the speed value stepwise then stepwise all gears are acticated.
{ 10 , 20, 30, 45, 71 }
1 - Speed = 10 , Gear 1 is activated and shows green light
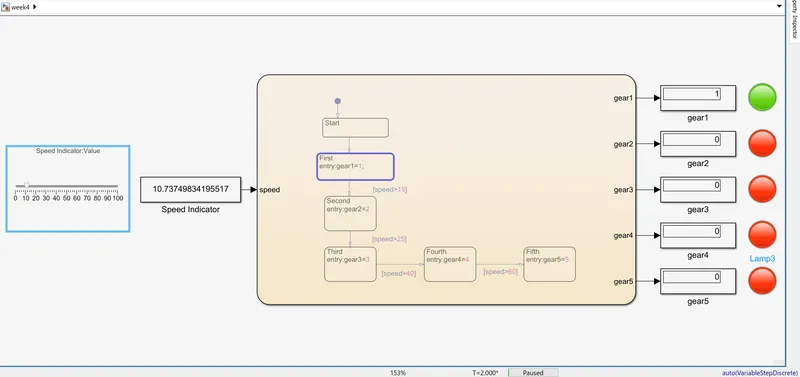
2 - Speed = 20 , Gear 2 is activated and shows green light
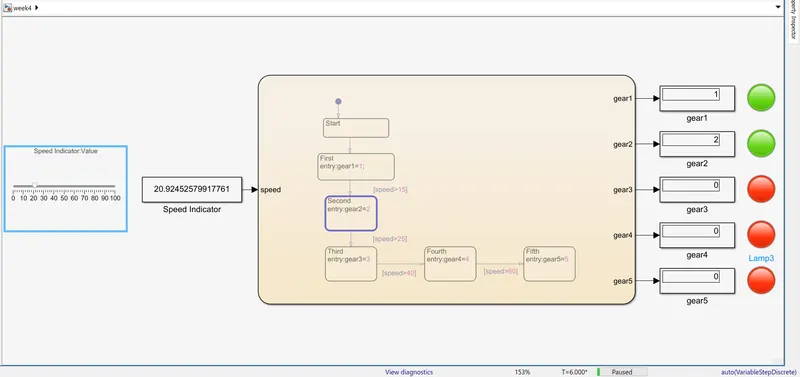
3 - Speed = 30 , Gear 3 is activated and shows green light
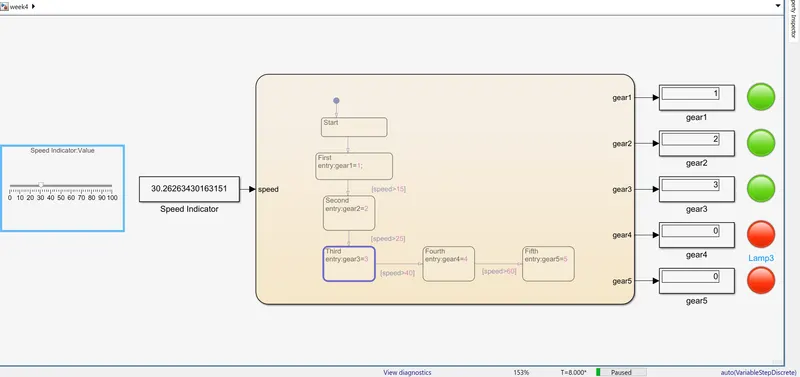
4 - Speed = 45 , Gear 4 is activated and shows green light
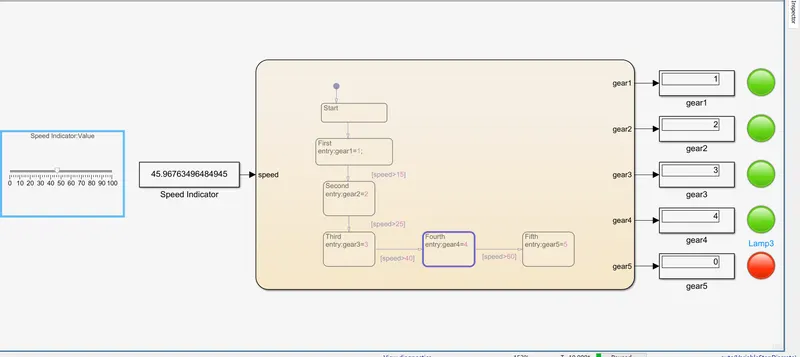
5 - Speed = 71 , Gear 5 is activated and shows green light