Week - 4
CONTROL LOGIC FOR GEAR SHIFTING AND WASHING MACHINE USING STATEFLOW.
AIM.
- . To implement control logic of a washing machine using state Flow as per given sequence.
- . Make a Simulink chart for the GEAR SHIFT logic as per given conditions.
OBJECTIVE.
- . In Simulink implement the control logic of a washing machine using state flow as per given input conditions. Create a model and operate the model logic system and display the output of the results by using lamp indicator.
- . To create a model for gear shifting logic as per given conditions. To give the speed input while simulation is running and display the gear number.
QUESTION 1)
STATE FLOW: - State flow provides a graphical language that includes state transition diagrams, flow charts, state transition tables, and truth tables. By using state flow to describe how MATLAB algorithms and Simulink models react to input signals, events and time-based conditions.
CONTROL LOGIC: - Control logic is model system logic using state machines flowchart and truth tables.
CONTROL LOGIC OF A WASHING MACHINE USING STATE FLOW: -
State flow is a Simulink tool to implement the state machine. Here, the model system logic of a washing machine using state flow has been done.
STEP 1: - To create a chart and enter the given input conditions.
Input conditions:
- If the power supply is available the system gets activated.
- If the water supply is not available stop the process and indicate through LED.
- The soaking time should be 200s followed by washing time of 100s.
- Then rinsing happens for the next 20s and dryer runs for 50s.
After all the process is completed turn on the finish LED
SIMULINK MODEL CREATION: -
Step 1). Open the Simulink model and get the CHART block.
Step 2). Provide the input states and output states for the chart for given conditions, the POWER supply and WATER supply is taken as inputs and water, soaking, washing, rinsing, drying & finish are taken as the output states. Double click the chart block >choose symbol pane option and you can define the input and output states.
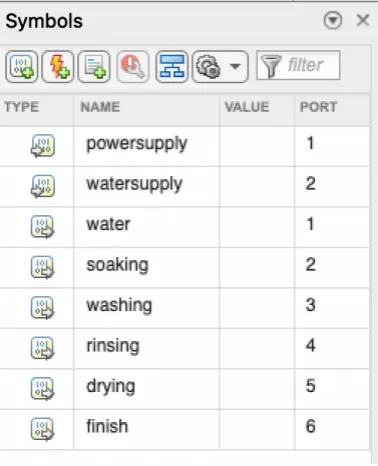
Step 3). After describing the input and output states connect two constants as input values i.e., 1 for ON 0 for OFF. Then connect displays to the output states defined. After giving these conditions our chart will look as follows: -
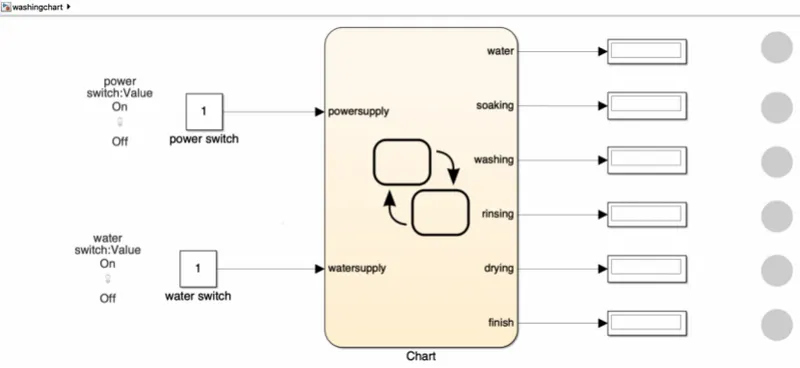
Step 4). Double click the chart block icon to create the chart flow for the given washing machine conditions.
STEPS TO CREATE THE FLOW CHART: -
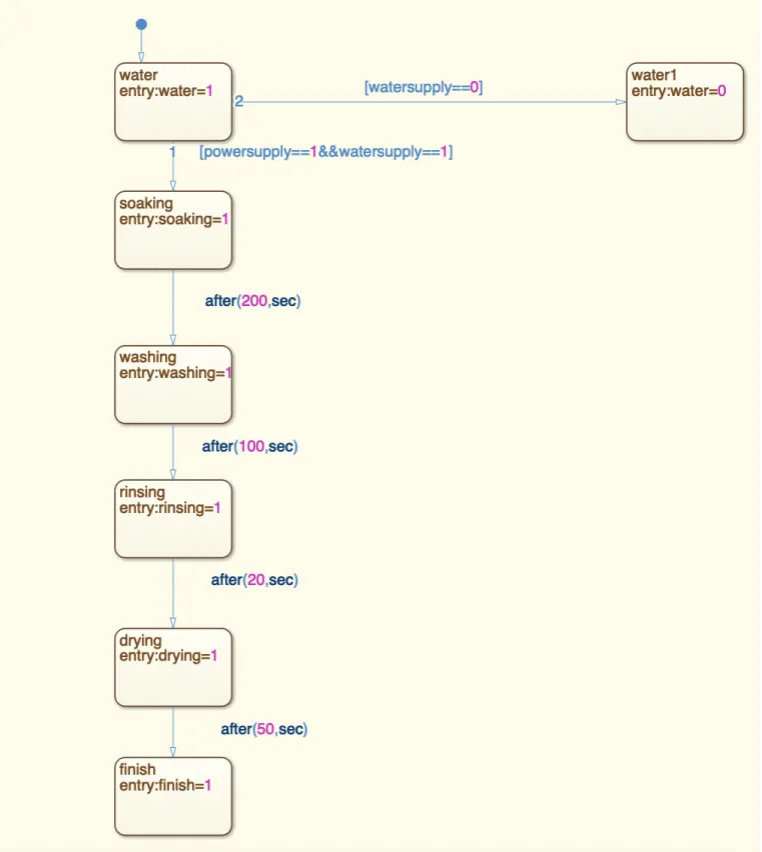
Step 1). Seven state blocks are chosen to define the given conditions.
Step 2). Give separate block names for all the chosen blocks for different states. Here our states start from filling water, then soaking followed by rinsing, drying and the process is finished.
Step 3). When the power supply and water supply is 1 it will be ON, the state flow will continue and proceed to the next state.
Step 4). Then for each state the conditions given are defined.
Step 5). To attach the indicators, library browser>>dashboard>>lamp.
Step 6). Choose toggle switch for providing inputs on and off.
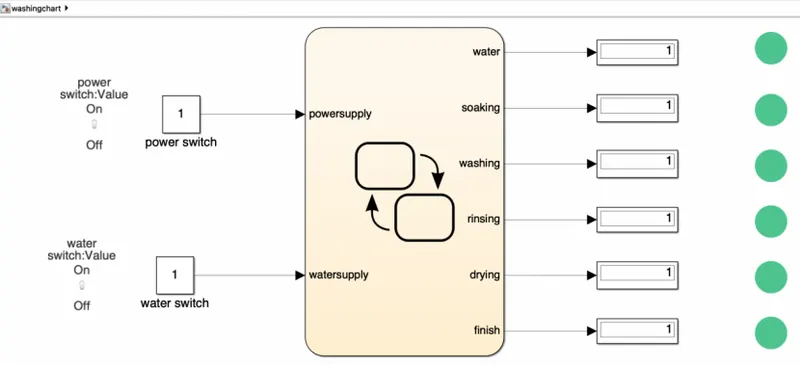
Step 7). Connect all Led's with respective displays and Green color for on (1) and red color for off (0)
Condition 1). when both power supply and water supply are on: -
Condition 2). when both power supply and water supply are off: -
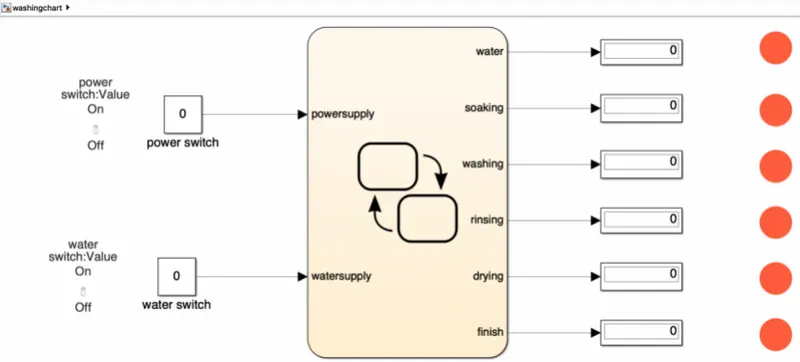
Condition 3). when water supply is stopped: -
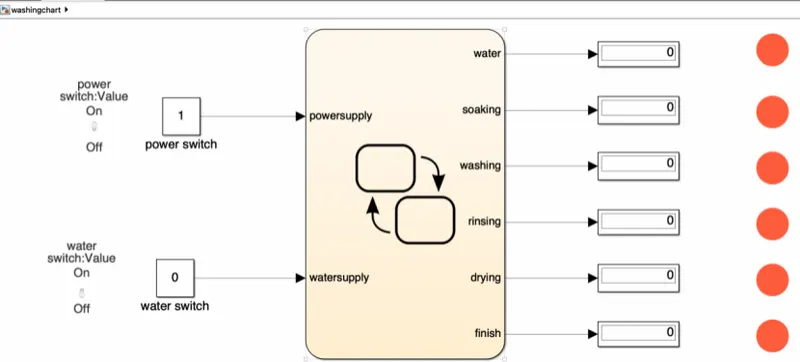
Question 2): - to make Simulink chart for gear shift logic as per conditions:
Speed range(kmph) gear
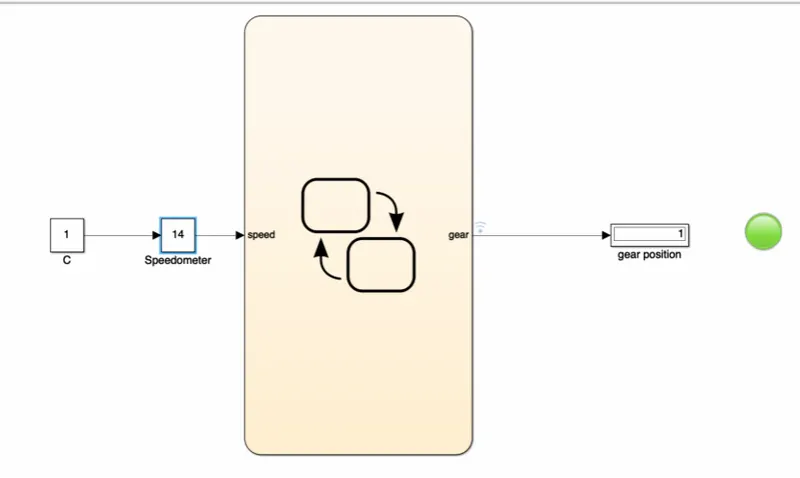
0 to 15 1
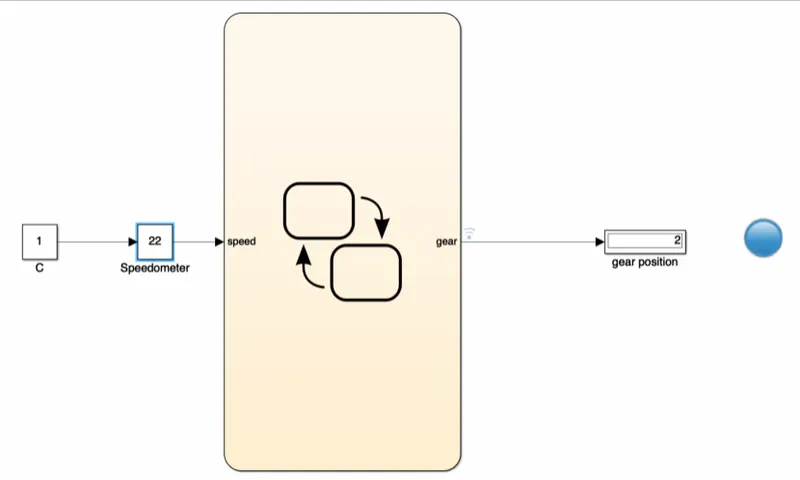
16 to 25 2
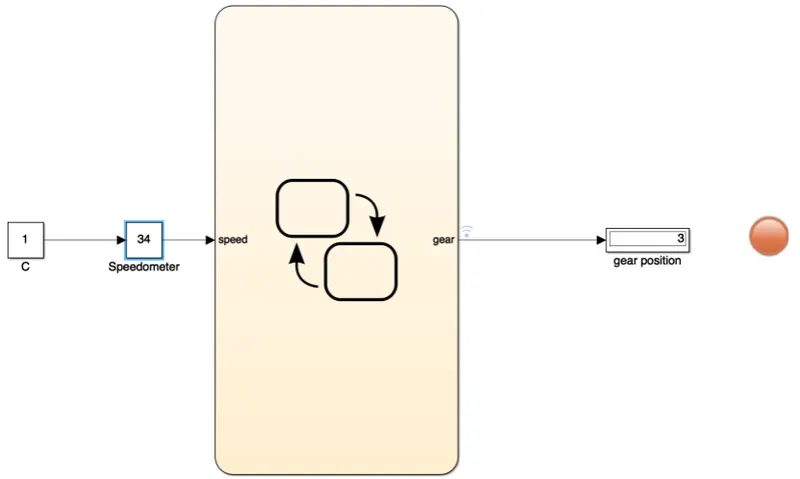
26 to 40 3
41 to 60 4
>61 5
SIMULINK MODEL CREATION: -
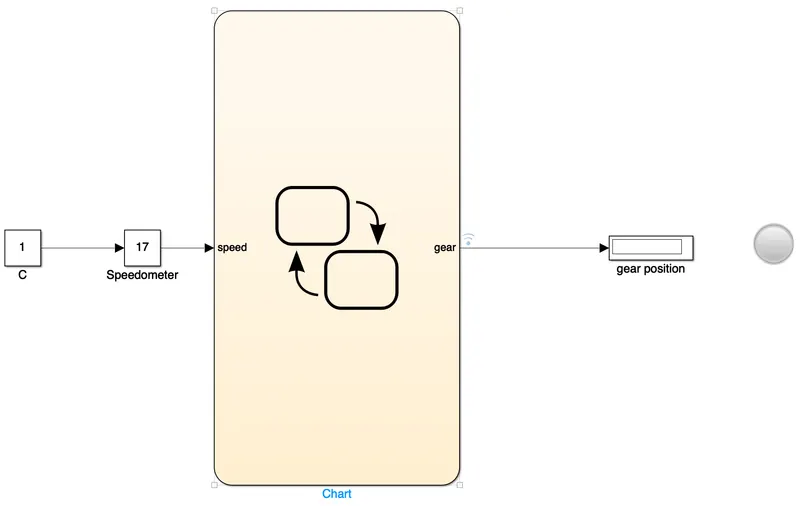
Step 1) Choose the chart block define the input condition as speed and output as gear. A constant block is connected to a slider gain to give the speed in KMPH and display block is connected to display block is connected to display the gear number.
Step 2) Now double click the chart block and the flow chart for the gear shifting logic is created.
Step 3) For the gear states the respective speed range is defined. Since it's a two-way flow for greater than conditions one set of flow is defined and for the next set of lesser speeds the corresponding condition is defined as follows: -
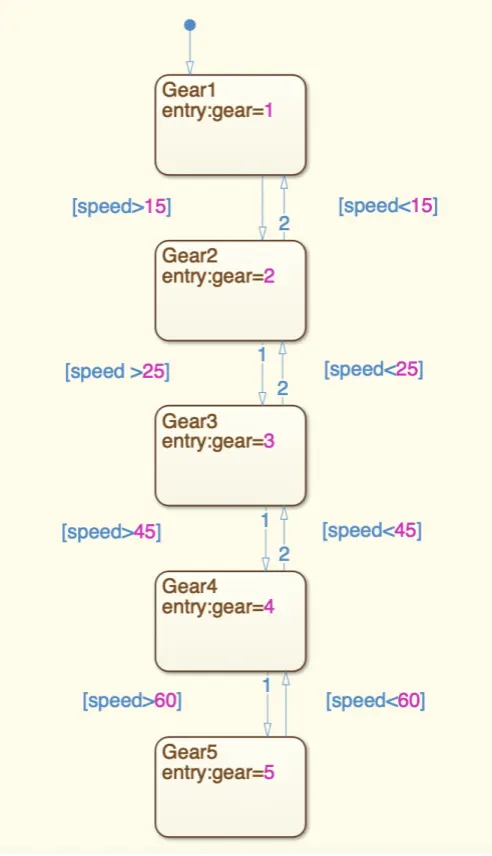
Step 4) Now connect a led indicator for different gears and colors are defined as follows
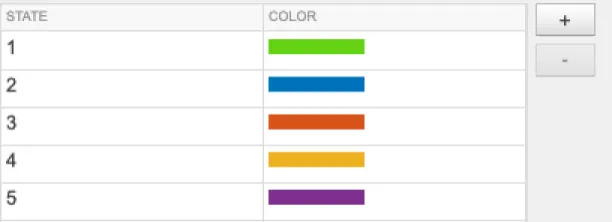
The final block diagram is
For given speed 14kmph
For given speed 22 kmph
For given speed 34kmph
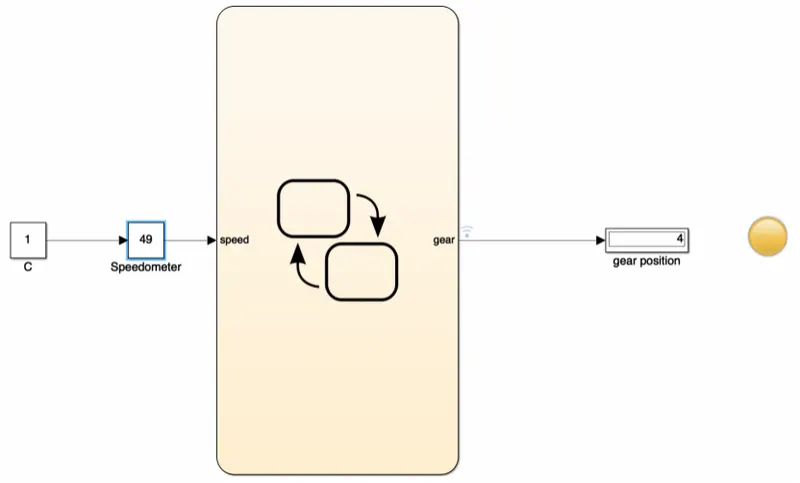
For given speed 49kmph
For given speed 85 kmph
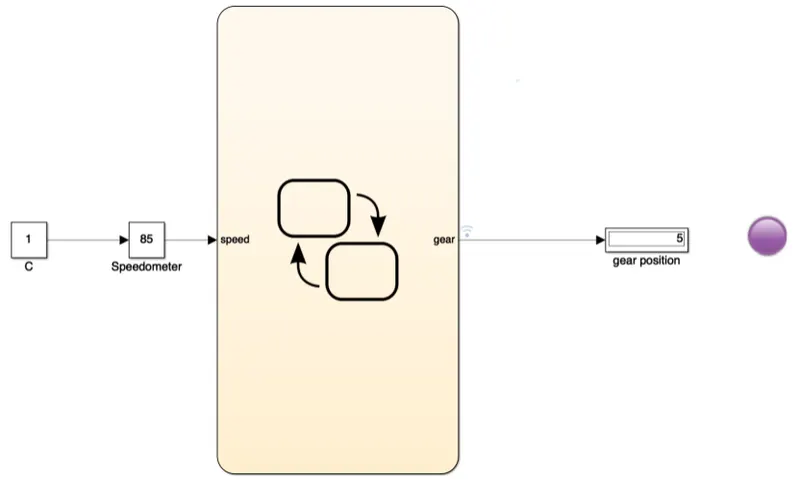
Hence for different speeds given the display is shown respective LED and number .
the both .slx files uploaded in answer box