Week - 4
Aim:
- Implement control logic of a “washing machine” using Stateflow as per given sequence:
- If the power supply is available, the system gets activated
- If the Water supply is not available, stop the process & indicate through LED
- Soaking time should be 200s followed by Washing time of 100s.
- Then rinsing happens for next 20s & dryer runs for 50s
After all the processes have completed turn on the finished LED
2. Make a Simulink chart for the “Gear shift” logic as per below conditions:
Speed Range(kmph) Gear
0 to 15 1
16 to 25 2
26 to 40 3
41 to 60 4
Above 61 5
Give speed input while the simulation is running & display the gear number.
# Part 1: Implementation of control logic chart for Washing Machine using Stateflow process:
1.Start simulink and create a blank model.
2.Search for chart block in the stateflow category of library browser.
3.Open the chart block and select the junction feature from the stateflow window.
4.Control logic for washing m/c is such that it should soak the water for the first 200sec followed by washing time of 100sec. Rinsing the water for the next 20sec followed by drying time of 50sec.
5.After finishing the control logic run the STATEFLOW and check the sequence of operation for 370sec.
Blocks Used
- Chart
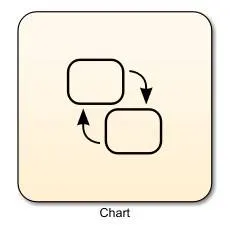
A finite state machine is a representation of an event-driven (reactive) system. In an event-driven system, the system responds to an event by making a transition
from one state (mode) to another. This transition occurs if the condition defining the change is true.
- Display
The Display block shows the value of the input data. You can specify the frequency of the display. For numeric input data, you can also specify the format of the display.
- Constant
The Constant block generates a real or complex constant value signal. Use this block to provide a constant signal input.
- Lamp
The Lamp block displays a color indicating the value of the input signal. You can use the Lamp block with other Dashboard blocks to build an interactive dashboard of controls and indicators for your model. You can specify pairs of input values and colors to provide the information you want during the simulation.

- Toggle switch
The Toggle Switch block toggles the value of the connected block parameter between two values during simulation.
Model :
Simulink block diagram :
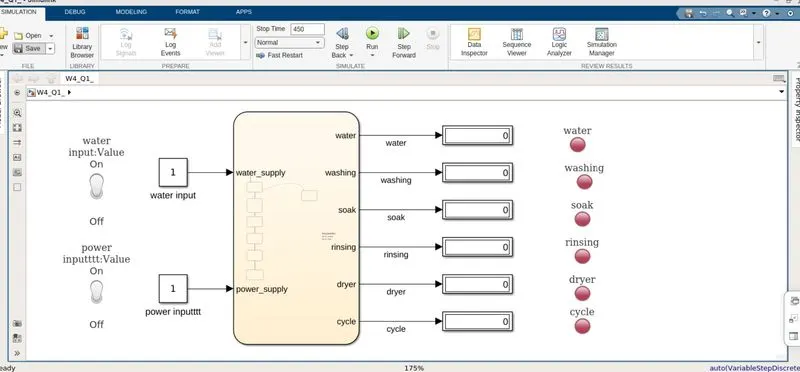
Chart:
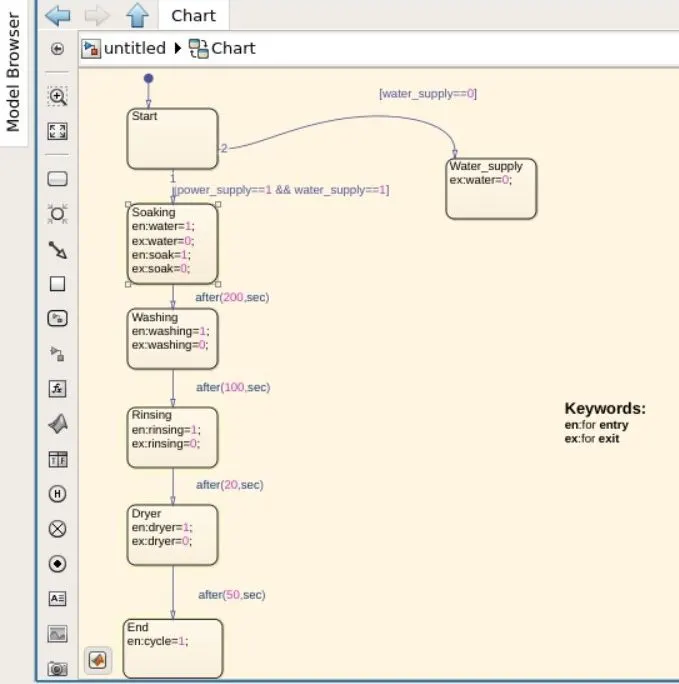
Parameter:
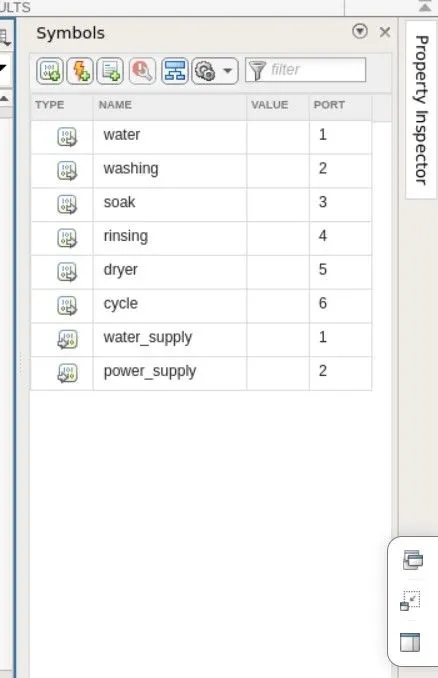
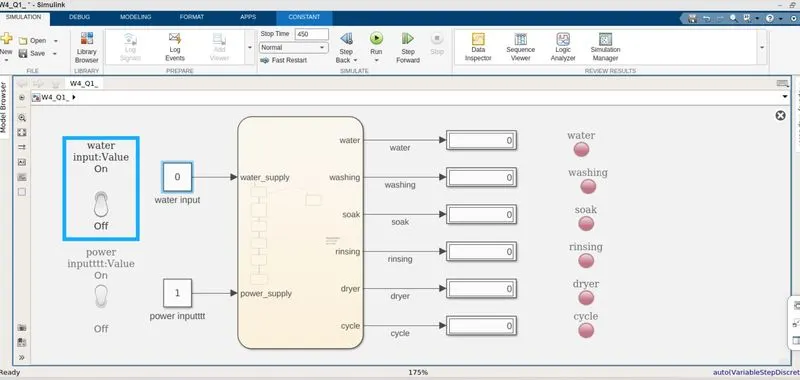
we have given Water, Washing, Rinsing,Dryer,Cycle as an output of chart.
we have given Water supply and Power supply as an input of chart.
We have used 450,sec so that it can cover the whole cycle and sufficient time to store and solve pameters.
OUTPUT:
There are two condition asked to solve in the question
Condition 1: when water supply is OFF.
we should not proved water supply and check for output.
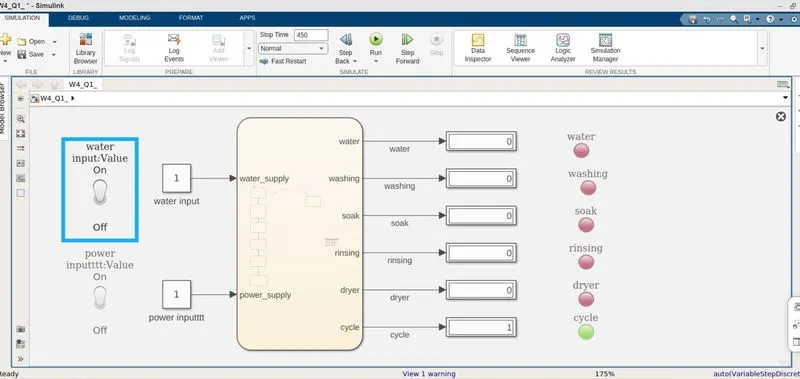
Condition 2: when water supply is ON
now we are providing water supply and check output.
Parameter: Conditions:
1. value '1' means there is input. 1. when lamp shows Green, The task is In Progress.
2. value '0' means thre is no input 2. when lamp shows Red, The task Ends.
As we can observe from the above fig. all the states have been executed and indicating the process completion indicator (name as cycle ) showing green.
Conclusion :
The Simulation of the Washing machine using state flow is done and the result is satisfactory.
.............................................................................................................................................................................................................................................................................................................................................................................................................................................................................................................................................................................................................
# Part 2: Make a Simulink chart for the “Gear shift” logic as per below conditions:
Speed Range(kmph) Gear
0 to 15 1
16 to 25 2
26 to 40 3
41 to 60 4
Above 61 5
Give speed input while the simulation is running & display the gear number.
PROCESS:
1.Start simulink and create a blank model.
- Search for CHART block in the stateflow category of library browser.
- Open the chart block and select the various features from the stateflow window.
4.Control logic for gear shift is such that it should change the gear when the speed increases of decreases automatically.
5.After finishing the control logic run the stateflow and check the gear shift operation for an infinite time.
Model :
Simulink Block diagram:
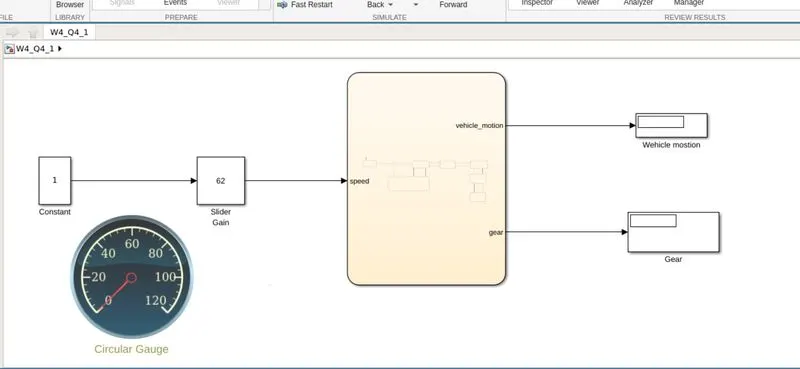
Stateflow chart :
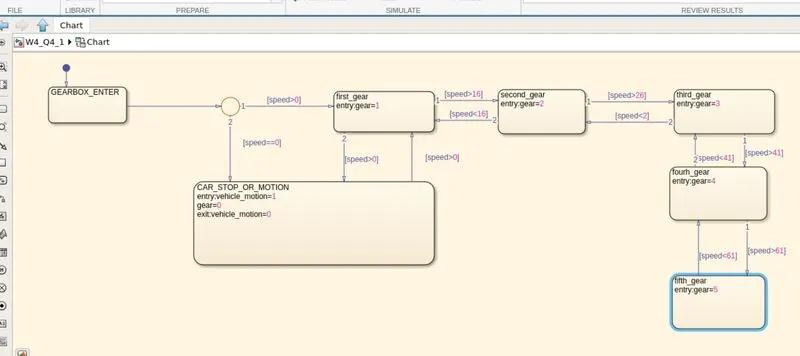
Output :
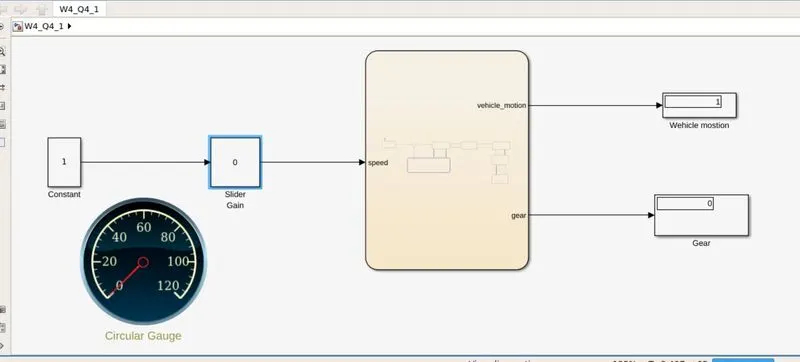
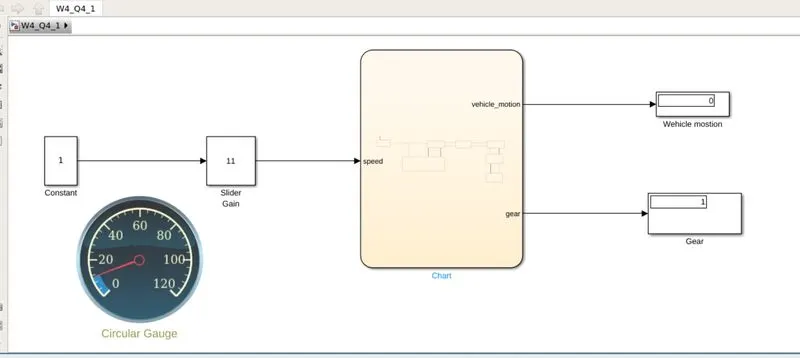
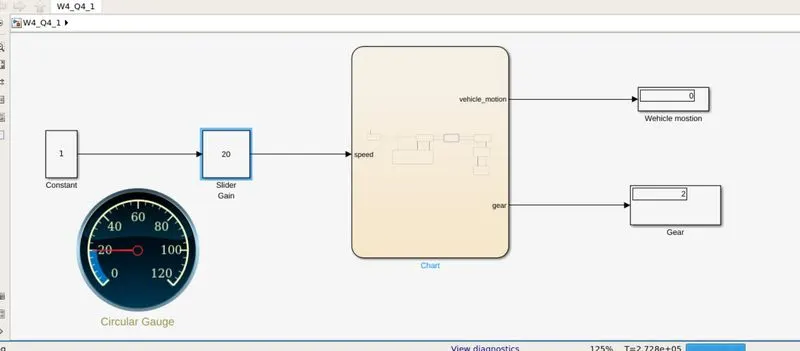
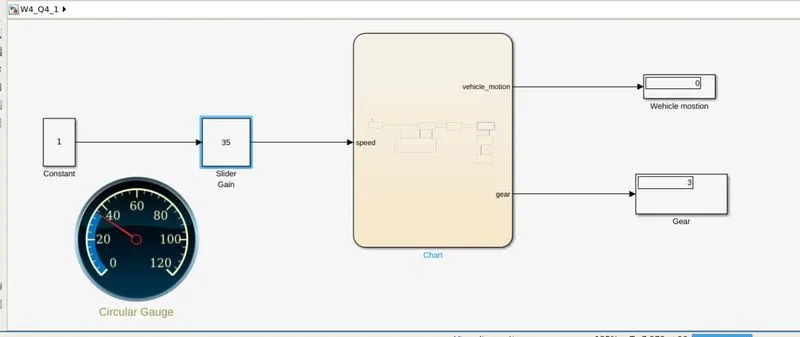
Note:- Here the stop time is given as inf.(i.e.infinty). Because the user can provide whichever speed value as many times as he wants during the simulation time, so the simulation can be long enough.
#1: when the speed is 0 (i.e. vehicle stope condition) and gear shift is made
#2: When the speed is 11kmph, Gear shift is made to 1 and the vehicle is motion.
#3: When the speed is 20kmph, Gear shift is made to 2 and the vehicle is motion.
#4: When the speed is 35kmph, Gear shift is made to 3 and the vehicle is motion.
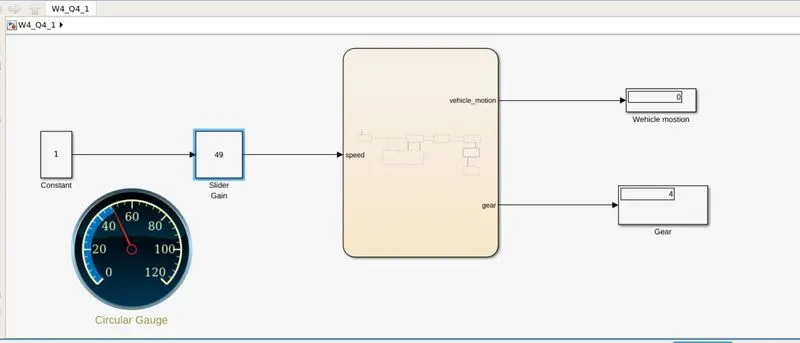
#5: When the speed is 49kmph, Gear shift is made to 4 and the vehical is motion.
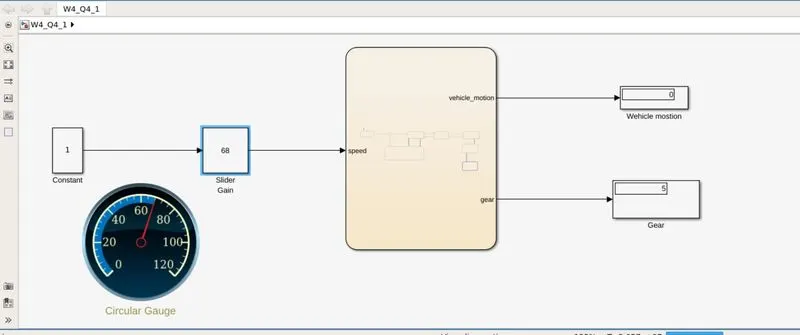
#6: When the speed is 68kmph, Gear shift is made to 5 and the vehicle is motion.
CONCLUSION:
The simulink design using stateflow chart for the gear shift is successfully made.