Week - 4
AIM
To implement a control logic of a WASHING MACHINE using stateflow for the given sequence.
GIVEN
- If the power supply is available,the system grts activated.
- If the water supply is not available,stop the process and indicate through LED.
- Soaking time should be 200s followed by washing time of 100s.
- Then rinsing happens for the next 20s and dryer runs for 50s.
- After all the processes have completed turn on the finished LED.
MODEL
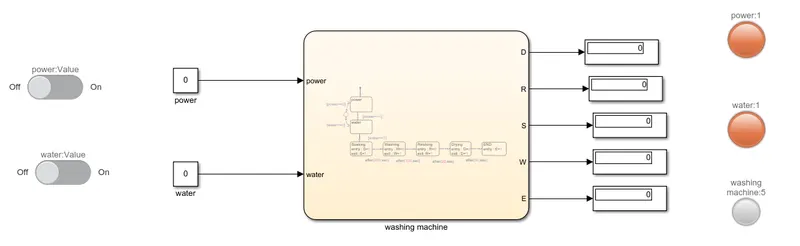
STATEFLOW
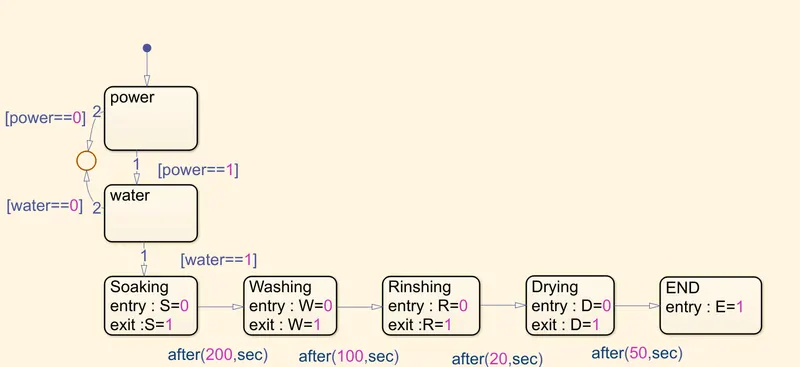
SYMBOL
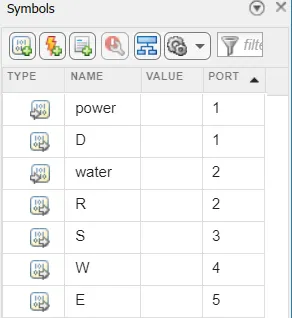
power and water are given as input data.
D,R,S,W,E are given as output data.
D=DRIVER
S=SOAKING
R=RINSING
W=WASH
E=END
BLOCKS USED
- SLIDER SWITCH
- CONSTANT
- CHART
- DISPLAY
- LAMP
BLOCKS USED INSIDE CHART
- States are used in chart.
DESCRIPTION
- Power and switch inputs were controlled by the SWITCH block.These two inputs were directed to the CHART block.
- STATE blocks were used inside chart to creatye a stateflow according to the given creteria.
- The POWER input as get input in the chart and directed to the power state from P==1 when supply ON,it is directed to the next water blockP==0 when supplyOFF,If it is directly connected to the junction.
- Next state is WATER and from that if water==1,if supply ON,it moves to the next stage or if water==0,if supply OFF,then it directed to the junction.
- Next water is SOAKING state,ENTRY is given as 0,while EXIT is LED is made to glow which is connected to this state.
- After200s,it is directed to WASHING state,and 100s it is directed to RINSING state and after 20s,to DRYING state and after 50s, it is ENDED to END state.
If power supply is ON, the system gets activated.if the water supply is not available,stop the process and indicate through LED.
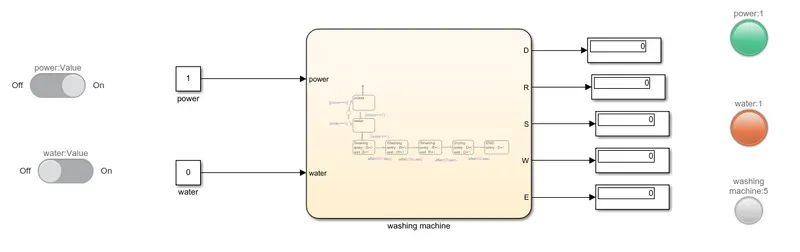
Power supply is given 1,and LED denoting poer is glowing GREEN which shows the system is activated and water is OFF with help of slider switch and the LED is denoting RED which indicates the off state of water supply.
When water supply is given as 1 (ON).
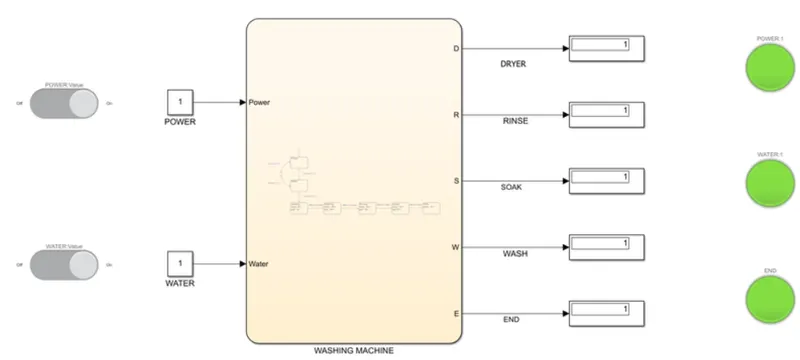
After all the process have completed turn on the finished LED.
(B)Make a simulink chart for the GEAR SHIFT.
Given data
speed range(kmph) Gear
0to15 1
16to25 2
26to40 3
41to60 4
Above 61 5
MODEL
CHART
SYMBOLS
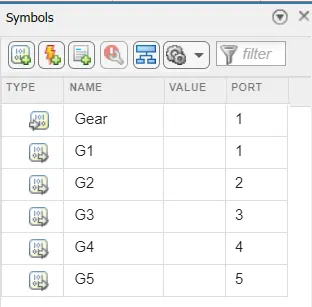
Gear as input and G1,G2,G3,G4 are output.
BLOCKS USED
- SLIDER
- CONSTANT
- CHART
- DISPLAY
- LAMP
- STATE USED IN CHART
DESCRIPTION
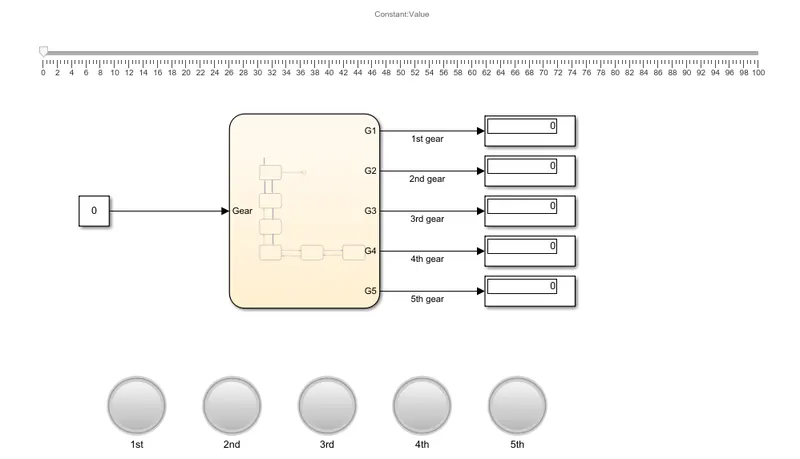
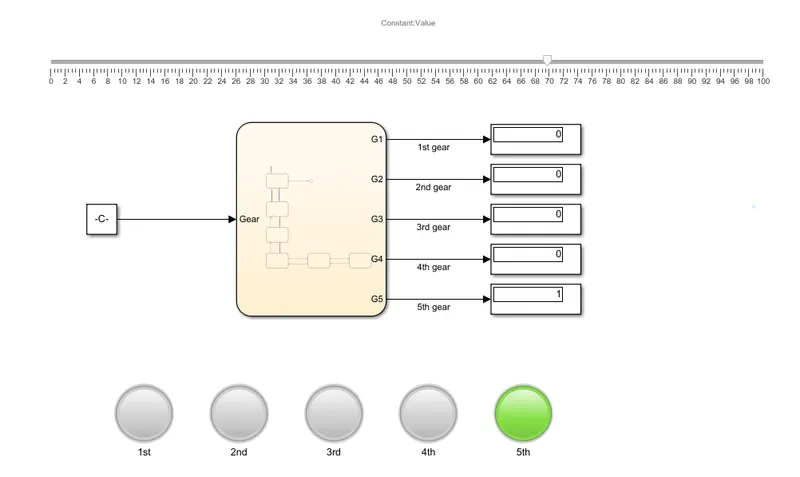
- Using the SLIDER block as input are varied and run as different time and connected to the constant block.
- The constant block is used to vary the input as given values and the constant block is connected to chart.
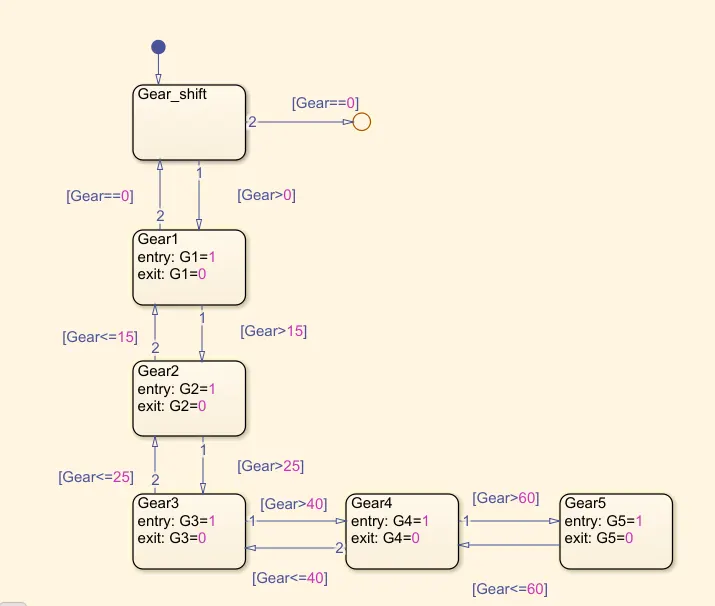
- first the input values are generated in GEAR_SHIFT and connected to the G>0,G==0 as input and output.
- If gear 1 moves to G>15 and it maybe G<=15 it crosses the inbetween values.
- G>15 it moves to the gear 3 state.
- If G>40 it moves to the gear 4 and G>60 it moves to gear 5 state.
- LAMP is connected with the gear output.
- Display block is connected with all block gear output.
1 GEAR
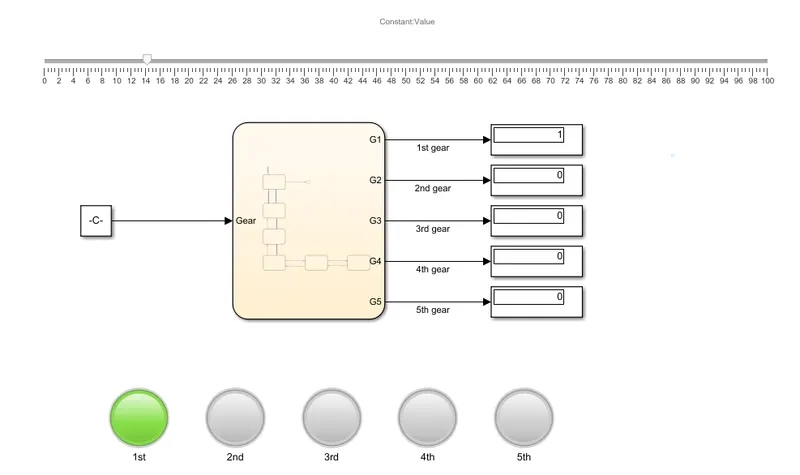
2 GEAR
As speed input is above 15,it shifts to the second gear and the lamp for 2nd gear and 1st gear lamp is off.
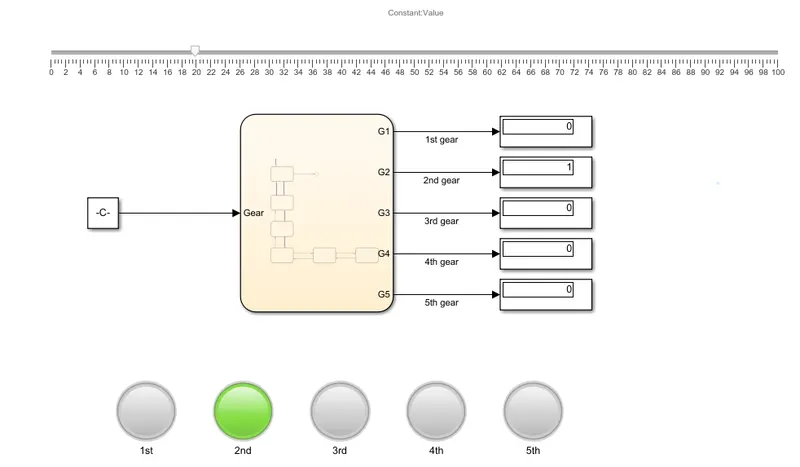
3 GEAR
As speed increases more than 25,it shifts to 3rd gear.
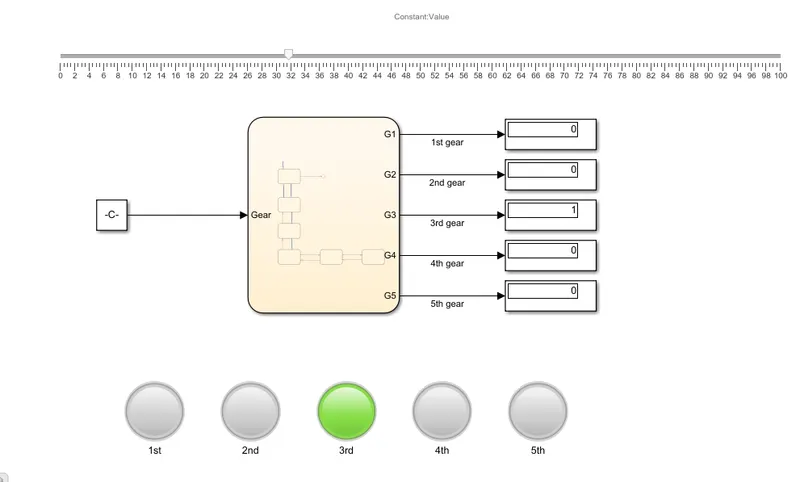
4 GEAR
The speed increases the gear shift to 4th gear.
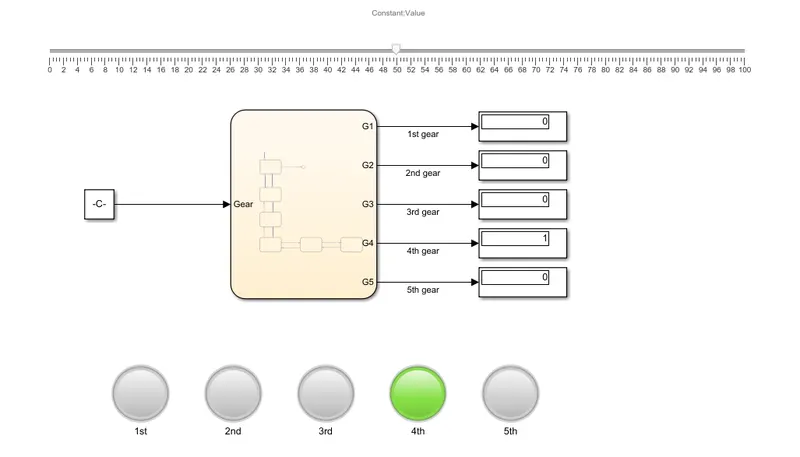
5 GEAR
As speed increases mpre than 60,it shifts to 5th gear.
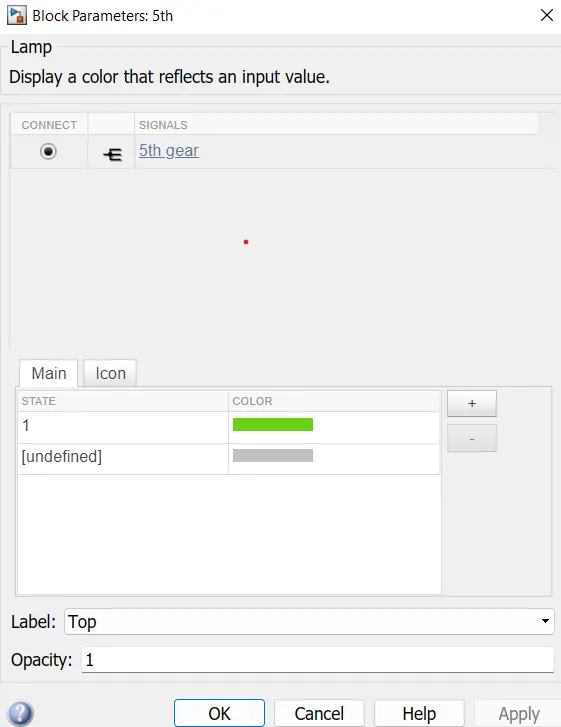
LAMP PARAMETER
RESULT AND CONCLUSION
The given sequence is implemented through a simulink chart .