Week - 4
1
Aim-
To implement control logic of a washing machine using stateflow in simulink.
Ans-
The Simulink model with the stateflow chart of control logic of a washing machine is shown below-
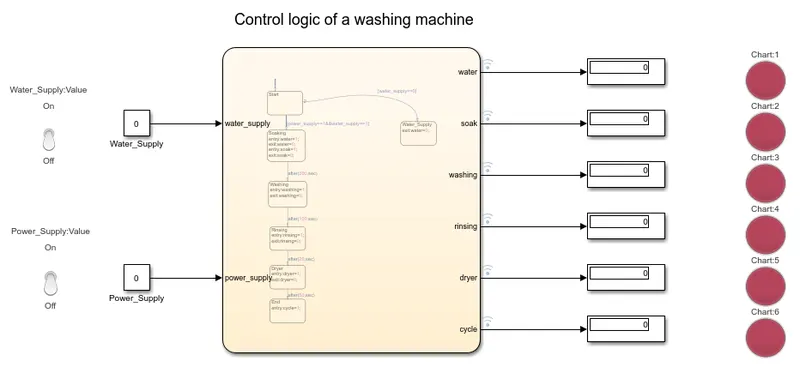
Chart representation-
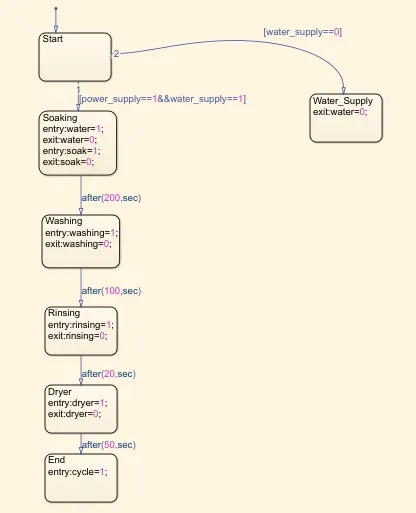
The stateflow chart is prepared as for desired time period and input conditions.
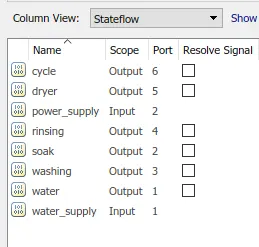
The input/output parameters-
In this chart, water_supply and power_supply is taken as input parameter and water, soak,washing, rinsing, dryer and cycle is taken as output parameter.
Block used-
i). Chart- This block is used to prepare stateflow model.
ii). Constant with slide switch- A switch is used which is connected to constant to fed input as water_supply and power_supply.
iii). Display with lamp- Lamp is used to indicate the output signal using LED and connected through output signal.
If LED is red then OFF state

If LED is green then ON state

Result-
Proper justification of result is given below-
As desired if power supply is given then system will be activated.
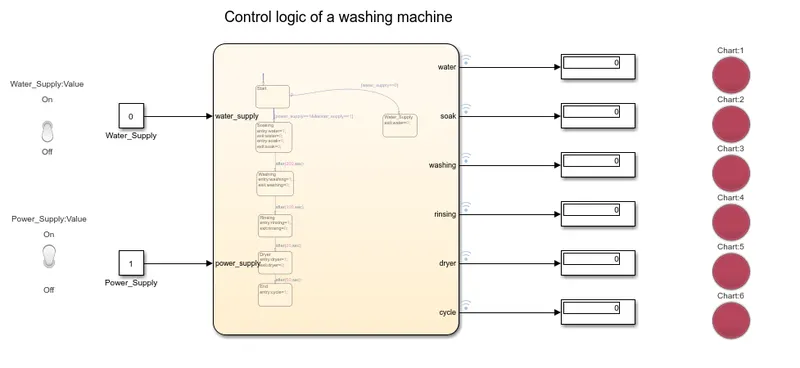
If power_supply=1, then there are two condition at which simulation will work-
a). If water_supply is not available, then all system and process will stop and LED shows Red light as shown below-
b). If water_supply is available, then next process will start as desired. There are alloted 200sec for soaking time, next 100sec for washing time and then 20sec for rinsing after that 50sec as dryer time.
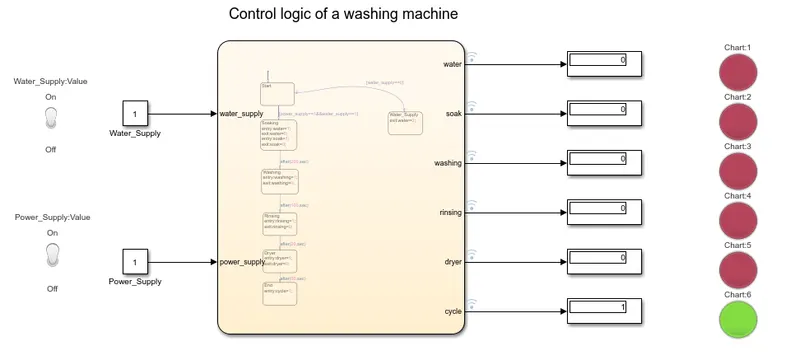
And after finishing all process, the LED light glows Green that indicates to end all process and end cycle display high value i.e. 1.
Conclusion-
The Simulation of washing machine using stateflow is developed and obtained desired output.
2.
Aim-
To design a simulation chart using stateflow for gear logic to set gear for desird speed range automatically.
Ans-
Model- The Simulation model of Gear shift is shown below-
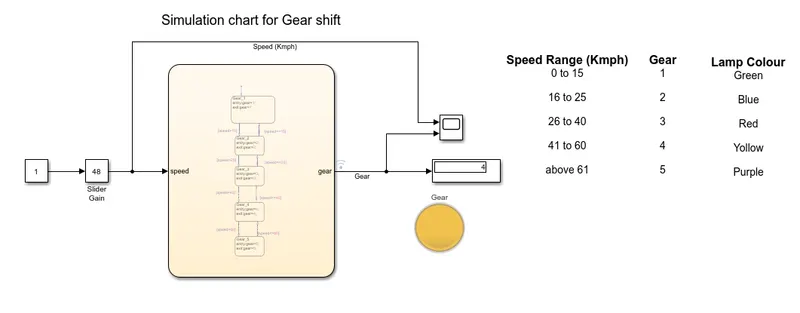
Chart-
Parameter setup-
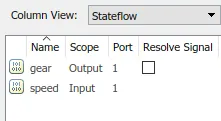
Here, speed (Kmph) is set as input parameter and gear no. is set as output parameter.
Block used-
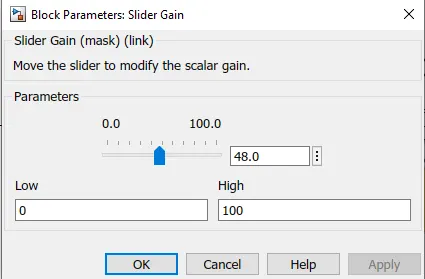
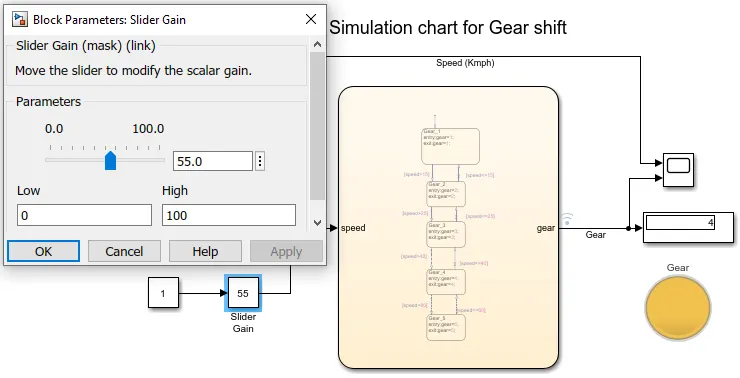
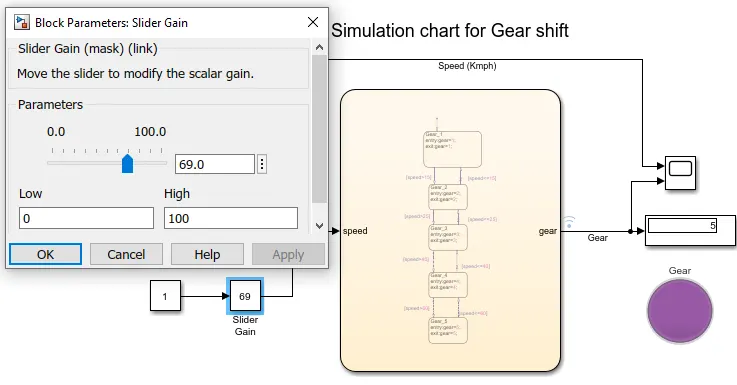
Slider gain- This block is used to variable value by moving the slider on the scale as shown in figure-
Contant- Constant value of 1 is added to input of slider gain.
Display and scope- Scope shows the graph to study for every instant and display is uesd to see the value.
Lamp- Lamp is used to show gear no. for different gear it shows different colour.
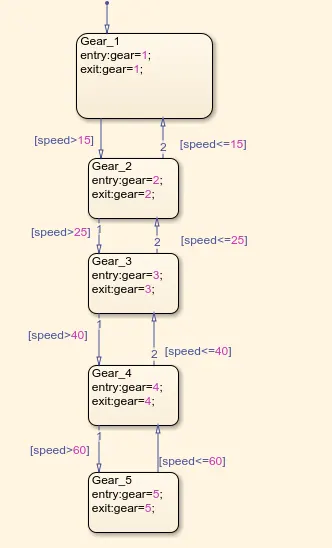
Chart- Chart is used make the stateflow logic.
Result-
AS the speed changes in input the gear no changes in output and colour of LED also changes with gear.
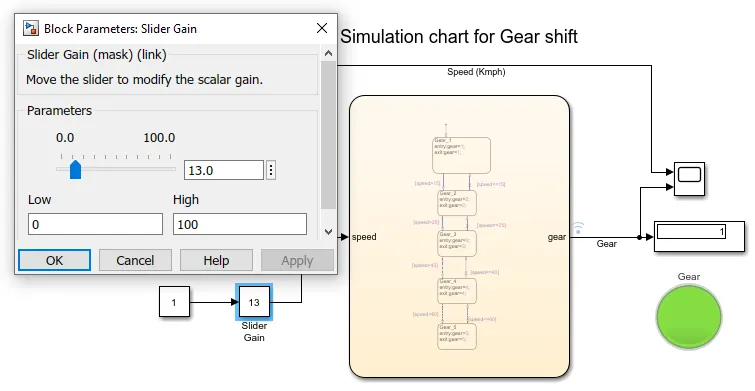
For speed range (0 to 15) Kmph, It shows Green colour and set at Gear 1.
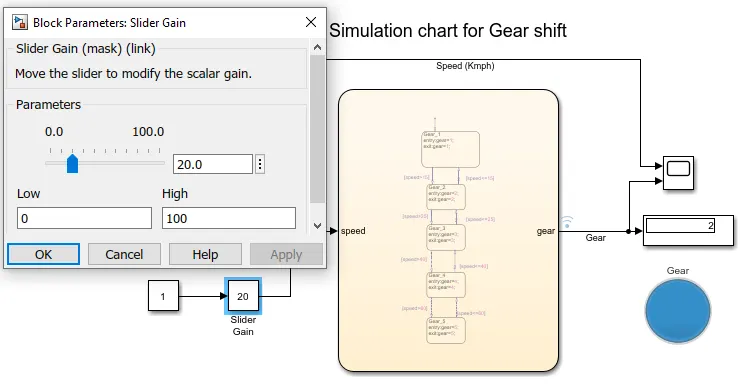
For speed range (16 to 25) Kmph, It shows Blue colour and set at Gear 2.
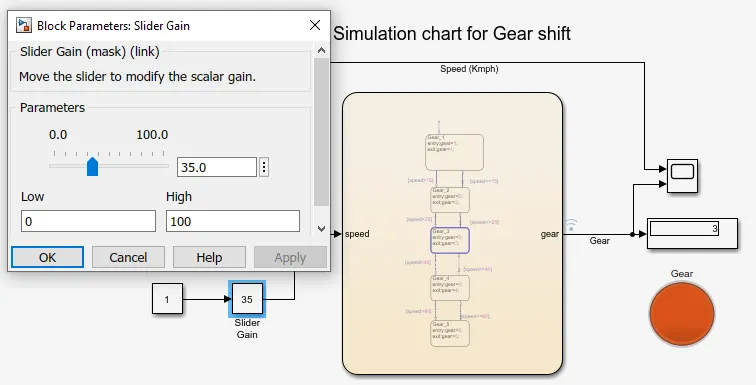
For speed range (26 to 40) Kmph, It shows Red colour and set at Gear 3.
For speed range (41 to 60) Kmph, It shows Yollow colour and set at Gear 4.
For speed range (Above 61) Kmph, It shows purple colour and set at Gear 5.
Conclusion-
Simulation model using chart for the Gear shift logic at desired condition is developed and as input speed varies the gear no. is displayed correctly.