Week - 4
AIM: To implement a control logic of a "washing machine"using Stateflow as per the given sequence:
- If the power supply is available, the system gets activated
- if the water supply is not available, stop the process & indicate through the LED.
- Soaking time should be 200s followed by washing time if 100s.
- Then rinsing happens for the next 20s & dryer runs for 50s
- After all the processes have been completed turn on the finished LED.
EXPLANATION:
- State flow:- Stateflow provides a graphical language that includes state transition diagrams, flowcharts, and state transition tables by using state flow to describe how Matlab algorithms and Simulink models react to input signals, events, and time-based conditions.
- Control logic:- Control logic is a model system logic of a washing machine using state flow.
STUDY 1: Explanation for Control logic of a "Washing machine" using state flow
WASHING MACHINE:- It is a machine that is capable of handling various tasks like soaking, washing, rinsing, and drying within a short period. all the tasks performed by the machine are based on centrifugation. It is a separation process that used centrifugal force to promote accelerated settling of the particle in the solid or liquid mixture.
In other words, a washing machine is a machine that washes dirty clothes. It contains a barrel into which the clothes are placed. This barrel is filled with water and then rotates very quickly to make the water remove the dirt from the clothes. these can help make the clothes cleaner.
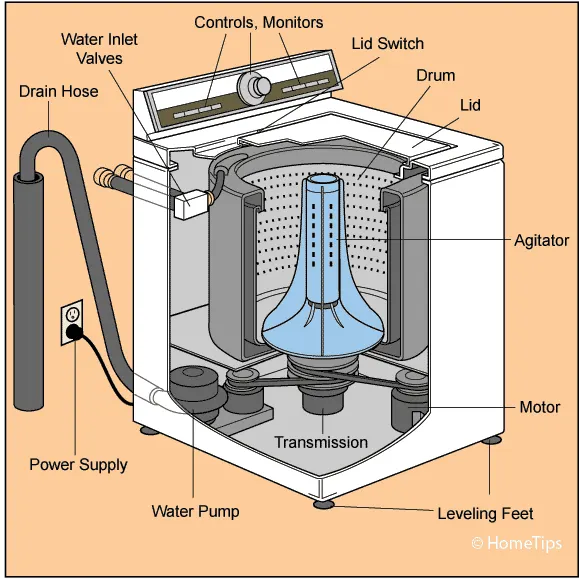
GIVEN DATA:-The different states of washing machines
- Socking-200 sec(0-200 sec)
- Washing-100 sec(200-300 sec)
- Rensing-20 sec(300-320 sec)
- Drying-50 sec(320-370 sec)
MODEL:
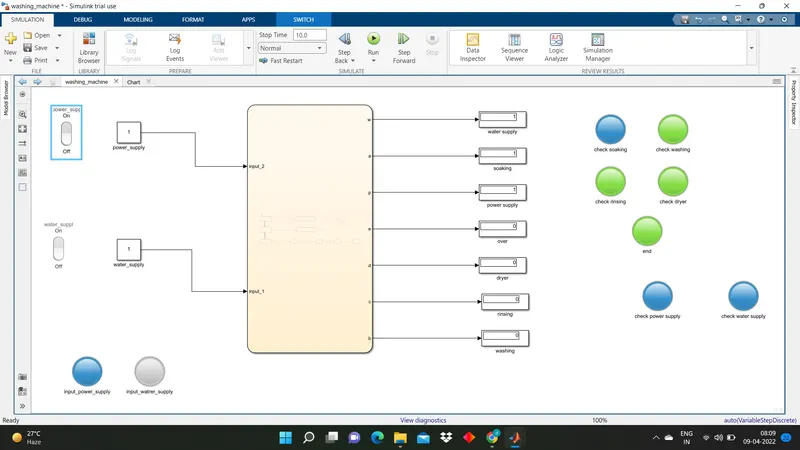
STATE FLOW:-
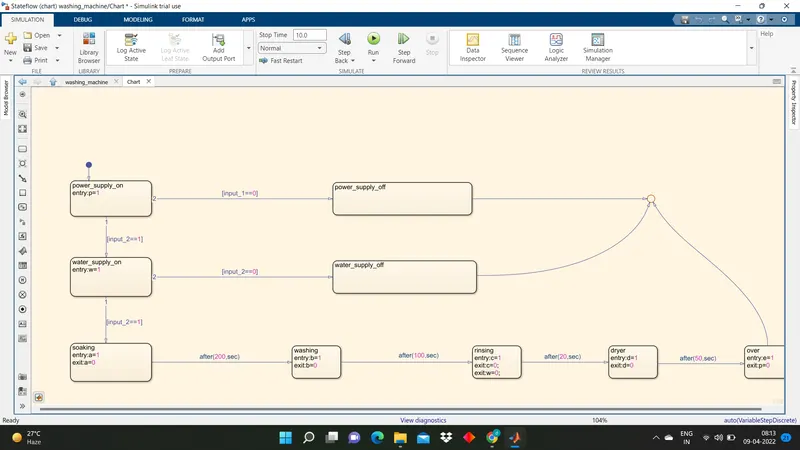
BLOCK USED IN MODEL:
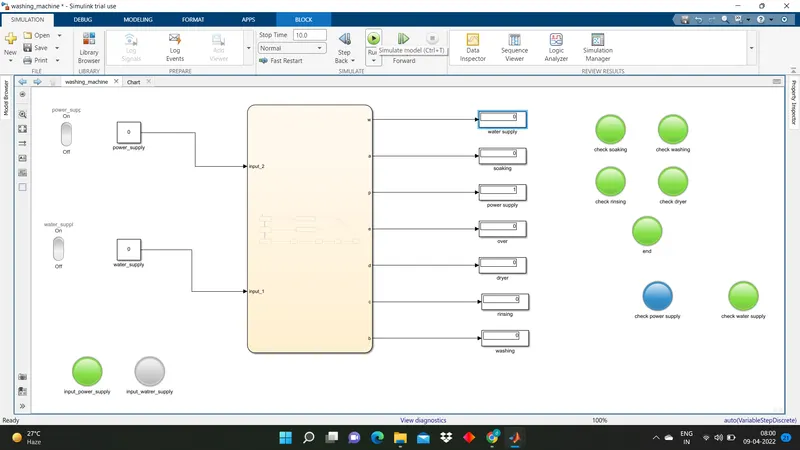
- constant: For water and power supply
- Lamp: To indicate the signal.
- Slider Switch: To turn the machine ON and OFF
- Stateflow: For control logic
- Display: To show the output signals.
Procedure:
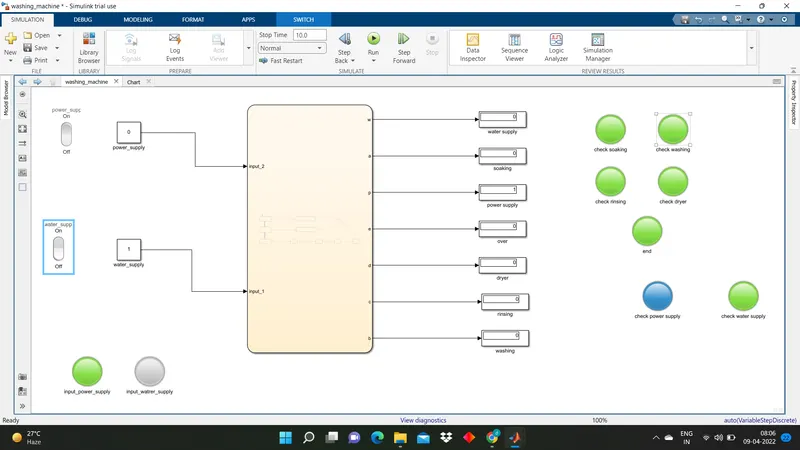
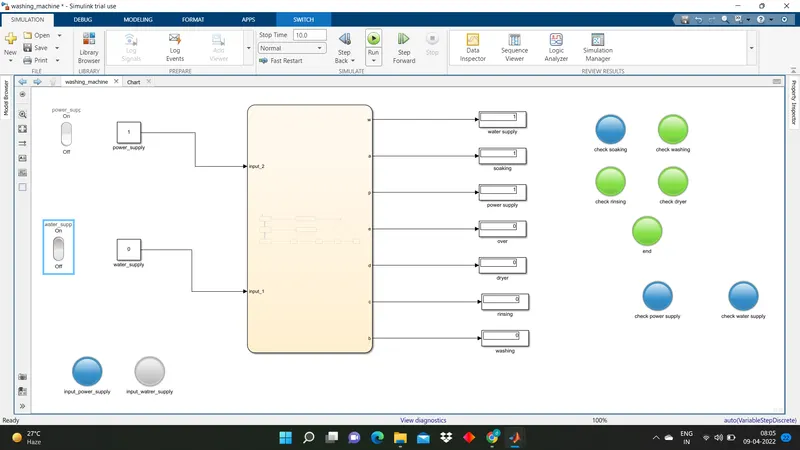
- The power and water supply to the machine are dependent upon the switch conditions which in ON or OFF and it is defined by the constant value 0 or 1.
- The signal with the given Stateflow logic. if the value displayed is 1 then the power and the water supply to the machine. If the values 0 and 1 then the machine will not start the process as one of the thew switches is OFF.
- When both power and water are at 1 then the socking process starts and runs for 200 sec after this washing started.
- After 200sec the rinsing process starts and after this process, the drying process is started for which the water supply is cut off.
- After completing all the tasks, the machine turns off.
- For all the different processes or states of the machine. The lamp indicates green for working and red for not working. this gives a better idea to the user, now which process is going on in the machine.
STUDY 2: Draw a Simulink chart for the "Gear Shift" logic as per the given conditions
AIM: To make a Simulink chart for the "Gear shift" logic as per the below conditions:
Speed Range(km) Gear
0 to 15 1
16 to 25 2
26 to 40 3
41 to 60 4
Above 61 5
BLOCK USED:
- Slider Switch: To turn the machine ON and OFF.
- Constant: constant values are added here
- Display: A display block is used to display the final output of the function.
- Stateflow: A state flow chart can be used as the action language to implement control logic.
- Lamp: The lamp block displays a color indicating the values of the input signals.
- Slider Block: The slider block tunes the value of the connected block parameter during simulation.
- Custom guage: The custom gauge block displays the value of the connected signals on a gauge face that you can customize to look like a guage in a real system.
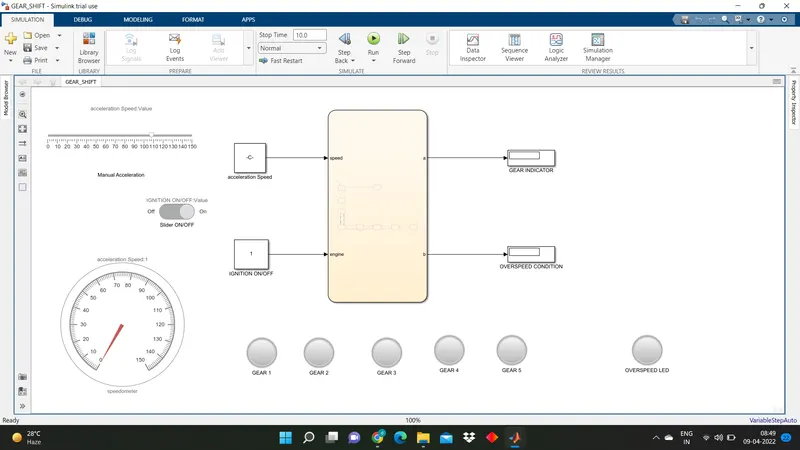
SIMULINK MODEL:
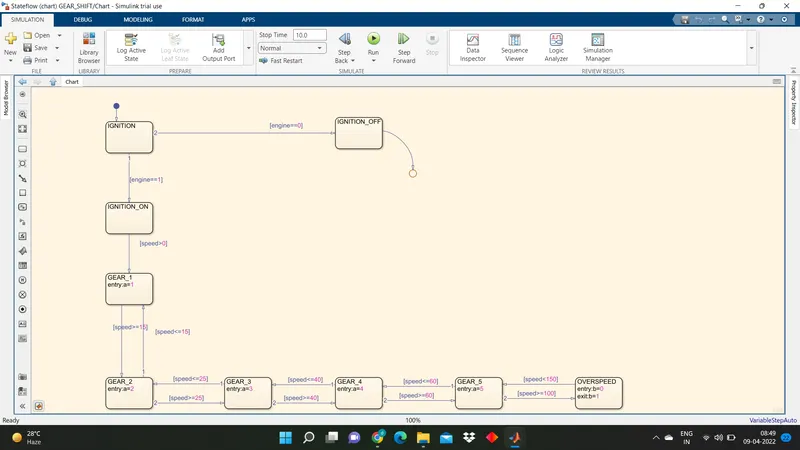
STATEFLOW CHART:
WORKING DEMONSTRATION:
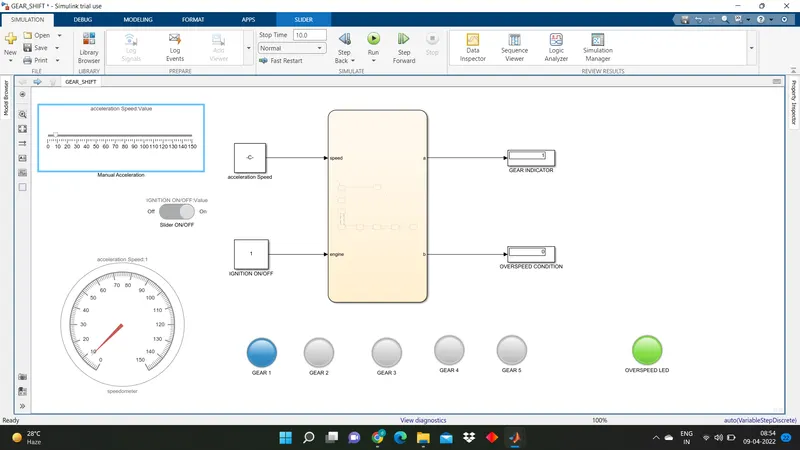
When the speed is below 16 km/hr:-
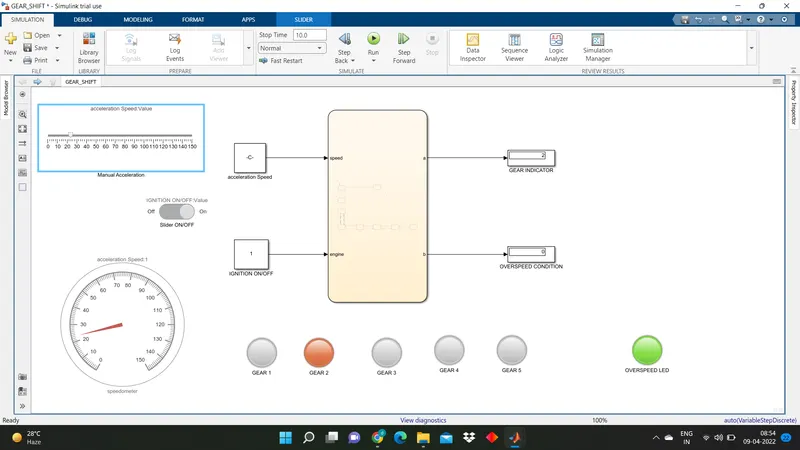
When the speed is below 25 km/hr:-
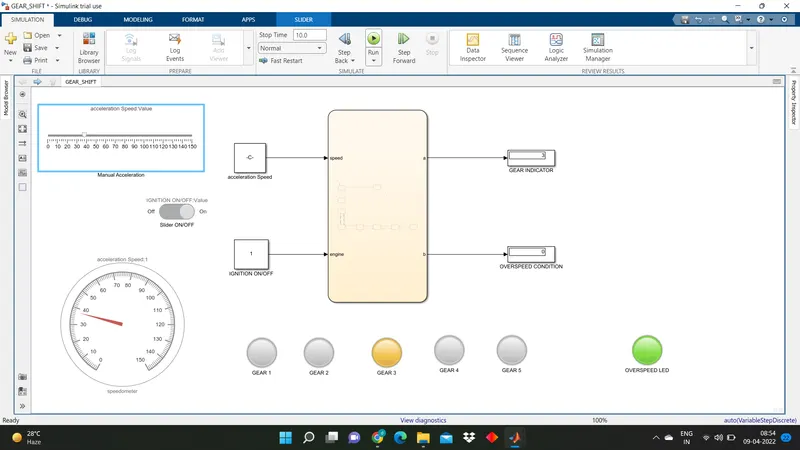
When the speed is below 40 km/hr:-
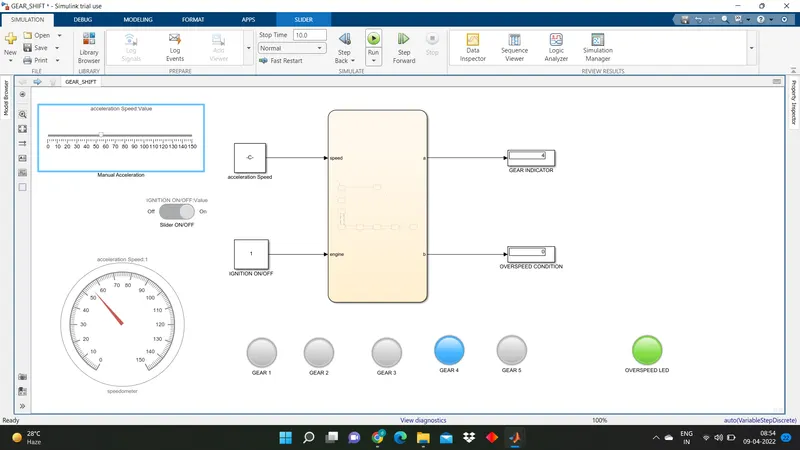
When the speed is below 60 km/hr:-
When the speed is above 60 km/hr:-
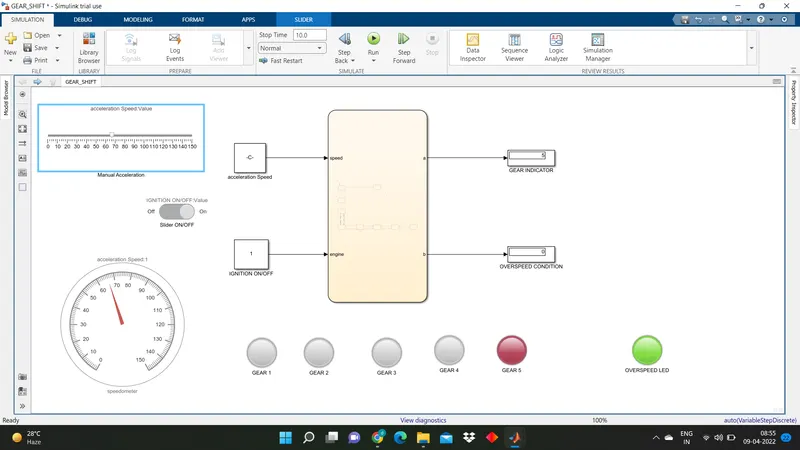
when the speed is above 100 km/hr:-
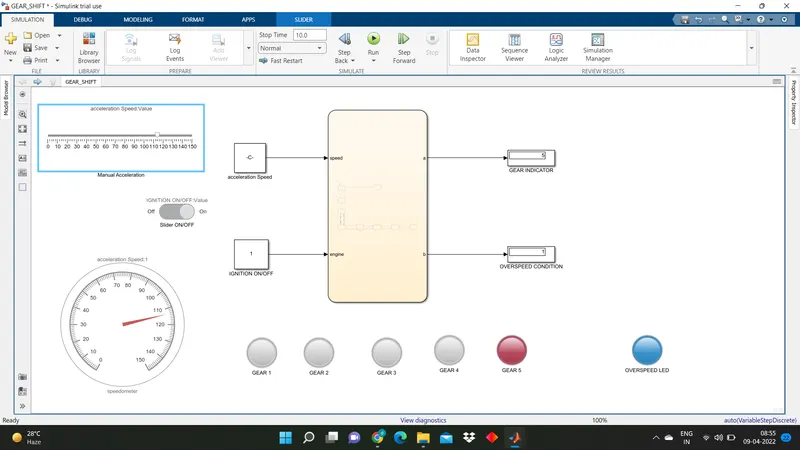
EXPLANATION:
- Assigning the parameters for the slider block connected to a constant named "Accelerator speed".
- The Stateflow chart is having two inputs which are speed and engine. The speed input is connected with a constant named "Accelerator speed" and engine input is connected with a constant named "Ignition ON/OFF constant. which is connected to the slider switch.
- In-state flow chart, checking Ignition condition, we take "Engine" as input giving the condition as "engine==0" this will execute when the constant value is 0 that is when the vehicle is turned off and another condition as "engine==1" this will execute when the constant value is 1 that is when the vehicle is turned ON.
- After the Ignition condition is turned ON the state flows to the next processes. Speed conditions are defined for each block. When it exceeds the speed condition the process flows to the next block. All the conditions have been assigned to each block.
- The Stateflow chart has two outputs named "a" and"b", these outputs are connected to the display blocks. The display block connected with the output"a" is named " GEAR INDICATOR" and the display block connected with the output "b" is named "OVERSPEED CONDITION".
- The "OVERSPEED CONDITION" block displays the condition when the vehicle is attaining an Overspeed situation.
CONCLUSION:
Simulation of gear shift corresponding to the given speed range has been simulated successfully.