Week - 4
AIM:
To implement control logic of washing machine using stateflow in simulink.
Objective:
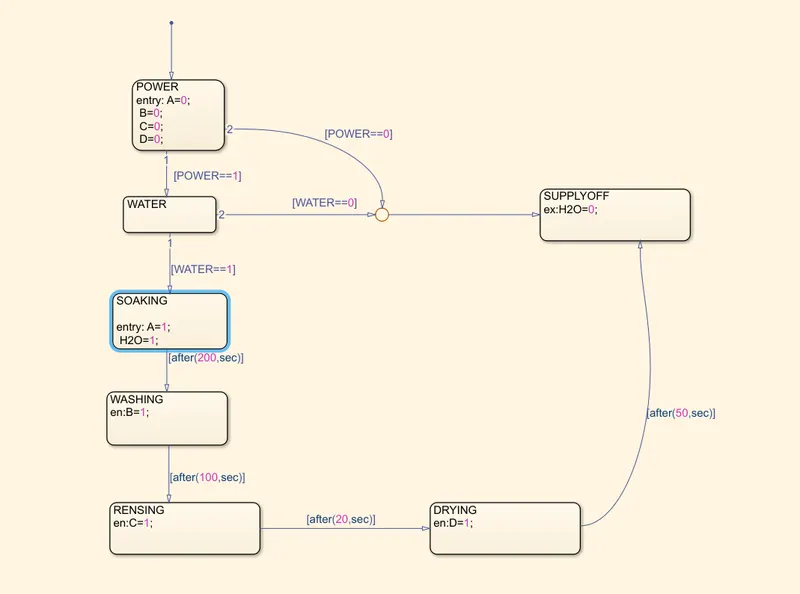
1. To implement the control logic of washing machine using stateflow as per given sequence:
a) If power supply is available,the system gets activated.
b) If the water supply is not available,stop the process & indicate through LED.
c) Soaking time should be 200s followed by washing time 100s.
d) Then rensing happens for next 20s & dryer runs for 50 sec.
After all the processes have completed turn on the finished LED.
Model:
The file which contains the model is attached with this report.
Control Logic Of Washing Machine Using Stateflow:
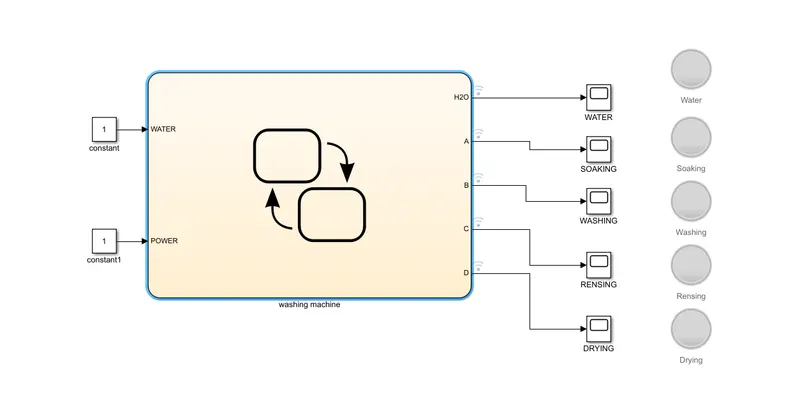
Chart Diagram:
Parameters:
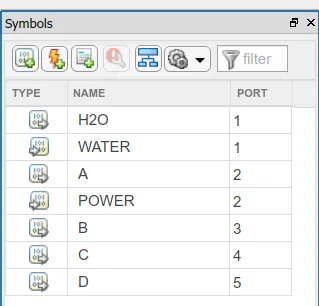
We have given water,soak,washing,rensing,dryer,cycle as outputs of the charts.
We have given our water supply and power supply as inputs of the charts.
Simulation Time Parameters:
We used 500 sec so that it can cover the whole cycle and sufficient time to store and solve the parameteres.

Output:
There are two conditions asked to solve in the question.
Condition-(1): When water supply is OFF.
We should not provide water supply and check for output.
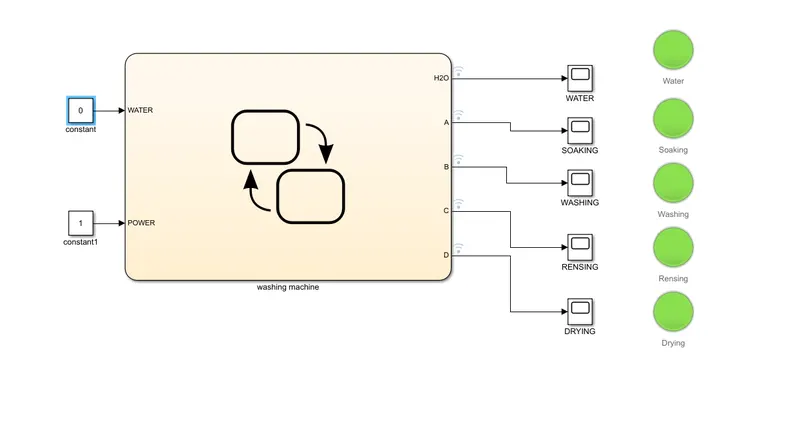
From the above diagram,we can see that indicator of water is showing Green i.e., when there is no water supply the process is terminated and LED indicator is used to indicate the state.
Condition-(2): When water supply is ON.
Now we are providing the water supply and check the output.
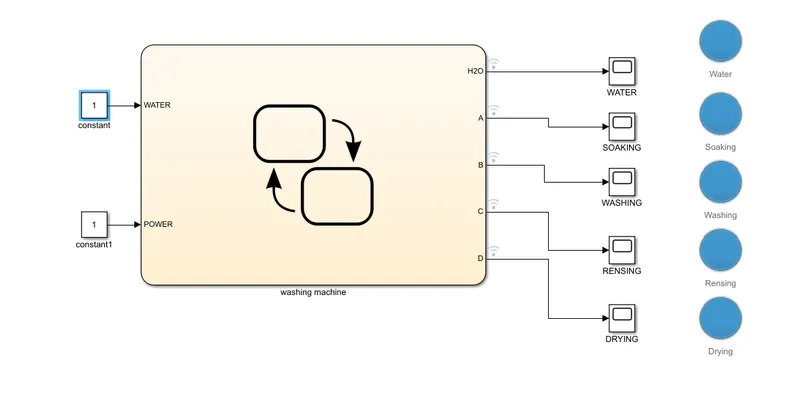
As we can observe from the above figure, all the states have been executed and indicating the process completion indicator showing Blue.
Conclusion:
The simulation of the Washing Machine using State Flow is done and the result is satisfactory.
Aim:
To make a Simulink chart for the “Gear shift” logic.
Objective:
Making a simulink chart for the Gear shift for the below mentioned parameters:
Speed Range(kmph) Gear
0 to 15 1
16 to 25 2
26 to 40 3
41 to 60 4
Above 61 5
Model:
The file which contains the model of gear shift is attached with this reprt.
Control Logic of Gear Shift:
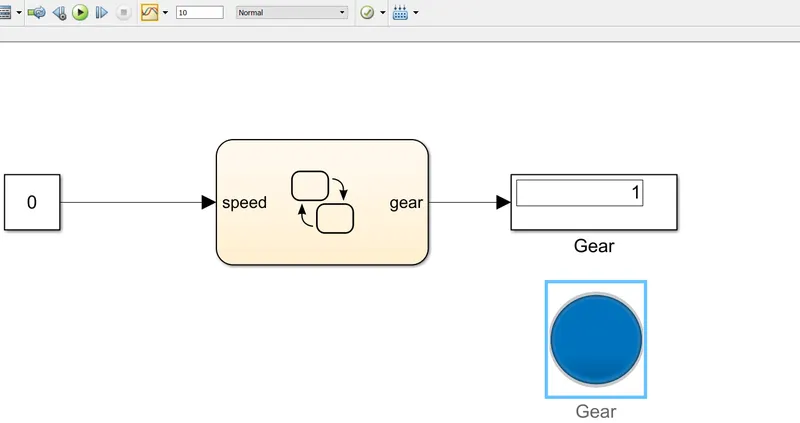
Chart Diagram:
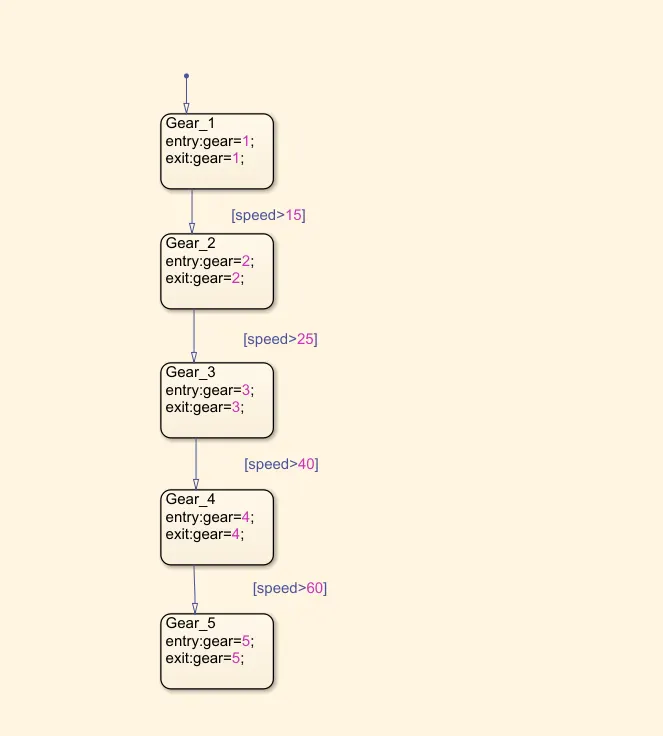
Parameteres:
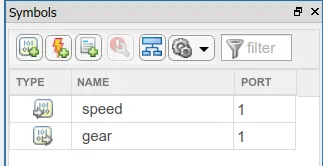
Here we give speed as an input for the chart.
Here we give gear as an output for the chart.
Simulation Time Parameteres:
Here we gave time as 'inf' for our simulation should run until we stop it.

Input:
We use constant to provide input to the chart.
Output:
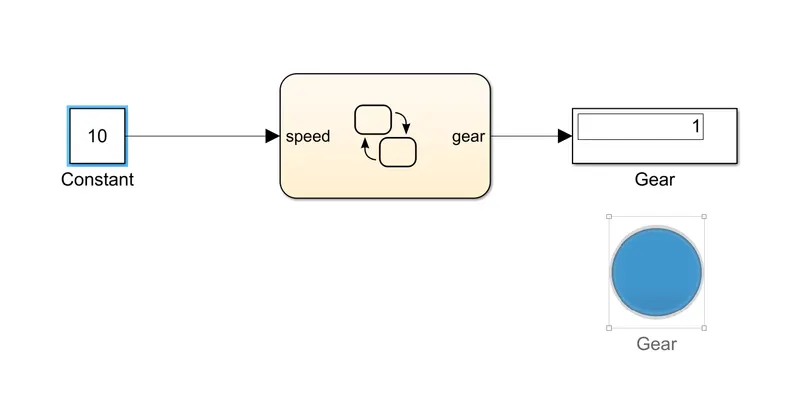
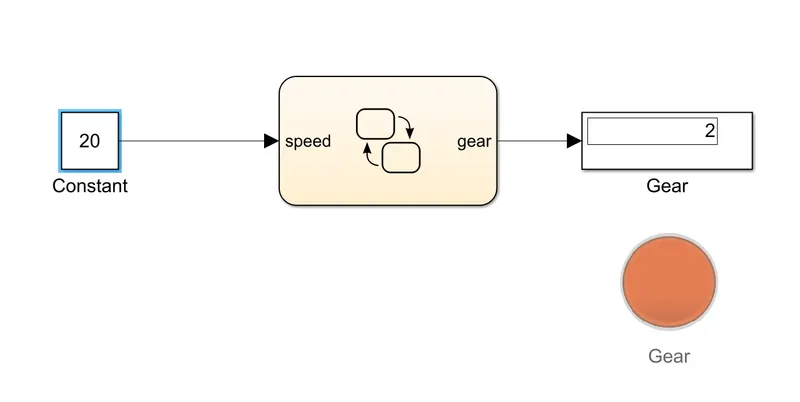
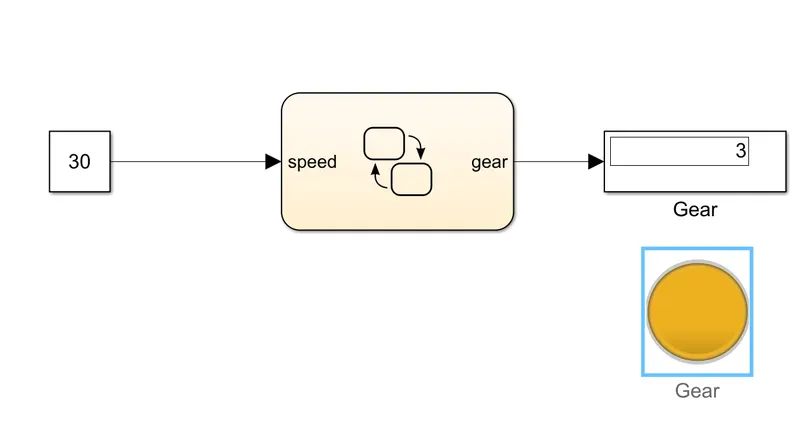
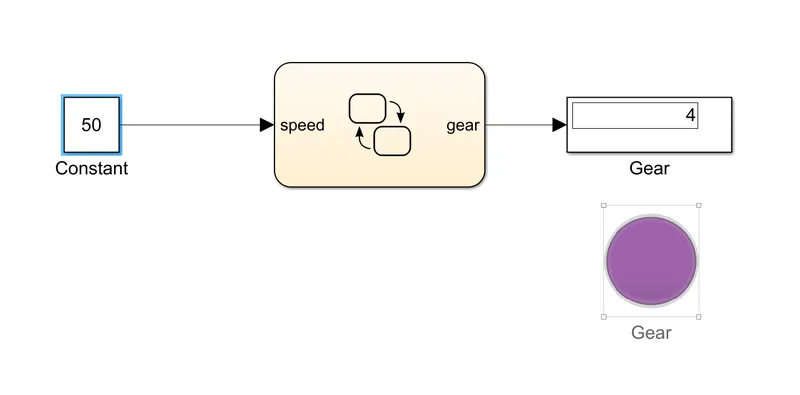
The output produced is recorded when its displaying the each gear.
Gear-1:
speed range:0-15kmph.
input speed:10kmph.
color:Blue.
Gear-2:
speed range:16-25kmph.
input speed:20kmph.
color:Brown.
Gear-3:
speed range:26-40kmph.
input speed:30kmph.
color:Dark Yellow.
Gear-4:
speed range:41-60kmph.
input speed:50kmph.
color:Purple.
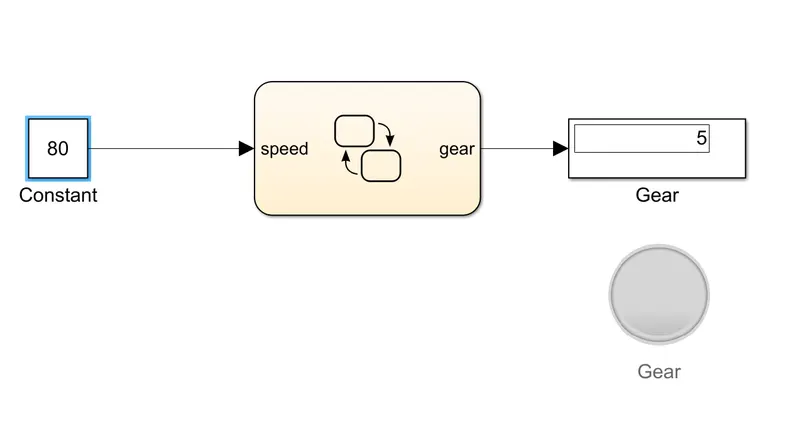
Gear-5:
speed range:above60kmph.
input speed:80kmph.
color:Gray.
Conclusion:
Created a state flow for Gear Shift using Simulink and the results are satisfactory.