Week - 4
Aim - To implement the control logic for washing machine and gear shifter of automobile using stateflow in Maltlab & Simulink.
Part I: Implementation of Control Logic Chart for Washing Machine using Stateflow
Process:
1)Start Simulink and create a blank model.
2)Search for Chart block in the Stateflow category of library browser.
3)Open the chart block and select the Junction feature from the Stateflow window.
4) Control logic for Washing m/c is such that it should soak the water for the first 200sec followed by washing time of 100sec. Rinsing the water for the next 20sec followed by drying time of 50sec.
5)After finishing the control logic run the Stateflow and check the sequence of operation for 370sec.
Control Logic Structure:
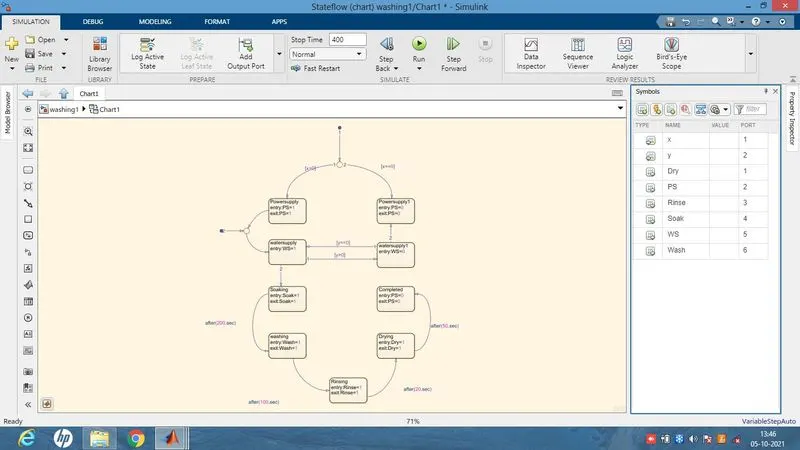
1) In the above control logic first junction is created with 2 conditions for Power Supply. One is with power supply available (x>0) and second without power supply (x==0). If the power supply at entry is 1 or On the machine will get activated and start the next process of operation.
2) Next 2 Power Supply State is created with 2 states one for if power on (PS=1) & another for power-off (PS=0).
3) After the power supply state next was to select the state for Water Supply. 2 Water Supply State is created with 2 states one for if Water Supply On (WS=1) applicable when (y>0) & another for Water Supply Off (WS=0) when (y==0).
4) Next 4 Operation states have been created in flow order Soaking, Washing, Rinsing, Drying with their time of operation as 200 sec for a soak, 100 sec for wash, 20 sec for rinse & 50 sec for dry. Entry and exit conditions of the state are kept as 1 because of the continuous operations of the process of the Washing Machine.
5) After finishing all the sets of operation the power supply is changed to the state PS=0 which leads to shut off the machine.
Here,
x & y is input port
Dry, PS, Rinse, Soak, WS & Wash are output port with an initial value of 0.
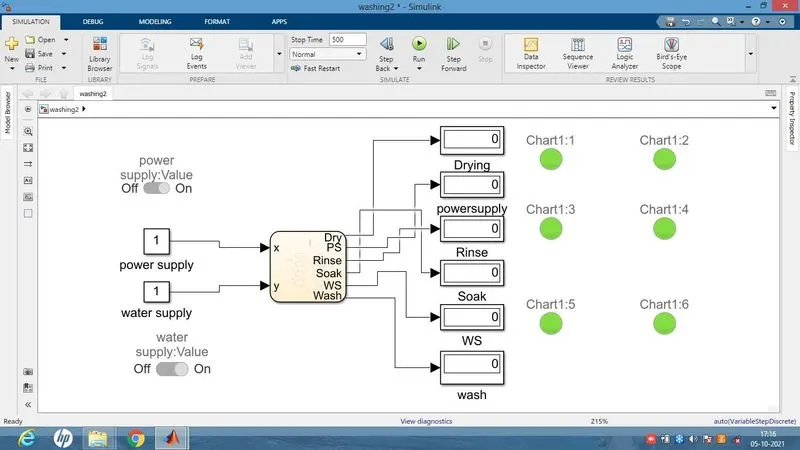
After event creation flow chart is generated using some blocks from the library and their connections are done as mentioned below,
- A Slider Switch is used from the Simulink Dashboard category to switch on & off the power and water supply and connected with their input supply of x & y respectively.
- The Display block is connected with each output of the states of operation.
- The Lamp block is dragged from the Simulink Dashboard category to represent the LED for various operation performance evaluation.
- These Lamp blocks are connected to their respective output port in the chart.
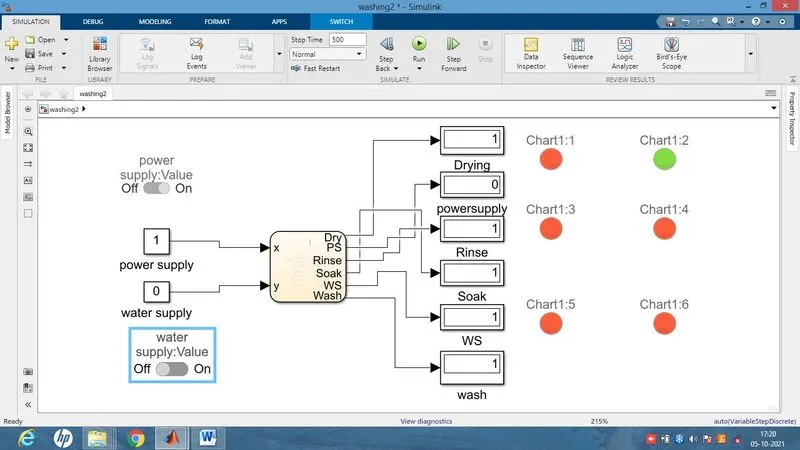
- When the operation/process is On it is represented by green colour indication in a lamp when the output is 1 and wise a versa for Off is indicated by red colour when output is 0.
Results:
1) When Power & Water Supply is On and run time is 370 sec.
2) When Power Supply is On & Water Supply is Off.
3) When Power Supply & Water Supply is On and run time is 200 sec (Soak State).
4) When Power Supply & Water Supply is On and run time is 300 sec (Wash State).
5) When Power Supply & Water Supply is On and run time is 320 sec (Rinse State).
6) When Power Supply & Water Supply is On and run time is 370 sec (Dryer State).
--------------------------------------------------------------------------------------------------------
Part II: Implementation of Control Logic for Gear Shift using Stateflow
Process:
1)Start Simulink and create a blank model.
2)Search for Chart block in the Stateflow category of library browser.
3)Open the chart block and select the various feature from the Stateflow window.
4) Control logic for Gear Shift is such that it should change the gear when the speed increases or decreases automatically.
5)After finishing the control logic run the Stateflow and check the gear shift operation for an infinite time.
Control Logic Structure:
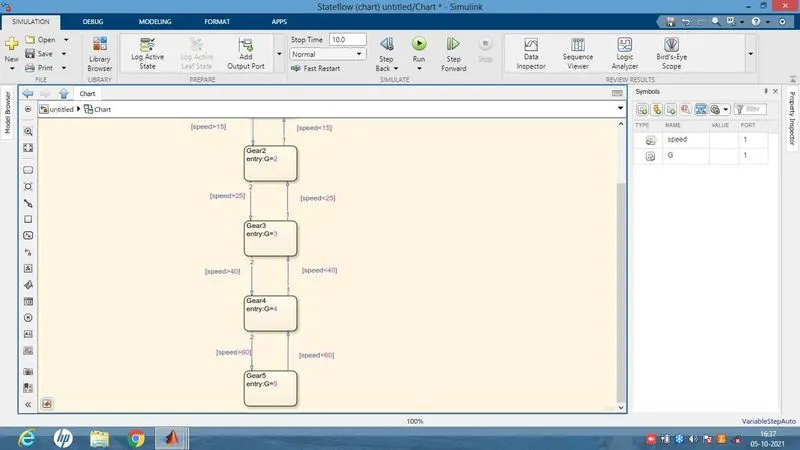
1) In the above control logic first, the default transition is dragged from the browser menu.
2) Five Gear state is created with state condition of Gear (G) 1,2,3,4 & 5 respectively and their transition is connected with speed range condition as shown in the image.
3) The transition conditions for gear shift is decided as
Speed>15 shift to G=2
Speed>25 shift to G=3
Speed>40 shift to G=4
Speed>60 shift to G=5 when the speed is increasing from 0-60 Kmph
similarly in reverse direction
Speed<60 shift to G=4
Speed<40 shift to G=3
Speed<25 shift to G=2
Speed<15 shift to G=1 when the speed is decreasing from 60-0 Kmph
Here Speed is an input condition and G is Output Condition
After event creation flow chart is generated using some blocks from the library and their connections are done as mentioned below,
- A Constant block is connected with Slider Gain block to provide initial input.
- Slider Gain block is used to define the Speed Slider to change the speed during simulation is running and it acts as input for speed.
- The output port (G) is connected with the Display to indicate the current gear for current speed in the slider gain.
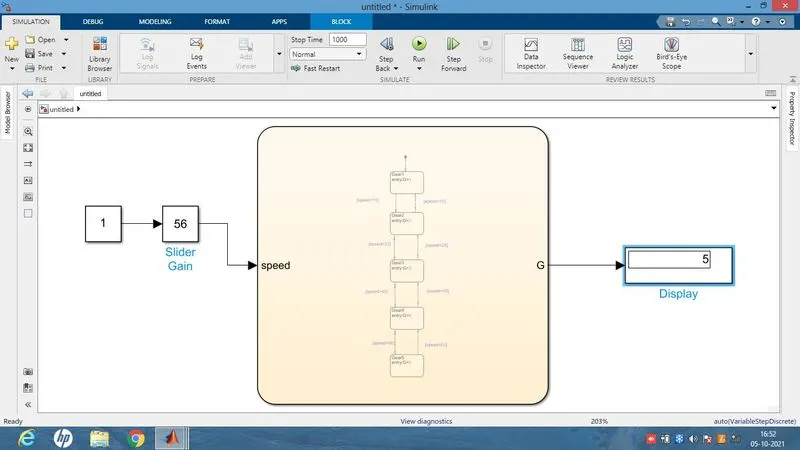
Results:
When the run time is kept as an infinite and slider is made to slide for the speed of we can see the gear no (G) as 5.