Week - 4
Aim: Implementation of control logic for washing machine using stateflow technique
Working:
Generally washing machine involves various process apart from supply and water on such process are mentioned below:
1.Soaking
2.Washing
3.Rinsing
4.Drying
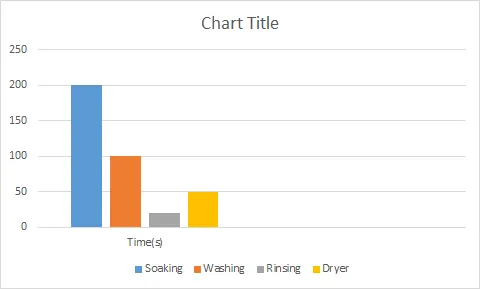
Here the above all process are taken for particular time period which are represented in below chart
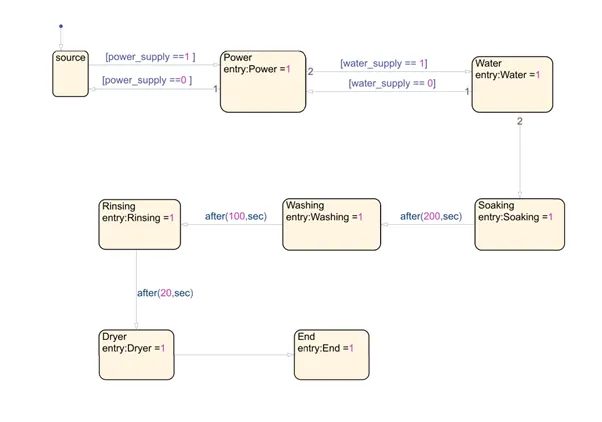
the control logic for washing machine are represented below:
based on control logic various process are made ON/OFF which are indicated using LED:
1. Initial condition of washing machine working process
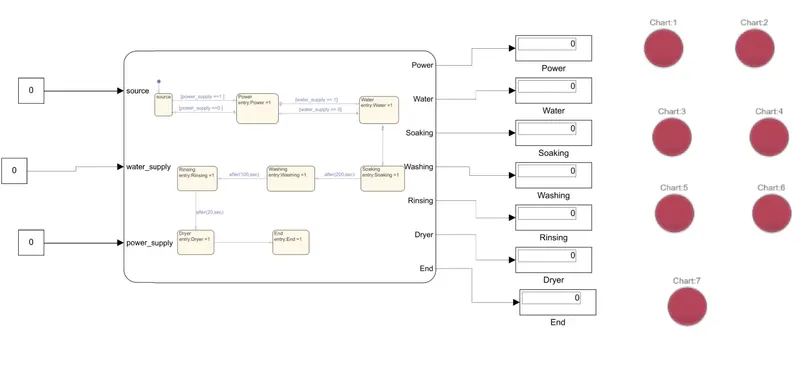
Here the source itself off then the entire machine would be in off state
2. Source made ON
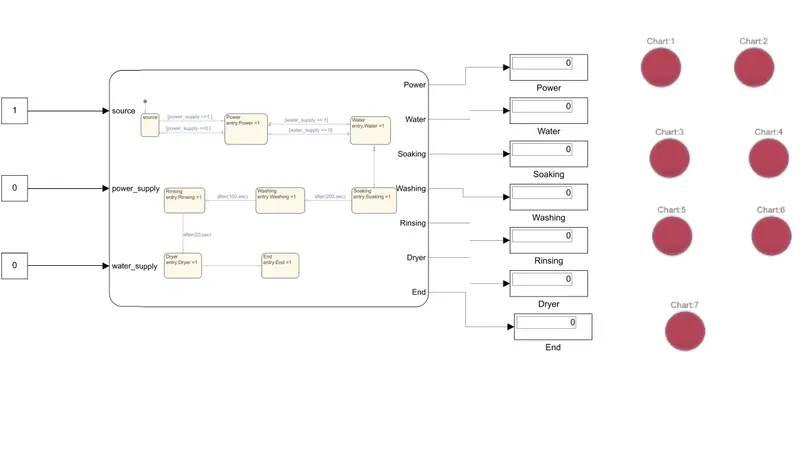
after made source ON the same result like previous one
3.Source and Power supply made ON:
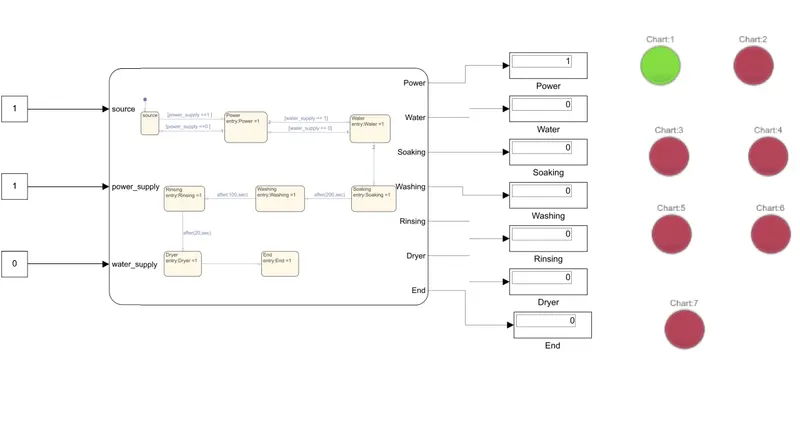
from above picture it is clear that while source and supply ON only one LED will glow that indicates power supply ON
4.Source,Power supply and Water supply all are made ON:
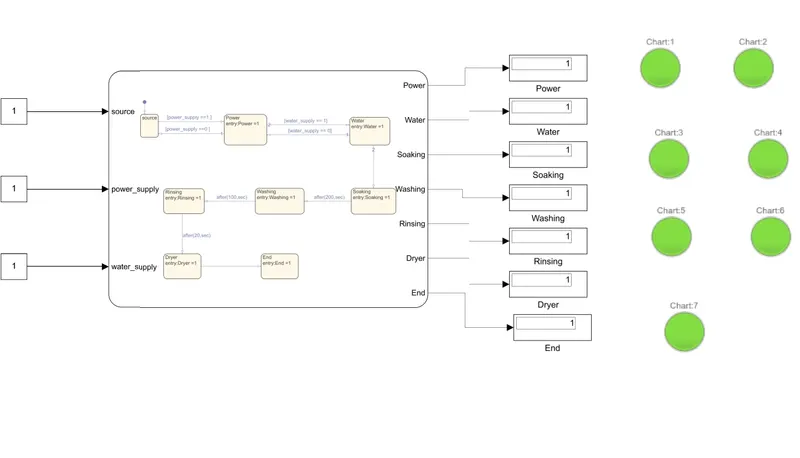
Here all LEDs glow indicates complete ON washing machine
note: inputs are represented using constant ,ouputs are represented using display and LED
2. Aim: Making simulink chart for gear mechanism and displaying position of gear based on speed varying
Working: Here working of gear mechanism are represnted based on below input
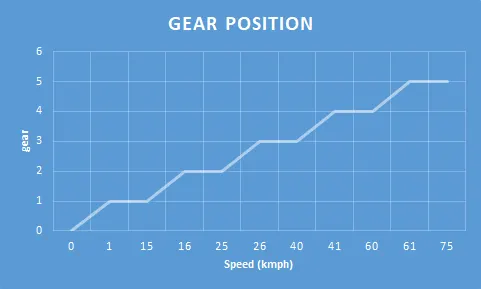
Control logic of gear mechanism:

the above chart will represent gear position based on speed changes
Initial condition of Working gear mechanism:
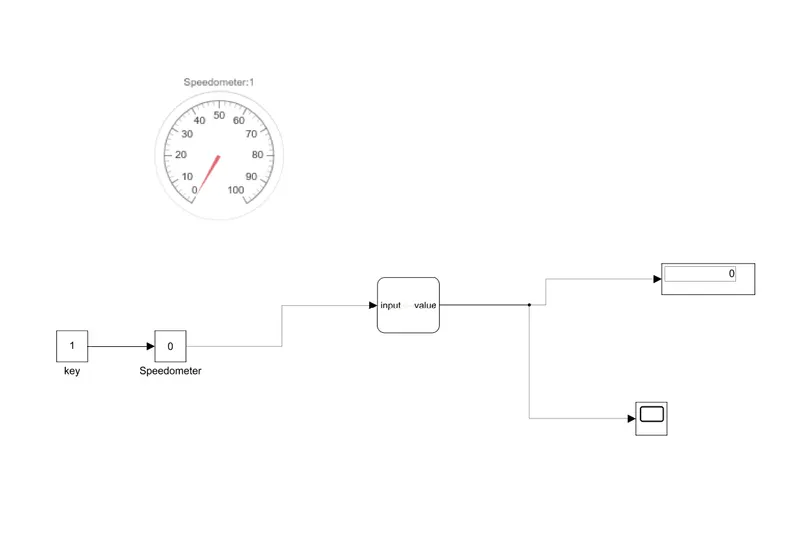
here we use constant to represent bike in ON/OFF condition
Speedometer is represented with the help of slider gain and gauge to represent the speed changes
gear change in position will be displayed using display block from value
Scope is used to record all the process and plot graph between speed and gear position
Gear1:
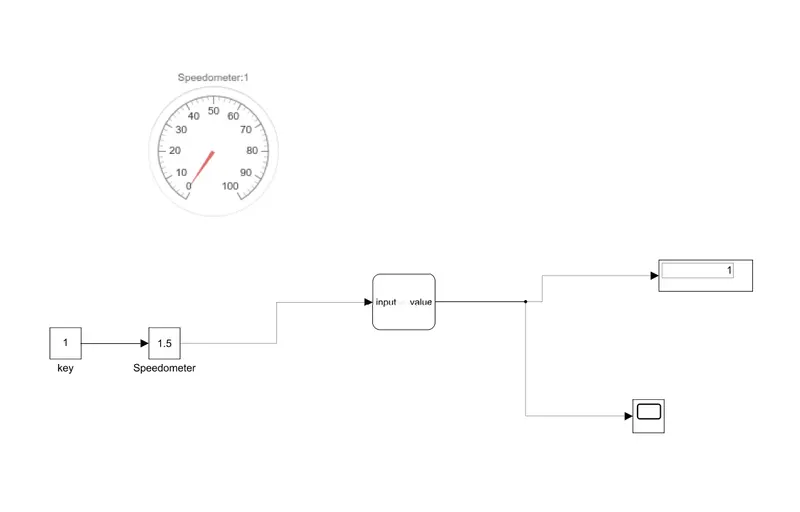
based on control logic whenever speed range cross above 1 then the gear position would be 1
Gear2:
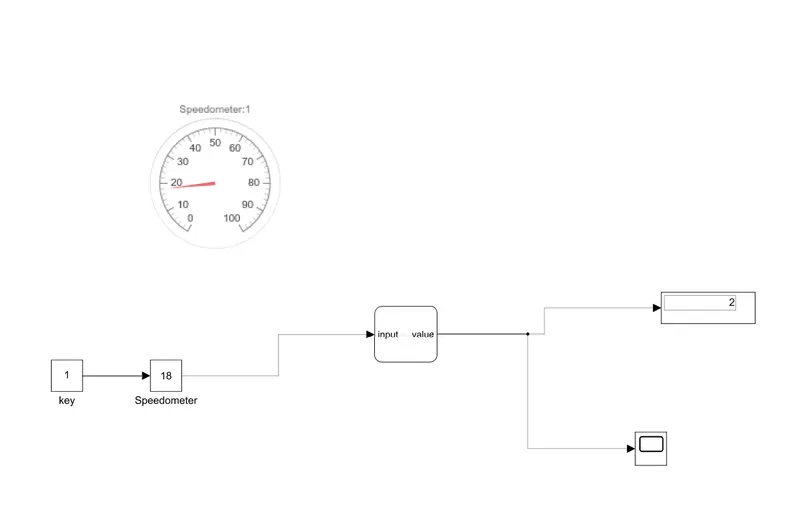
whenever speed range crosses above 15 then the position of gear would become 2
Gear3:
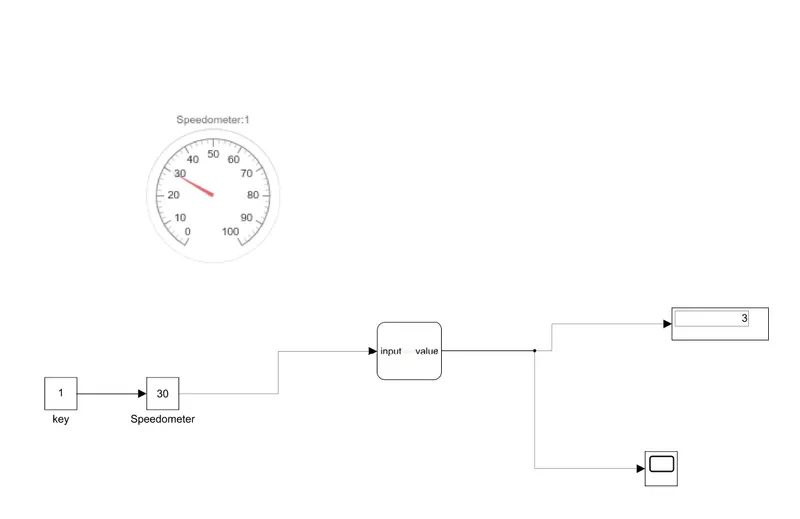
Whenever speed crosses above 25 the gear position would be 3
Gear4:
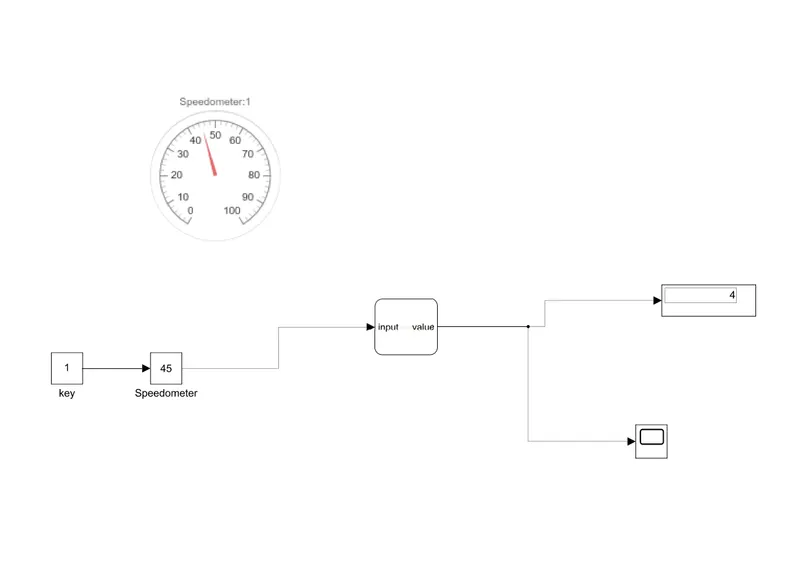
whenever speed crosses above 40 then gear position would be 4
Gear5:
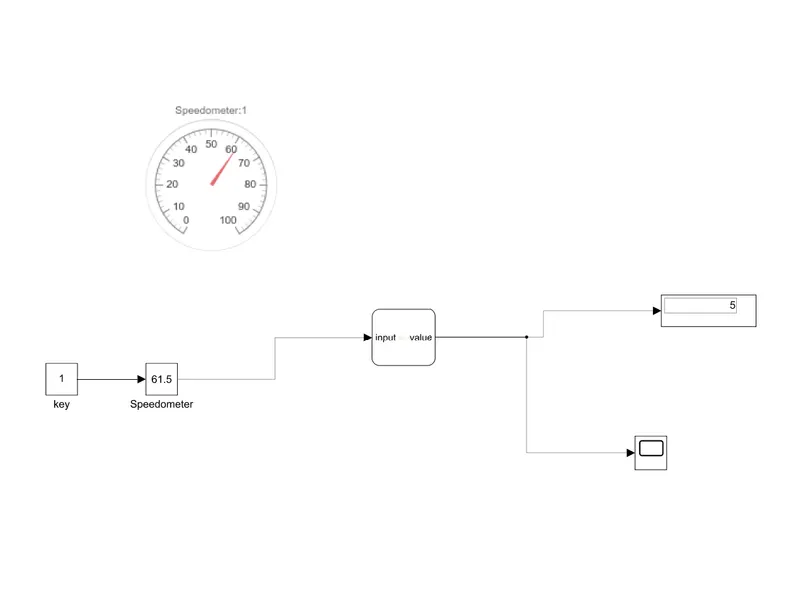
whenever speed range crosses above 60 the gear position would be 5
now all the process has been plotted using scope based on speed vary
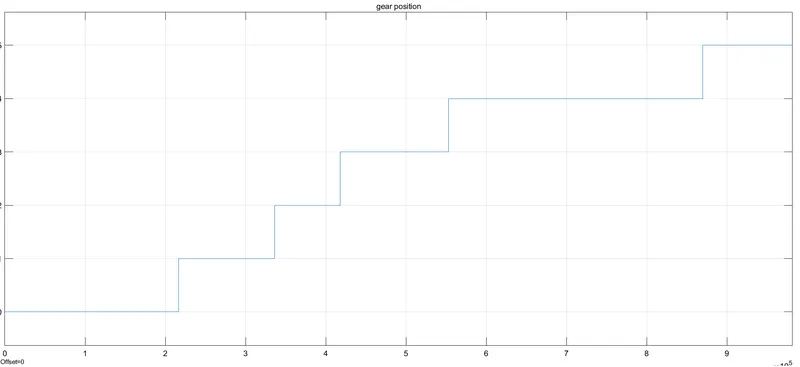
this plot represent gear position based on speed varying in terms of time