Week - 4
AIM
- To implement control logic of a “washing machine” using ‘Stateflow’ as per given sequence
- If the power supply is available, the system gets activated
- If the Water supply is not available, stop the process & indicate through LED
- Soaking time should be 200s followed by washing time of 100s.
- Then rinsing happens for next 20s & dryer runs for 50s
After all the processes have completed turn on the finished LED
- To make a Simulink chart for the “Gear shift” logic as per below conditions.
Speed Range(kmph) Gear
0 to 15 1
16 to 25 2
26 to 40 3
60 to 40 4
Above 61 5
Give speed input while the simulation is running & display the gear number.
PROCEDURE
- To implement control logic of a “washing machine” using ‘Stateflow’ as per given sequence
- Open MATLAB > SIMULINK > Create New Model – Then on the workspace double click and type as ‘CHART’ to start with the given Stateflow. (In SIMULINK - Stateflow can be achieved using CHART Block.)
Stateflow® provides a graphical language that includes state transition diagrams, flow charts, state transition tables, and truth tables. You can use Stateflow to describe how MATLAB® algorithms and Simulink® models react to input signals, events, and time-based conditions.
Stateflow enables you to design and develop supervisory control, task scheduling, fault management, communication protocols, user interfaces, and hybrid systems.
With Stateflow, you model combinatorial and sequential decision logic that can be simulated as a block within a Simulink model or executed as an object in MATLAB. Graphical animation enables you to analyze and debug your logic while it is executing. Edit-time and run-time checks ensure design consistency and completeness before implementation. (Source Mathworks)
- Here in the given data, we have an INPUT, a CONDITION and OUTPUT.
- Now let us create a flowchart.
- To do so, Double click on the CHART Block. It will take us to a workspace where SIMULINK allows us to create the Stateflow diagram/Flow chart.
- Let us start with a default transition. The reason we use a default transition in here is to connect the source and the destination object. A default transition has a destination but no source object.
- According to our WASHING MACHINE data we have six different states which is POWER, WATER, SOAKING, WASHING, RINSING, DRYING.
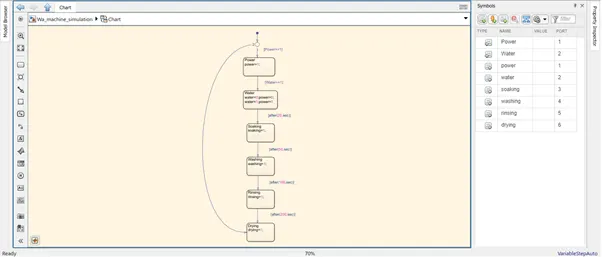
- Here POWER and WATER are our Source object. To operate a washing machine we require Power supply, so this is our first state. Drag and add a state block from the Toolbar. Name the State as Power and State action is set to Power=1; which refers to power flow. Also connect the default transition with the Power State and set the condition as [Power==1].
- Similarly to the next state. Our second State is WATER. State action is set as water=0;power=0; and water=1;power=1. Which means, When water supply is not available the power supply is cut down and the process stops and When water supply is available the power supply is available hence the process continues. Connect the State one and two with a transition and set the conditions as [Water==1].
- After Water is supplied, the next State is SOAKING and the state condition is 1. The transition connection between Water and Soaking is set with a condition [after (20, sec)] i.e. the soaking starts after 20sec after the water supply.
- Similarly with same state condition as 1. WASHING happens after 50sec, RINSING after 100sec and DRYING after 200sec. DRYING is our destination.
- Then from the default transition, we connect the Source and the Destination with a transition.
- Our Control Logic/Stateflow is ready. In order to set the Input and Output to the CHART, we have to access the SYMBOLS PANE from the PREPARE tool bar.
- Now we have the SYMBOLS PANE open on the right side of the Workspace which has the Data type, Name, Value and Port. Here we have the power and water source condition along with the State condition of POWER, WATER, SOAKING, WASHING, RINSING, DRYING.
- Two sources Power and Water are set as Input data in DATA TYPE and other State conditions are set as Output. Output is set according to the Port order.
- Now, when we get back to the CHART we can notice that the Input and Output Ports are displayed for Input and Output block connections.
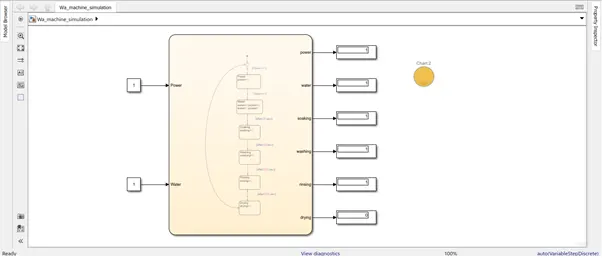
- Then we set two Constant Blocks. One for the POWER and other for WATER with a constant value 1.
- The Output ports are connected with Display Blocks. And we have on LAMP Block to indicate that the Water supply is not available and the process is stopped.
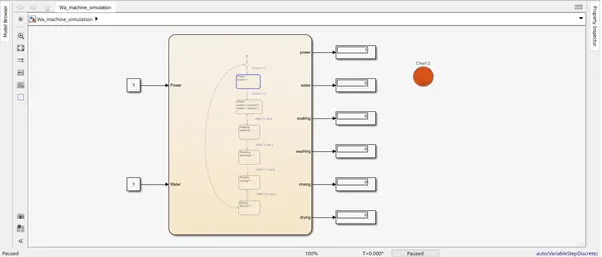
- To connect the LAMP to output port (Water) Click on connect on the LAMP and select the Display block connected to WATER. Also set the State and Color of the LAMP. State 0 – Color RED and State 1 – Color LIGHT GREEN. 0 RED No water supply. 1 LIGHT GREEN There is water supply. Apply and hit Ok.
- Since our condition i.e. the process runs upto 200sec, we set the Stop time as 200 sec.
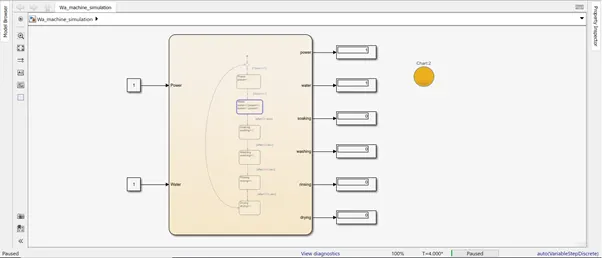
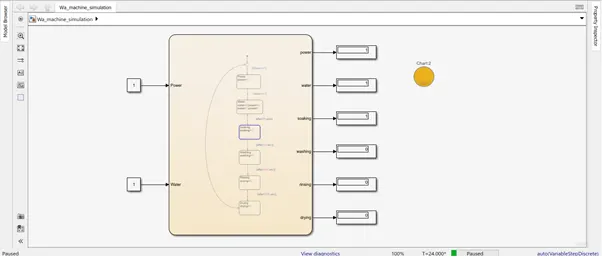
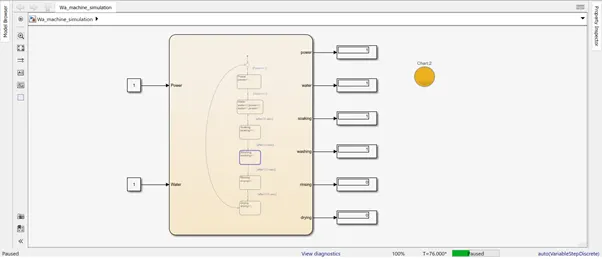
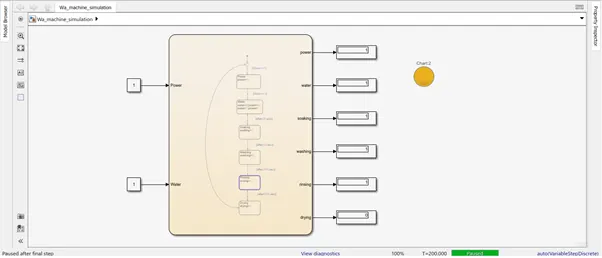
- Now RUN the program. Then by using Step forward evaluate the process with respect to time as shown below.
STATEFLOW OF WASHING MACHINE
STEP FORWARD ACTION OF WASHING PROCESS
2.To make a Simulink chart for the “Gear shift” logic as per below conditions.
Speed Range(kmph) Gear
0 to 15 1
16 to 25 2
26 to 40 3
60 to 40 4
Above 61 5
Give speed input while the simulation is running & display the gear number.
- Open MATLAB > SIMULINK > Create New Model – Then on the workspace double click and type as ‘CHART’ to start with the given Stateflow.
- Here in the given data, we have an INPUT, a CONDITION and OUTPUT.
- Now let us create a flowchart.
- To do so, Double click on the CHART Block. It will take us to a workspace where SIMULINK allows us to create the Stateflow diagram/Flow chart.
- According to our GEAR SHIFT data, we have to input the Speed and check the Gear shift from 1 to 5 based on the condition i.e. Speed Range.
- Let us create the Stateflow diagram for the given data.
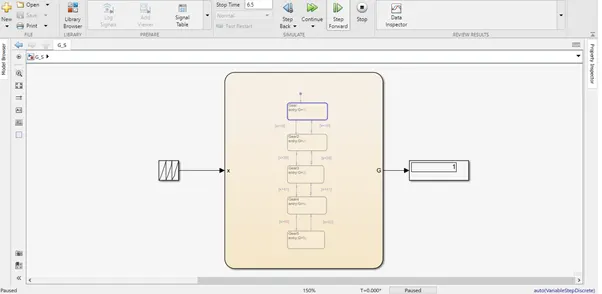
- Now we create a State for the First Gear. Drag and drop the State from Tool bar. Here we have a default Transition connected along with the State. Give the State name as Gear and State action as entry:G=1;
- Similarly create State block upto Fifth Gear.
- So Now we have created the State blocks from First Gear to Fifth Gear. Next thing to do is the Transition connection with condition between the Gears in order to perform UP SHIFT and DOWN SHIFT.
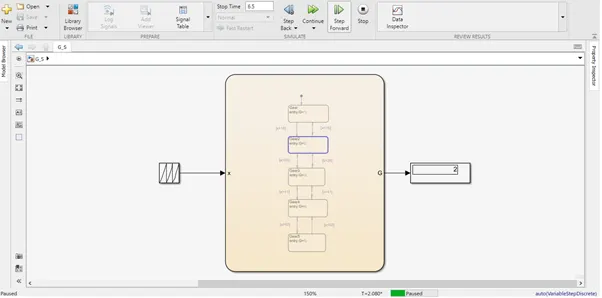
- The Transition condition between the First and Second Gear is [x>16] i.e. During Throttle the engine reaches the speed range of above 16, then the UP SHIFT happens and the Gear changes to Second. The second transition condition is [x<16] i.e. when there is no throttle and the engine speed is less than 16, then DOWN SHIFT happens.
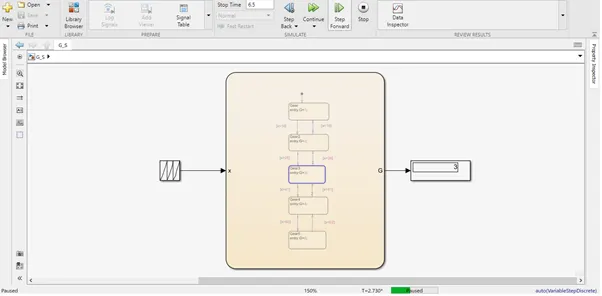
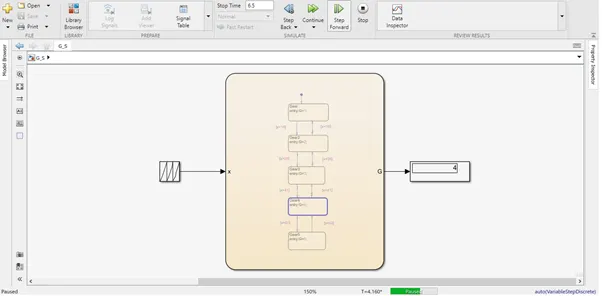
- Similarly the Transition condition between Second and Third Gear is [x>26] UP SHIFT and [x<26] DOWN SHIFT. Third and Fourth Gear [x>41] UP SHIFT and [x<41] DOWN SHIFT. Fourth and Fifth Gear [x>60] UP SHIFT and [x<62] DOWN SHIFT.
- Our Control Logic/Stateflow is ready. In order to set the Input and Output to the CHART, we have to access the SYMBOLS PANE from the PREPARE tool bar.
- Now we have the SYMBOLS PANE open on the right side of the Workspace which has the Data type, Name, Value and Port. Here we can see that there are two Data Type x and G. We set x as INPUT Data Type and G as OUTPUT Data Type.
- Now, when we get back to the CHART we can notice that the Input and Output Ports are displayed for Input and Output block connections.
- Here we use the Repeating Sequence Block to set the INPUT data and connect a Display to the OUTPUT port to check the Gear Shift.
- The Input parameters of the repeating sequence block consist of Time Values and Output Values, where in Time Values we set a random time [0 2 3 5 6] and in the Output Values we set the speed as [0 16 30 50 65] for the Gear shift to happen. The Gear changes according to the respective values of time and speed range as per the input parameter set.
- Finally we set the Stop time to 6.5sec and RUN the program.
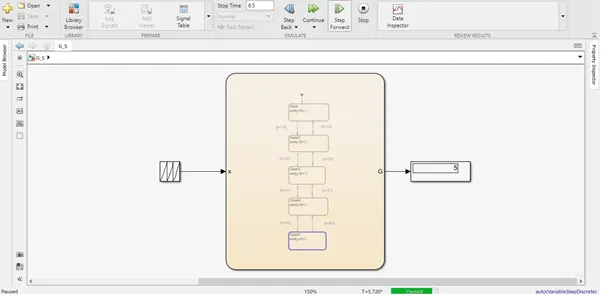
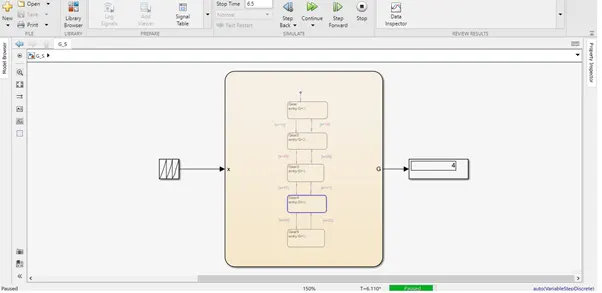
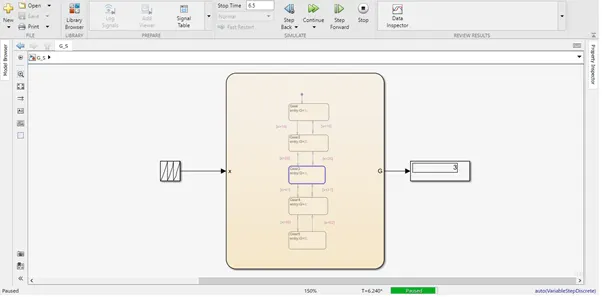
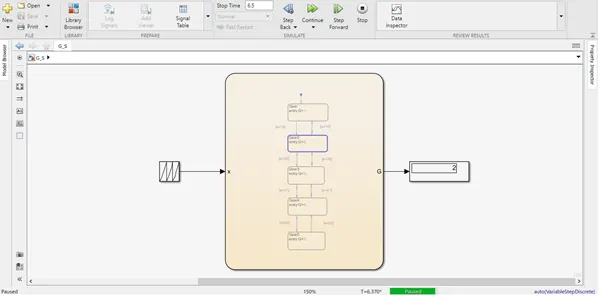
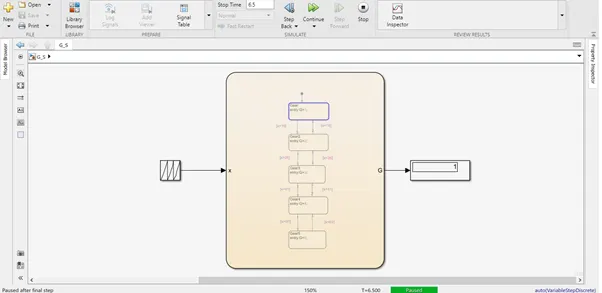
- Then Step forward to see the Gear Shifts according to our input parameter which is shown in the below Fig.
STATEFLOW OF GEAR SHIFT
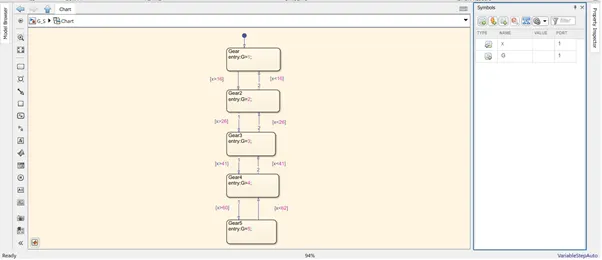
STEP FORWARD ACTION OF GEAR SHIFT PROCESS