Week 4.1 - Genetic Algorithm
AIM :
- Write a code in MATLAB to optimise the stalagmite function and find the global maxima of the function.
- Clearly expalin the concept of genetic algorithm in your own words and also explain the syntax for ga in MATLAB in your report.
- Make sure that your code gives the same output, even if it is made to run several times.
- Plot graphs for all 3 studies and for F maximum vs no. of iterations. Title and axes labels are a must, legends could be shown if necessary.
THE SYNTAX FOR GA IN MATLAB :
x=ga(fun,nvars,A,B,Aeq,Beq,lb,ub,nonicon,intcon,option)
function program :
function [f] = stalagmite(input_vector)
a = input_vector(1);
b = input_vector(2);

f1_x = (sin((5.1*pi*a)+0.5)).^6;
f1_y = (sin((5.1*pi*b)+0.5)).^6;
f2_x = exp(-4*log(2)*(((a-0.0667)^2)/(0.64)));
f2_y = exp(-4*log(2)*(((b-0.0667)^2)/(0.64)));
f=(f1_x*f1_y*f2_x*f2_y);
end
main program :
clear all
close all
clc

%defining our search space
x = linspace(0,0.6,150);
y = linspace(0,0.6,150);
iterations = 50

%creating a 2Dimensional mech
[xx, yy] = meshgrid(x,y);

%Evaluating the stalagmite function
for i = 1:length(xx)
    for j = 1:length(yy)
        input_vector(1)=xx(i,j);
        input_vector(2)=yy(i,j);
       f(i,j) = stalagmite(input_vector);
    end
end

surfc(xx,yy,f)
shading interp
[inputs,fval]=ga(@stalagmite,2)
xlabel('Xaxis')
ylabel('Yaxis')


%study-1 statistical behavior
num_cases = 50
tic%1st iteration - studying the statistical behaviour

tic
for i =1:num_cases
    [inputs ,fopt1(i)] = ga(@stalagmite,2);
    x_opt1(i)=inputs(1);
    y_opt1(i)=inputs(2);
end
study1_time =toc;
mean1=-(mean(fopt1))
%plotting
figure(1)
subplot(2,1,1)
hold on
surfc(x,y,-f)
shading interp
plot3(x_opt1,y_opt1,-fopt1,'marker','o','MarkerSize',5,'MarkerFaceColor','r');
title ('unbounded inputs')
xlabel('X-Axis')
ylabel('Y-Axis')
subplot(2,1,2)
plot(fopt1)
xlabel('iterations')
ylabel('Function maximum')

%study -2 statistical behavior
tic
for i =1:num_cases
    [inputs2 ,fopt2(i)] = ga(@stalagmite,2,[],[],[],[],[0,0],[1,1]);
    x_opt2(i)=inputs2(1);
    y_opt2(i)=inputs2(2);
end
study2_time =toc;
mean2=-(mean(fopt2))
%plotting
figure(2)
subplot(2,1,1)
hold on
surfc(x,y,-f)
shading interp
plot3(x_opt2,y_opt2,-fopt2,'marker','o','MarkerSize',5,'MarkerFaceColor','r');
title ('bounded inputs')
xlabel('X-Axis')
ylabel('Y-Axis')
subplot(2,1,2)
plot(fopt2)
xlabel('iterations')
ylabel('Function maximum')

%study -2 statistical behavior
tic
for i =1:num_cases
    [inputs2 ,fopt2(i)] = ga(@stalagmite,2,[],[],[],[],[0,0],[1,1]);
    x_opt2(i)=inputs2(1);
    y_opt2(i)=inputs2(2);
end
study2_time =toc;
mean2=-(mean(fopt2))
%plotting
figure(2)
subplot(2,1,1)
hold on
surfc(x,y,-f)
shading interp
plot3(x_opt2,y_opt2,-fopt2,'marker','o','MarkerSize',5,'MarkerFaceColor','r');
title ('bounded inputs')
xlabel('X-Axis')
ylabel('Y-Axis')
subplot(2,1,2)
plot(fopt2)
xlabel('iterations')
ylabel('Function maximum')

%study -2 statistical behavior
tic
for i =1:num_cases
    [inputs2 ,fopt2(i)] = ga(@stalagmite,2,[],[],[],[],[0,0],[1,1]);
    x_opt2(i)=inputs2(1);
    y_opt2(i)=inputs2(2);
end
study2_time =toc;
mean2=-(mean(fopt2))
%plotting
figure(2)
subplot(2,1,1)
hold on
surfc(x,y,-f)
shading interp
plot3(x_opt2,y_opt2,-fopt2,'marker','o','MarkerSize',5,'MarkerFaceColor','r');
title ('bounded inputs')
xlabel('X-Axis')
ylabel('Y-Axis')
subplot(2,1,2)
plot(fopt2)
xlabel('iterations')
ylabel('Function maximum')

%study -3 increasing GA iterations
tic
for i =1:num_cases
    [inputs3 ,fopt3(i)] = ga(@stalagmite,2,[],[],[],[],[0,0],[1,1]);
    x_opt3(i)=inputs3(1);
    y_opt3(i)=inputs3(2);
end
study3_time =toc;
mean3=-(mean(fopt3))
%plotting
figure(3)
subplot(2,1,1)
hold on
surfc(x,y,-f)
shading interp
plot3(x_opt3,y_opt3,-fopt3,'marker','o','MarkerSize',5,'MarkerFaceColor','r');
title ('bounded inputs with modified population size')
xlabel('X-Axis')
ylabel('Y-Axis')
subplot(2,1,2)
plot(fopt3)
xlabel('iterations')
ylabel('Function maximum')
result :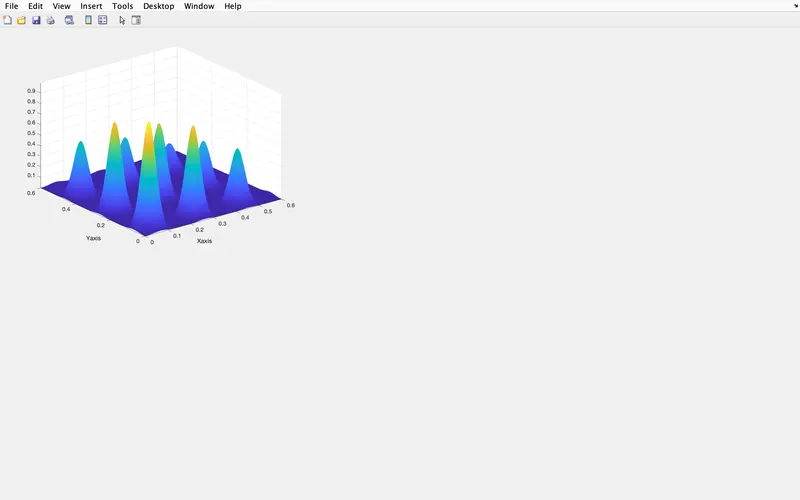
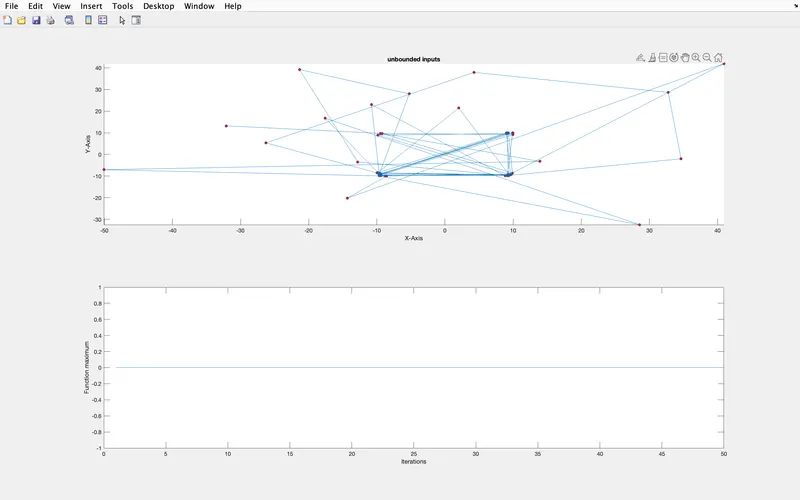
result :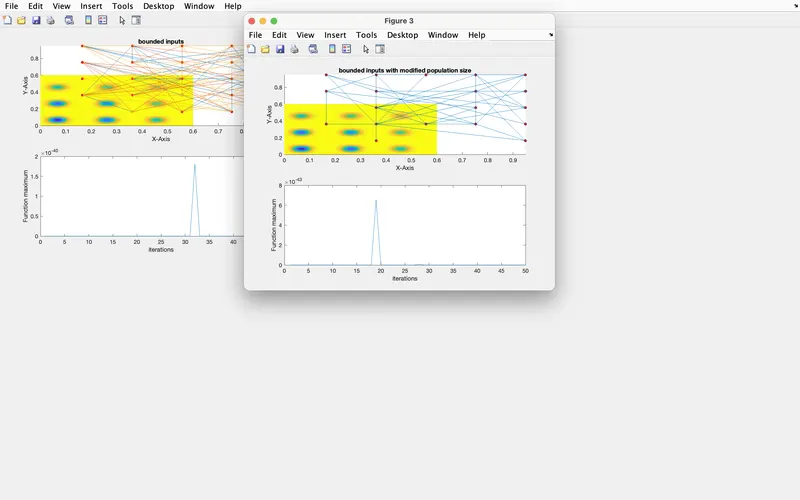
result :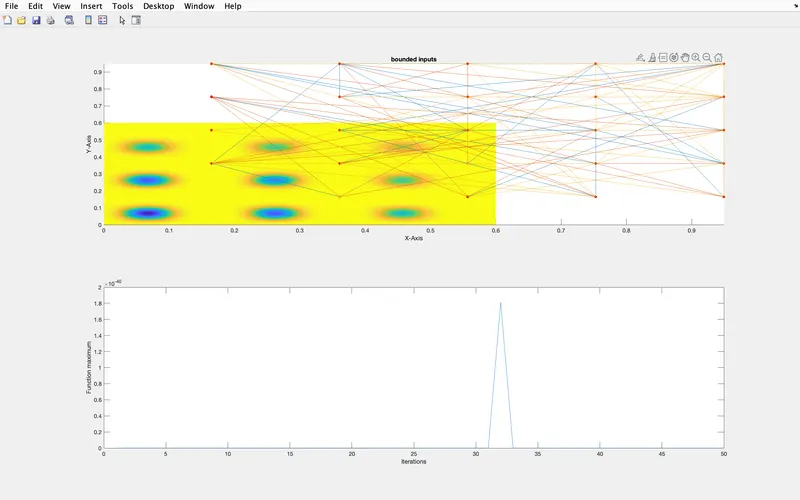
conclusion :
- understand how the optimization technique is used with ga command
- understand the function of ga and it uses
- understand how to improve our program step by step through different studies