Week 4.1 - Genetic Algorithm
Genetic Algorithm
A genetic algorithm is an algorithm that imitates the process of natural selection.They help solve optimization and search problems. The concept of algorithm is a search technique often used to compute science to find to complex nonobvious solution to algorithimic optimisation and search problems.
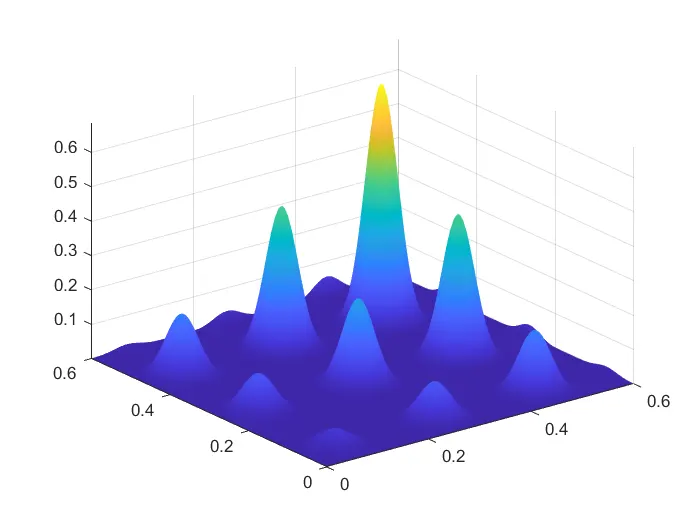
For plotting Global Maxima
clear all
close all
clc
% Defining the search space
x = linspace(0,0.6,150); % x value inputs
y = linspace(0,0.6,150); % y value inputs

% creating a 2D mesh
[xx,yy] = meshgrid(x,y);

% Evaluating the stalagmite function
for i=1:length(xx)
    for j=1:length(yy)
        input_vector(1)=xx(i,j);
        input_vector(2)=yy(i,j);
        f(i,j)=stalagmite(input_vector);
    end
end

num_cases=50; % GA Runs for 50 iterations

tic % study time count start

% study 1- statistical behavior

% Evaluating the stalagmite function
for i=1:num_cases
    [inputs,fopt(i)]=ga(@stalagmite,2); % GA function is used to run the stalagmite data & give the optimal solutions
    x_opt(i)=inputs(1);
    y_opt(i)=inputs(2);
    opt_f(i)=-f_opt(i); % GA gives minima value. Inverse f_opt is taken for maxima value
end

study1_time=toc; % study time count end

% plotting 1
figure(1)
subplot(2,1,1)
hold on
surfc(xx,yy,f) % generation of stslagmite function
shading interp % to bring visually smooth curve
plot3(x_opt,y_opt,f_opt,'marker','o','markersize','5','markerfacecolor','g')
title('unbounded inputs')
subplot(2,1,2)
plot(opt_f) % plot of opt_f for every iterations
xlabel=('Iterations');
ylabel=('function minimum');


% study 2- statistical behavior

% Evaluating the stalagmite function
num_cases=100;
tic
for i=1:num_cases;
    [inputs,f_opt(i)]=ga(@stalagmite,2,[],[],[],[],[0;0],[0.4;0.4]);
    x_opt(i)=inputs(1);
    y_opt(i)=inputs(2);
    opt_f(i)=-f_opt(i);
end

study2_time=toc;

% plotting 2
figure(2)
subplot(2,1,1)
hold on
surfc(xx,yy,f)
shading interp
plot3(x_opt,y_opt,f_opt,'marker','o','markersize','','markerfacecolor','g')
title('bounded inputs')
subplot(2,1,2)
plot(fopt)
xlabel=('Iterations');
ylabel=('function minimum');

% increasing ga iteration
options=optimoptions('ga');
options=optimoptions(options,'populationsize',450);

tic

for i=1:num_cases
    [inputs,f_opt(i)]=ga(@stalagmite,2,[],[],[],[],[0;0],[0.4;0.4],[],[],options);
    x_opt(i)=inputs(1);
    y_opt(i)=inputs(2);
    opt_f(i)=-f_opt(i);
end

study3_time=toc;

% plotting 3
figure(3)
subplot(2,1,1)
hold on
surfc(x,y,f)
shading interp
plot3(x_opt,y_opt,f_opt,'marker','o','markersize','5','markerfacecolor','g')
title('bounded inputs')
subplot(2,1,2)
plot(fopt)
xlabel=('Iterations');
ylabel=('function minimum');