Week 4.1 - Genetic Algorithm
Objective:
- To Write a code in MATLAB to optimise the stalagmite function and find the global maxima of the function.
program:
clear all
close all
clc

% inputs
% defining search space
% 1D array
x = linspace(0,0.6,150);
y = linspace(0,0.6,150);

% 2D array
[xx,yy] = meshgrid(x,y);

% for loop
for i = 1:length(xx)
    for j = 1:length(yy)
        input_vector(1) = xx(i,j);
        input_vector(2) = yy(i,j);

        f(i,j) = stalagmite_function(input_vector);
        % calling the function from stalagmite_function
    end
end

% plotting for figure(1)
figure(1)
surfc(xx,yy,f)
shading interp
title('stalagmite')
xlabel('x-axis')
ylabel('y-axis')
zlabel('z-axis')


% for generic algorithm(unbounded inputs)
no_of_iteration = 50;
tic
for i = 1:no_of_iteration
    [inputs,f_opt1(i)] = ga(@stalagmite_function,2);
    x_output1(i) = inputs(1);
    y_output1(i) = inputs(2);
end

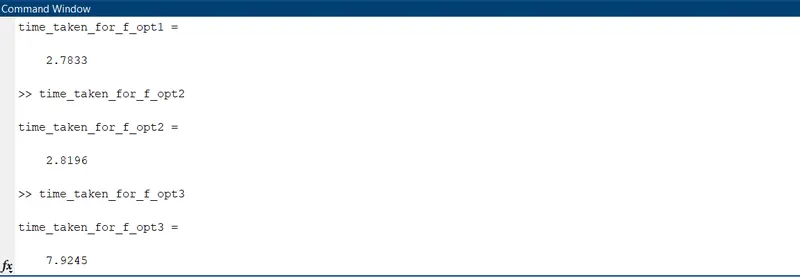
time_taken_for_f_opt1 = toc;

% plotting for figure(2)
figure(2)
subplot(2,1,1)
hold on
surfc(xx,yy,f)
shading interp
plot3(x_output1,y_output1,f_opt1,'marker','o','markersize',5,'markerfacecolor','b')
title('ga-unbounded-inputs')
xlabel('x-axis')
ylabel('y-axis')
zlabel('z-axis')
subplot(2,1,2)
plot(f_opt1)
xlabel('iteration')
ylabel('function minimum')

% coding ga with upper and lower bounds

no_of_iteration = 50;
tic
for i = 1:no_of_iteration
    [inputs,f_opt2(i)] = ga(@stalagmite_function,2,[],[],[],[],[0;0],[0.6;0.6]);
    x_output2(i) = inputs(1);
    y_output2(i) = inputs(2);
end

time_taken_for_f_opt2 = toc;

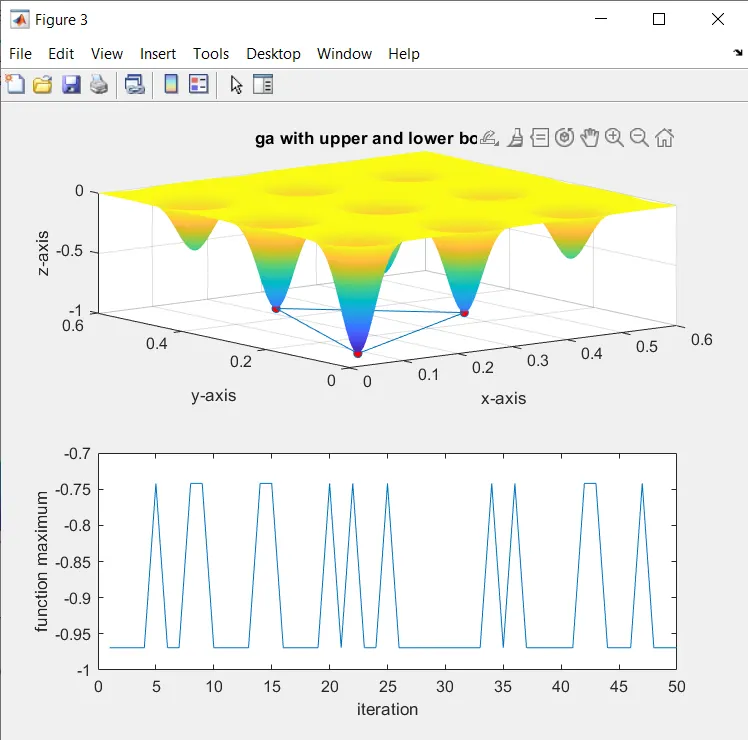
%plotting for figure(3)
figure(3)
subplot(2,1,1)
surf(x,y,f)
title('ga with upper and lower bounds')
xlabel('x-axis')
ylabel('y-axis')
zlabel('z-axis')
hold on
shading interp
plot3(x_output2,y_output2,f_opt2,'Marker','o','MarkerSize',5,'markerfacecolor','r')
subplot(2,1,2)
plot(f_opt2)
xlabel('iteration')
ylabel('function maximum')


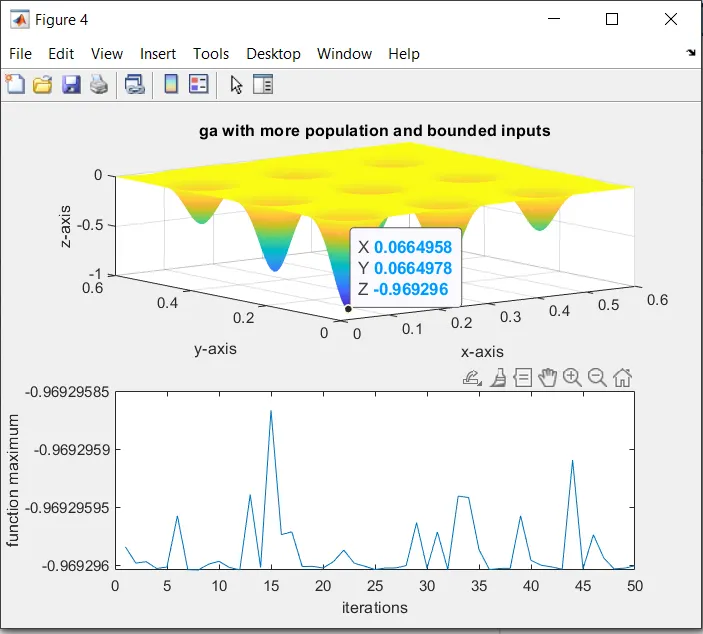
% coding for ga with more population and bounded inputs

options = optimoptions('ga');
options = optimoptions(options,'PopulationSize',200);
no_of_iteration = 50;
tic
for i = 1:no_of_iteration
    [inputs,f_opt3(i)] = ga(@stalagmite_function,2,[],[],[],[],[0;0],[0.6;0.6],[],[],options);
    x_output3(i) = inputs(1);
    y_output3(i) = inputs(2);
end
time_taken_for_f_opt3 = toc;

% plotting for figure(4)
figure(4)
subplot(2,1,1)
surf(xx,yy,f)
title('ga with more population and bounded inputs')
xlabel('x-axis')
ylabel('y-axis')
zlabel('z-axis')
hold on
shading interp
plot3(x_output3,y_output3,f_opt3,'marker','o','markersize',5,'markerfacecolor','r')
subplot(2,1,2)
plot(f_opt3)
xlabel('iterations')
ylabel('function maximum')
Generic algorithm:
A genetic algorithm (GA) is a method for solving both constrained and unconstrained optimization problems based on a natural selection process that mimics biological evolution. The algorithm repeatedly modifies a population of individual solutions. At each step, the genetic algorithm randomly selects individuals from the current population and uses them as parents to produce the children for the next generation. Over successive generations, the population "evolves" toward an optimal solution.
You can apply the genetic algorithm to solve problems that are not well suited for standard optimization algorithms, including problems in which the objective function is discontinuous, nondifferentiable, stochastic, or highly nonlinear.
GA syntax:
x = whatever the output we needintcon take integer values (not using in this program so we are closing it [])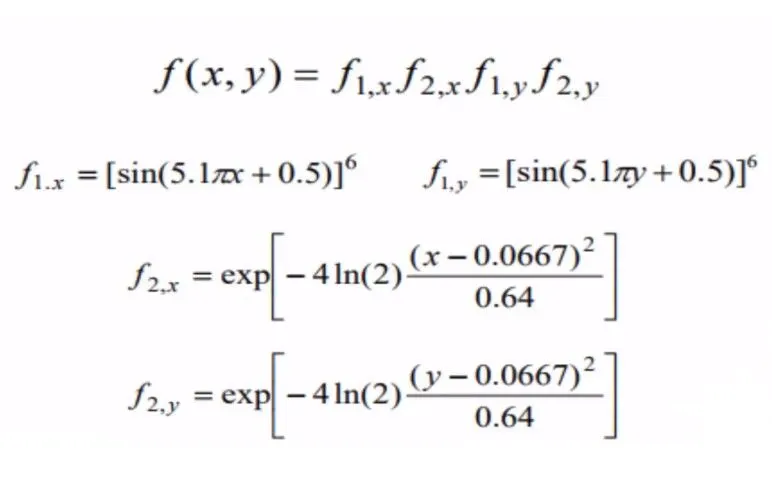
- surf(xx,yy,f) - we can take the 3d like plot with surf command for that we need x,y,and z respectively in the syntax
- shading interp - it is used to clear the grid in the stalagmite and give more smooth image
- tic and toc are used to know how much time it takes to run the certain case
- subplot = subplot(m,n,p)
m refer to how many rows
n - how many columns
p - in which row or column the plot belongs
options - it is used to optimise the program
syntax :
options = optimoptions('ga','Option1','value1','Option2','value2');
-
options— Structure containing all the current options settings. - option1 = population size
- value1 = its value (in this case it is 200)
plots and subplots for each case:
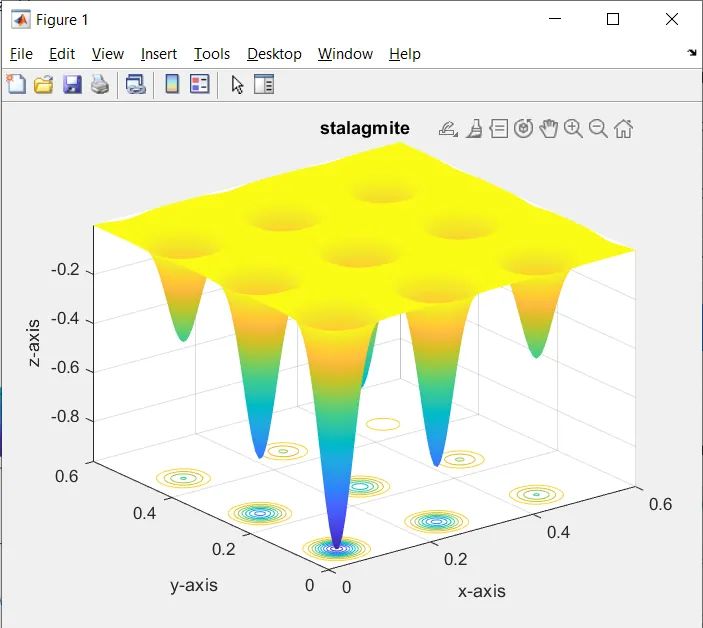
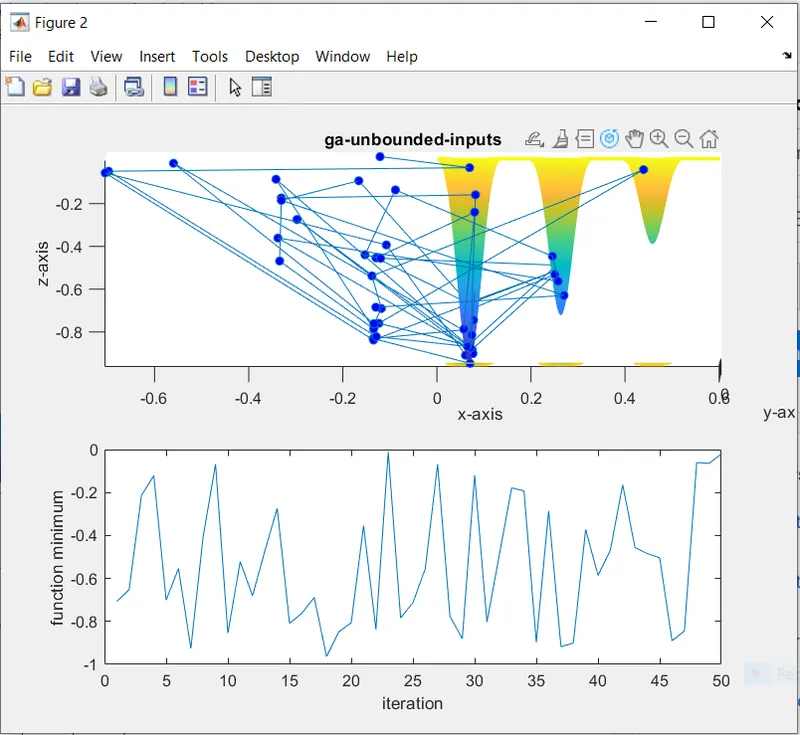
3. ga with upper and lower bounds:
https://in.mathworks.com/help/gads/genetic-algorithm-options.html
https://in.mathworks.com/help/matlab/ref/subplot.html#:~:text=subplot(%20m%20%2C%20n%20%2C%20p%20)%20divides%20the%20current%20figure,first%20row%2C%20and%20so%20on.