Week 4.1 - Genetic Algorithm
AIM:- To study about Genitic Algorithm and to calculate the global maxima of stalagmite function using Genetic Alogarithm in matlab.
OBCTIVE:
1.To study about Genetic Algorithm and stalagmite function.
- To write a code in matlab to optimse the stalagmite function and fid the global maxima of the function.
- To plot graph based on the studies done for Genetic Algorithm .
THEORY :A genetic algorithm (GA) is a method for solving both constrained and unconstrained optimization problems based on a natural selection process that mimics biological evolution. The algorithm repeatedly modifies a population of individual solutions. Generates a population of points at each iteration.
Concept of Genetic Algorithm –
1.Genetic Algorithm is a search-based optimization technique based on the principai of genitic and natural selection .it is frequently used to find optimal or near –optimal solution to difficult problems which otherise would take a lifetime to solve.
- Nature has always been a great source of inspiration to all mankind . Genetic Algorithm arearch based on the concepts ofnatural selection and genetics.
- Genetic Algorithm are a subset of much larger branch of compulation known as evolutionary Computation.
-
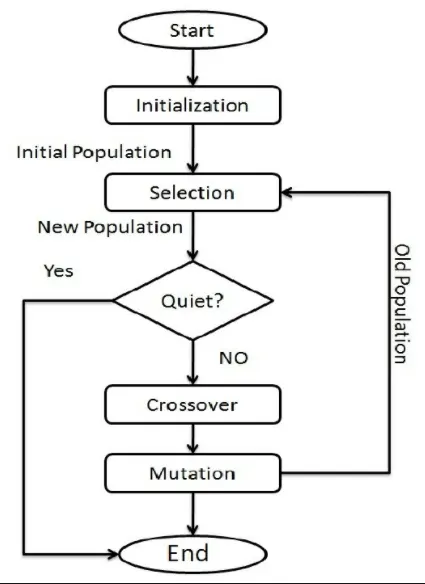
The flow chart of Genetic Alogarithm is given
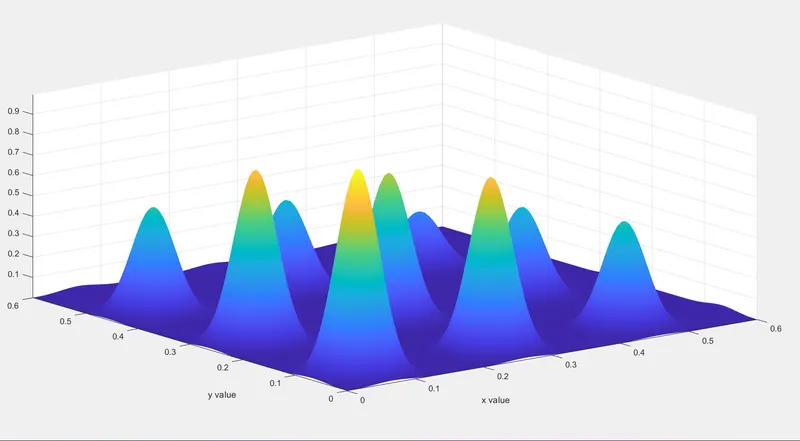
Stalagmite function-A stalagmite function generally refers to the function with which we are generating values over a stalagmite kind of surface for finding out the local and global maxima and minima of that particular given function.
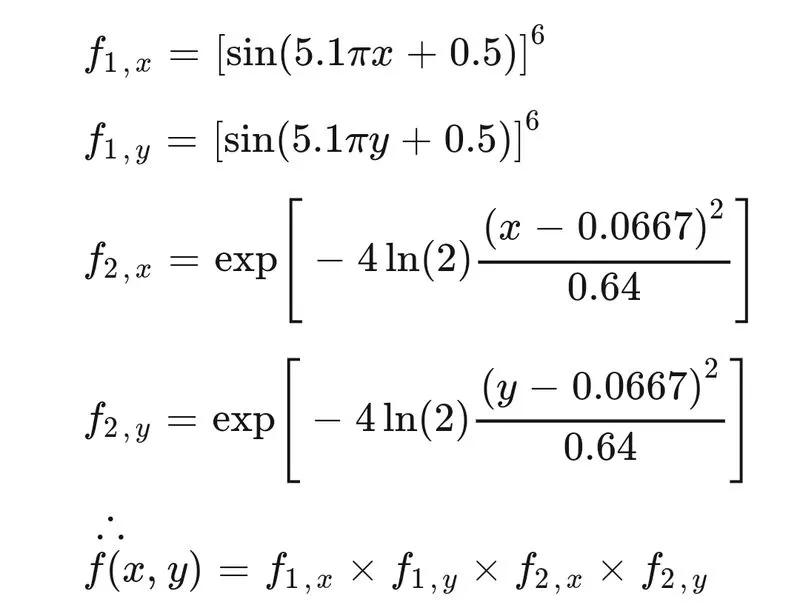
The stalagmite function is given as,
Syntax for genetic algorithm
x = ga(fun,nvars,A,b,Aeq,beq) finds a local minimum x to fun, subject to the linear equalities Aeq*x = beq and A*x ≤ b. (Set A=[] and b=[] if no linear inequalities exist.) ga evaluates the matrix product Aeq*x as if x is transposed (Aeq*x').
x = ga(fun,nvars,A,b,Aeq,beq,lb,ub,nonlcon) subjects the minimization to the constraints defined in nonlcon. The function nonlcon accepts x and returns vectors C and Ceq, representing the nonlinear inequalities and equalities respectively. ga minimizes the fun such that C(x) ≤ 0 and Ceq(x) = 0. (Set lb=[] and ub=[] if no bounds exist.)
MATLAB PROGRAM FOR GA :-
clear all
close all
clc
%Define our search space
x=linspace(0,0.6,150);
y=linspace(0,0.6,150);
n=50;
%Creating a 2D array
[xx yy]=meshgrid(x,y);
%Evalueating a stalagmite function
for i=1:length(xx)
for j=1:length(yy)
input_vector(1)=xx(i,j);
input_vector(2)=yy(i,j);
f(i,j)=stalagmite(input_vector);
end
end
%Study 1: Statistical behaviour
tic
for i=1:n;
[inputs,fopt(i)]=ga(@stalagmite,2);
xopt(i)=inputs(1);
yopt(i)=inputs(2);
end
study1_time=toc
figure(1)
subplot(2,1,1)
hold on
surfc(xx,yy,-f)
shading interp
xlabel('\bf X-axis')
ylabel('\bf Y-axis')
title('\bf Statistical beheviour with unbounded inputs')
plot3(xopt,yopt,-fopt,'marker','o','markersize',5,'markerfacecolor','r')
subplot(2,1,2)
plot(-fopt)
xlabel('\bf No of iterations')
ylabel('\bf function maximum')
%study 2:statistical behaviour with lower and upper
tic
for i=1:n
[inputs fopt(i)]=ga(@stalagmite,2,[],[],[],[],[0;0],[1;1]);
xopt(i)=inputs(1);
yopt(i)=inputs(2);
end
study2_time=toc
figure(2)
subplot(2,1,1)
hold on
surfc(xx,yy,-f)
shading interp
xlabel('\bf X-axis')
ylabel('\bf Y-axis')
title('\bf statistical behaviour with lower and upper')
plot3(xopt,yopt,-fopt,'marker','o','markersize',5,'markerfacecolor','r')
subplot(2,1,2)
plot(-fopt)
xlabel('\bf No of iteration')
ylabel('\bf function maximum')
% Study 3: Statistical behaviour with increasing iterations of GA
options=optimoptions('ga');
options=optimoptions(options,'populationsize',300);
tic
for i=1:n
[inputs,fopt(i)]=ga(@stalagmite,2,[],[],[],[],[0;0],[1;1],[],[],options);
xopt(i)=inputs(1);
yopt(i)=inputs(2);
end
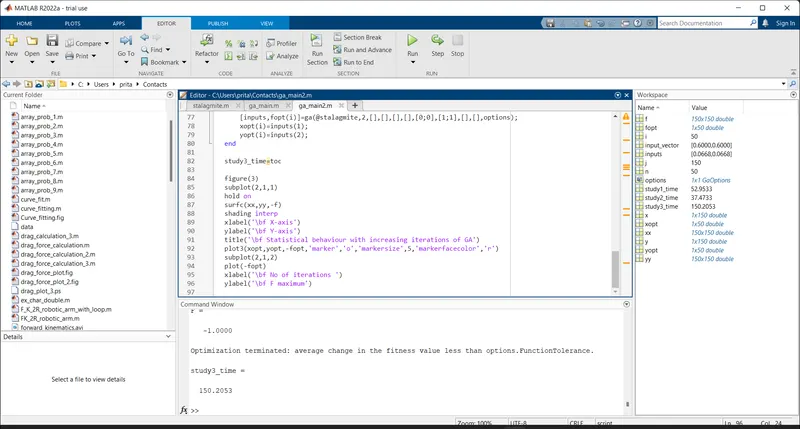
study3_time=toc
figure(3)
subplot(2,1,1)
hold on
surfc(xx,yy,-f)
shading interp
xlabel('\bf X-axis')
ylabel('\bf Y-axis')
title('\bf Statistical behaviour with increasing iterations of GA')
plot3(xopt,yopt,-fopt,'marker','o','markersize',5,'markerfacecolor','r')
subplot(2,1,2)
plot(-fopt)
xlabel('\bf No of iterations ')
ylabel('\bf function maximum')
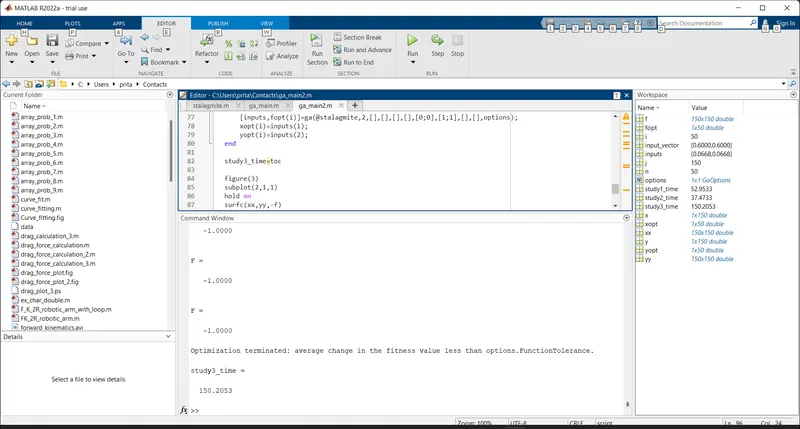
OUTPUT-
I hope this will make you satisfy.
THANK YOU
SKILL LYNC