Project 1 - Parsing NASA thermodynamic data
AIM:- To write a code in matlab to parase the NASA thermodyanamics data file and then calculate thermodyanamics properties of various gas
Objective:
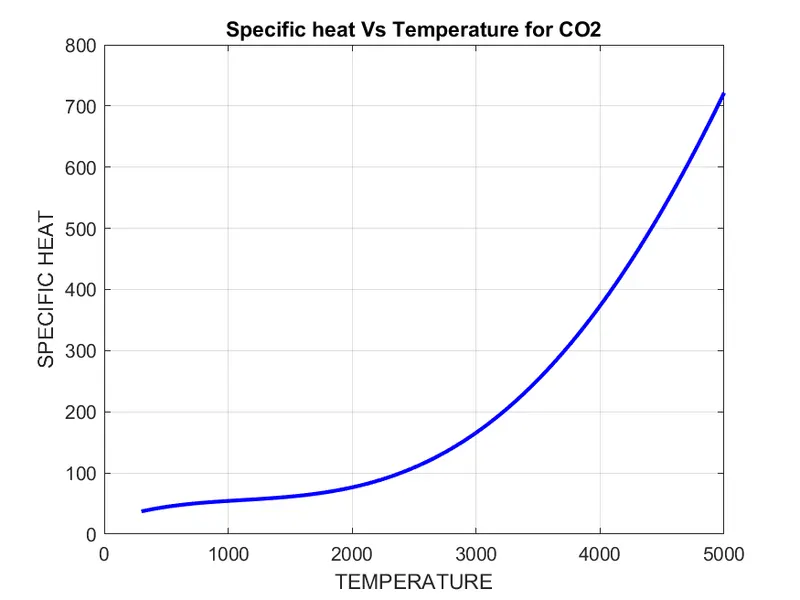
Write a function to extract 14 coefficients and calculate Enthalpy, Entropy, Specific heat & molecular weight for all the species in the data file.
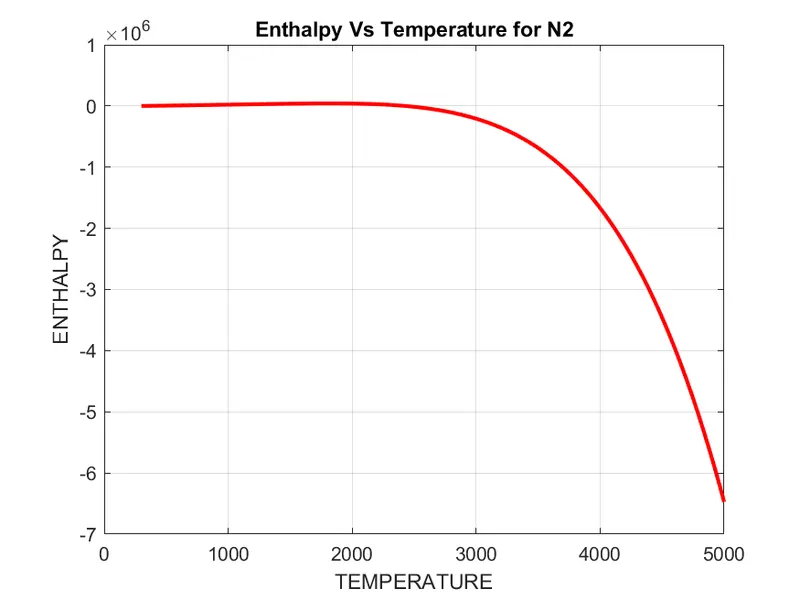
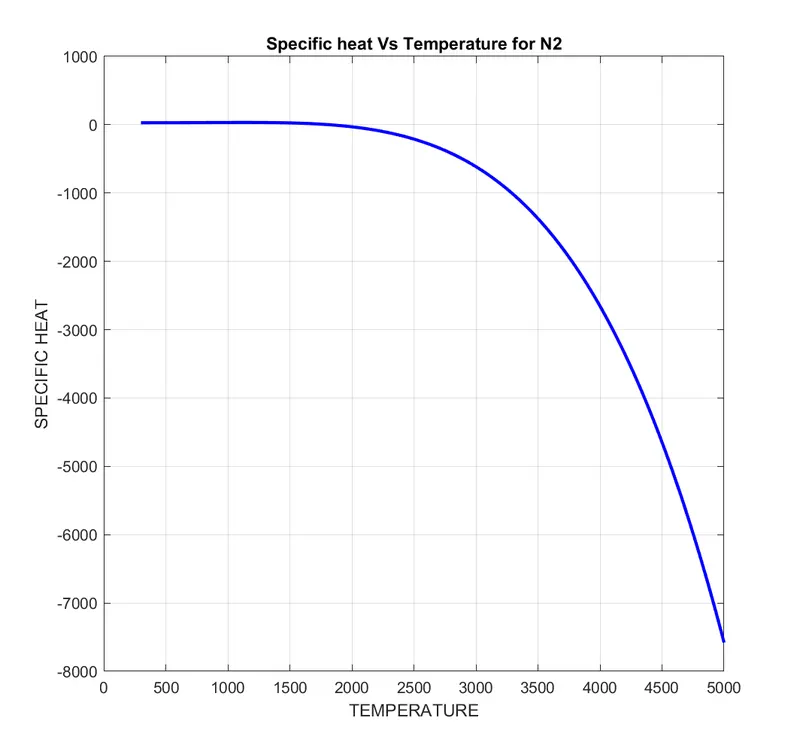
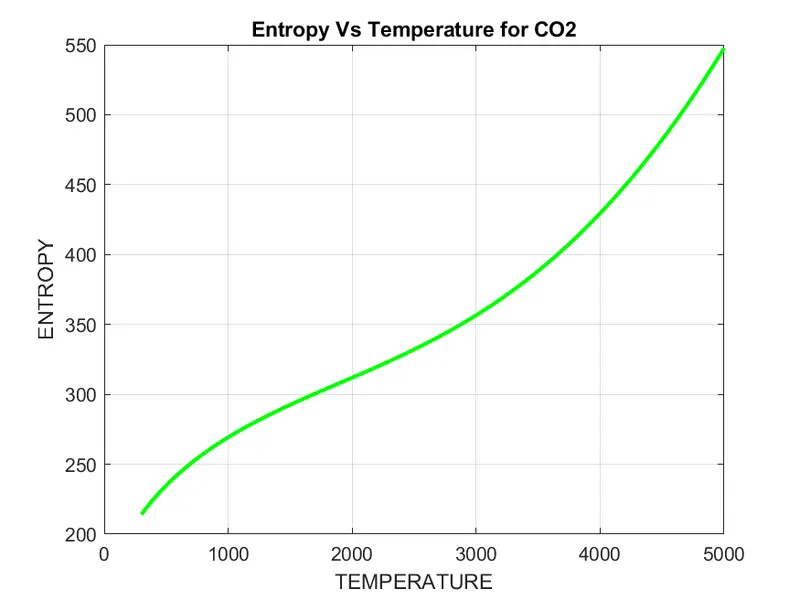
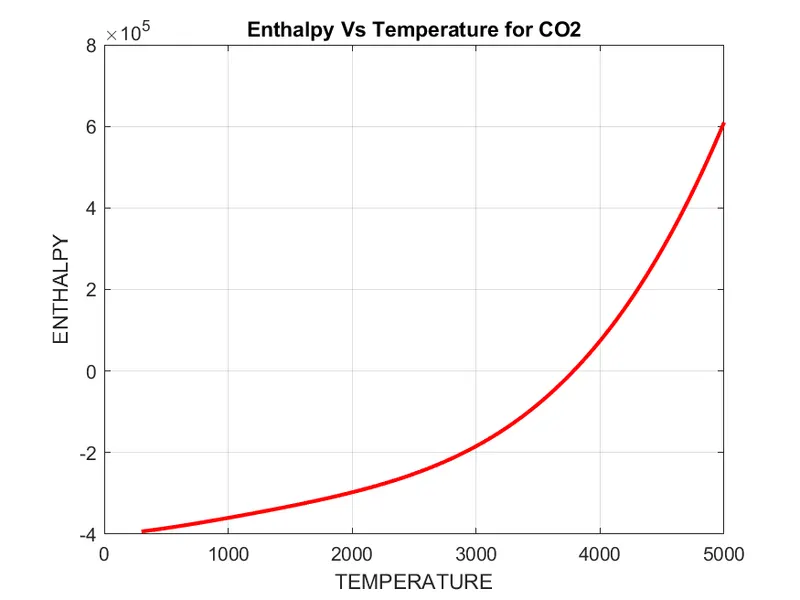
Plot Cp, Enthalpy, and Entropy for temperature range.
Save the plots as images with appropriate names and dump them in separate folders for each species wit
h suitable names. All these should be generated automatically.
THEORY:
File Parsing
Parsing a file means reading the data stream of some sort and building an in-memory model of semantic content of the data. This aims at facilitating & performing a transformation on the data. In general, 'Parsing' refers to MATLAB reading an 'm-file' and then translating the data of 'm-file' into internal code in MATLAB, which it stores in memory. When you execute the code, the file which is parsed in memory will run.
Specific Heat (Cp) –
It is the ratio of the quantity of heat required to raise the temperature of a body by 1 degree to that required to raise the temperature of an equal mass of water by one degree.
Cp/R = a1 + a2 T + a3 T^2 + a4 T^3 + a5 T^4
Where Cp = Specific heat,
R = Universal gas constant.
Entropy –
It is the measure of a system's thermal energy per unit temperature that is unavailable for doing useful work. Because work is obtained from ordered molecular motion, the amount of entropy is also a measure of the molecular disorder, (or) randomness, of a system.
S/R = al lnt + a2 T + a3 T^2 /2 + a4 T^3 /3 + a5 T^4 /4 + a 7
Where, S = Entropy
R = Universal gas constant.
Enthalpy - H = U+PV Simply, Enthalpy is the sum of internal energy and product of pressure and volume. When a process occurs at constant pressure.
H/RT = al + a2 T/2 + a3 T^2 /3 + a4 T^3 /4 + a5 T^4 /5 + a6/T
Where H = Enthalpy
R = Universal gas constant.
Main Code Explanation
- I have used 'fopen' command to open Nasa's experimental data.
- If you open the experimental data and analyze what's happening, we can easily code it according to our requirements.
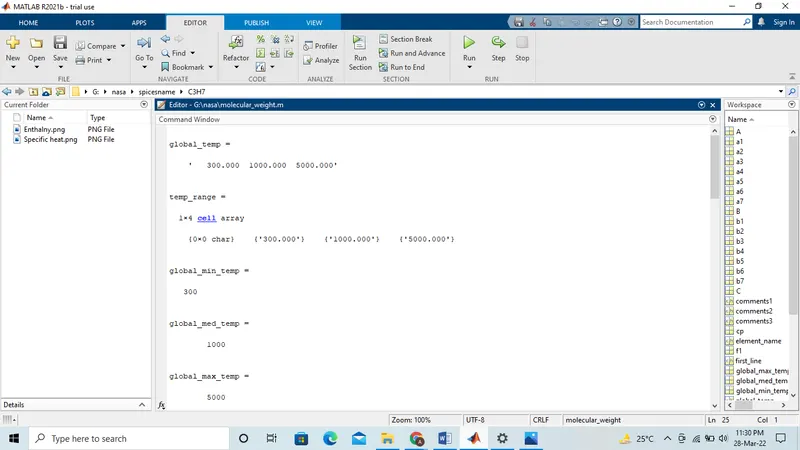
- jst line consists of text (THERMO). I gave 'fgetl' command to read the 1st o Second-line consists of 3 temperature values. Like 1st line use 'fgetl' to read the 2nd line and store it in variable global_temp.
- After reading the 2nd line, I have used 'strsplit' command using 'blank space' as a delimiter. 'strsplit' splits the data using the given delimiter. Therefore, temp_range consists of all 3 temperature values in a vector.
- Now, obtain the global minimum, medium, and maximum temperatures from the split data, use 'str2num' as this converts character array to numeric array.
- Then create a vector of 400 evenly spaced temperature points using 'linspace' command and provide universal gas constant value.
- 30,4th & 5th lines in the data are comments. Use 'fgetl' again for reading those 3 lines. o From line '6' to line '218', there are a set of 4 lines. 1st line consists of the name of species 2nd, 3rd, 4th lines consist of experimental data.
8.Now, I will explain the code for these 4 lines of data.
- Line 1-1 have read line '6' using 'fgetl' and stored it in line 1 variable.
- I have used 'strtok' command to get the selected parts of the string (ie, species name 'o')
- Line 2 - I have read line 7' using 'fgetl' and stored it in line 2 variable.
- Use 'strfind' command to find the places of 'E' in line 7, 'strfind' is used to find strings within other strings. Now store them in an array named 'A'
- Similarly, follow these steps for the next 2 lines. Then, you will get A, B, C arrays respectively.
- Now, extract all the coefficients (a, A2, A3, A4, A5, A6, A7, bi, b2, 63, 64, 65, 66, b7) using 'str2num' command.
Main program:-
clear all
close all
clc
f1 = fopen('THERMO.dat', 'r');
first_line = fgetl(f1); %reading the 1st line from data
% Obtaining global max, min, and medium temperatures
global_temp = fgetl(f1) %reading and line from data
temp_range = strsplit(global_temp,' ') %splitting 2nd line using blank space as delimiter
%obtaining temperature values from splitted data
global_min_temp = str2num(temp_range{2})
global_med_temp = str2num(temp_range{3})
global_max_temp = str2num(temp_range{4})
%Create a vector of 400 evenly spaced temperature points
T =linspace(global_min_temp, global_max_temp, 400);
R = 8.314; % Universal gas constant
comments1 = fgetl(f1); %reading 3rd line from data
comments2 = fgetl(f1); %reading 4th line from data
comments3 = fgetl(f1); %reading 5th line from data
for i = 1:53
line1 = fgetl(f1);
element_name = strtok(line1);
line2 = fgetl(f1);
A = strfind(line2, 'E');
line3 = fgetl(f1);
B = strfind (line3, 'E');
line4 = fgetl(f1);
C = strfind(line4, 'E');
a1 = str2num(line2(1:A(1)+3));
a2 = str2num(line2(A(1)+4:A(2)+3));
a3 = str2num(line2(A(2)+4:A(3)+3));
a4 = str2num(line2(A(3)+4:A(4)+3));
a5 = str2num(line2(A(4)+4:A(5)+3));
a6 = str2num(line3(1:B(1)+3));
a7 = str2num(line3(B(1)+4:B(2)+3));
b1 = str2num(line3(B(2)+4:B(3)+3));
b2 = str2num(line3(B(3)+4:B(4)+3));
b3 = str2num(line3(B(4)+4:B(5)+3));
b4 = str2num(line4(1:C(1)+3));
b5 = str2num(line4(C(1)+4:C(2)+3));
b6 = str2num(line4(C(2)+4:C(3)+3));
b7 = str2num(line4(C(3)+4:C(4)+3));
%specific heat
cp = specific_heat(a1,a2,a3,a4,a5,b1,b2, b3, b4,b5, T, R, global_med_temp);
% Enthalpy
h = enthalpy(a1, a2, a3, a4, a5, a6,b1,b2,b3, b4, b5, b6, T, R,global_med_temp);
% Entropy
s = entropy(a1, a2, a3, a4, a5, a7, b1,b2, b3, b4, b5,b7,T,R,global_med_temp);
% Calculating molecular weight of species
Molecular_wt(i) = molecular_weight(element_name);
%saving and plotting the data
mkdir(['G:\nasa\spicesname\',element_name]);
figure(1)
plot(T,cp,'linewidth',2,'color','b')
title(sprintf('Specific heat Vs Temperature for %s', element_name))
xlabel('TEMPERATURE')
ylabel('SPECIFIC HEAT')
grid on
figure(2)
plot(T,h,'linewidth',2,'color', 'r')
title(sprintf('Enthalpy Vs Temperature for %s',element_name))
xlabel('TEMPERATURE')
ylabel('ENTHALPY')
grid on
figure(3)
plot(T,s,'linewidth',2,'color','g')
title(sprintf('Entropy Vs Temperature for %s',element_name))
xlabel('TEMPERATURE')
ylabel('ENTROPY')
grid on
%pause the loop so that you can see each species plot in real time
pause(0.0001)
cd(['G:\nasa\spicesname\',element_name])
saveas(1,'Specific heat.png');
saveas(2,'Enthalpy.png');
saveas(3,'Entropy.png');
cd ..
end
fclose(f1);
%program to specific heat
function cp = specific_heat(a1, a2, a3, a4, a5, b1,b2,b3, b4, b5, T, R, global_med_temp)
% Comparing with global temp
if T > global_med_temp
cp = R.*(a1+a2.*T+a3.*T.^2+a4.*T.^3+a5.*T.^4);
else
cp = R.*(b1+b2.*T+b3.*T.^2+b4.*T.^3+b5.*T.^4);
end
%program to calculate enthalpy
function h= enthalpy (a1, a2, a3, a4, a5, a6, b1,b2,b3, b4, b5, b6, T, R, global_med_temp)
if T > global_med_temp
h = R.*(a1.*T+(a2.*T.^2)./2+(a3.*T.^3)./3+(a4.*T.^4)./4+(a5.*T.^5)./5+6);
else
h = R.*(b1.*T+(b2.*T.^2)./2+(b3.*T.^3)./3+(b4.*T.^4)./4+(b5.*T.^5)./5+b6);
end
%Program to Calculate entropy
%Program to calculate entropy
function s=entropy(a1,a2,a3,a4,a5,a7,b1,b2,b3, b4, b5, b7, T, R, global_med_temp)
if T<=global_med_temp
s=R.*(a1.*log(T)+a2.*T+a3.*(T.^2)./2+a4.*(T.^3)./3+a5.*(T.^4)./4+a7);
else
s=R.*(b1.*log(T)+b2.*T+b3.*(T.^2)./2+b4.*(T.^3)./3+b5.*(T.^4)./4+b7);
end
%Program to Calculate Molecular weight
function MW =molecular_weight(element_name)
atoms = ['H','C','N','O','A'];
fprintf('Molecular weight of ');
fprintf(element_name);
fprintf(':');
atomic_weight = [1 12 14 15 39];
MW = 0;
for i = 1: length(element_name)
for j = 1: length(atoms)
if strcmp(element_name(i), atoms (j))
MW = MW +atomic_weight(j);
position = j;
end
end
n = str2num(element_name(i));
if n>1
MW = MW + atomic_weight(position)*(n-1);
end
end
fprintf('%d',MW);
disp(' ');
end
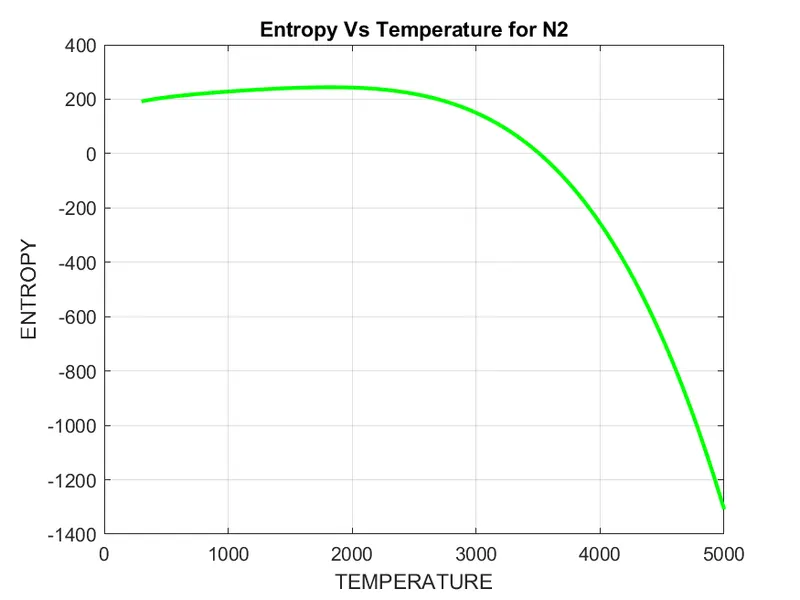
Plot Of N2,o2,co2
1. O2
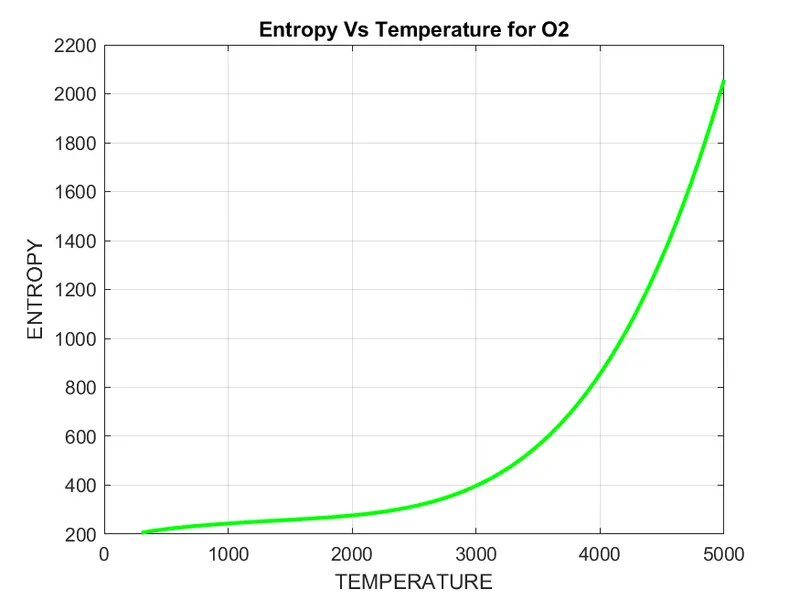
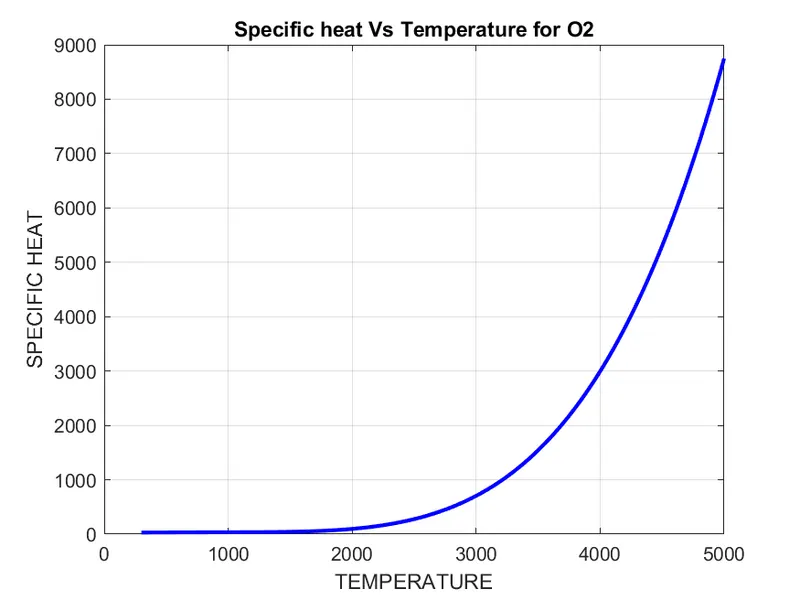
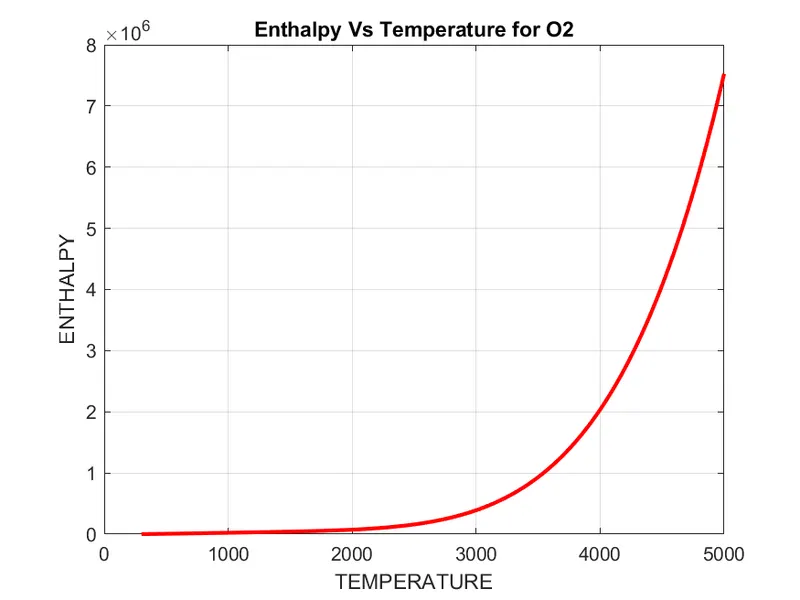
2.N2
3.CO2

Output :
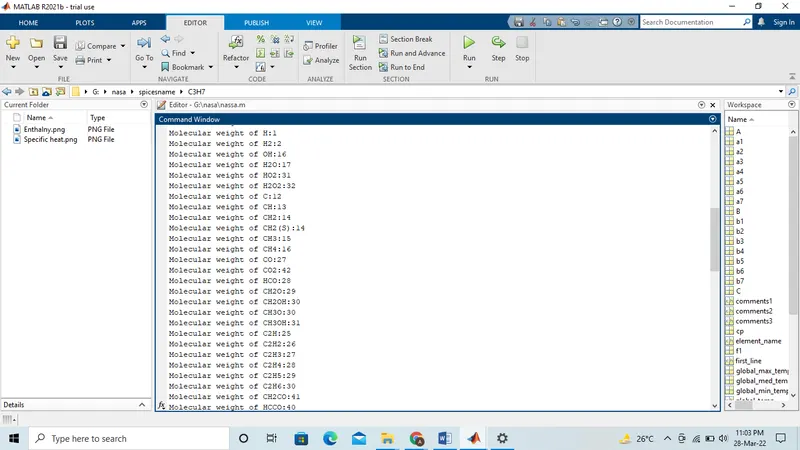
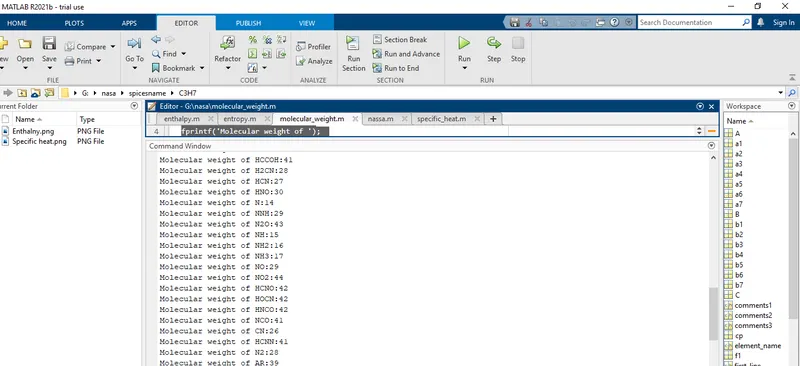
Molecular weights of element screenshoo
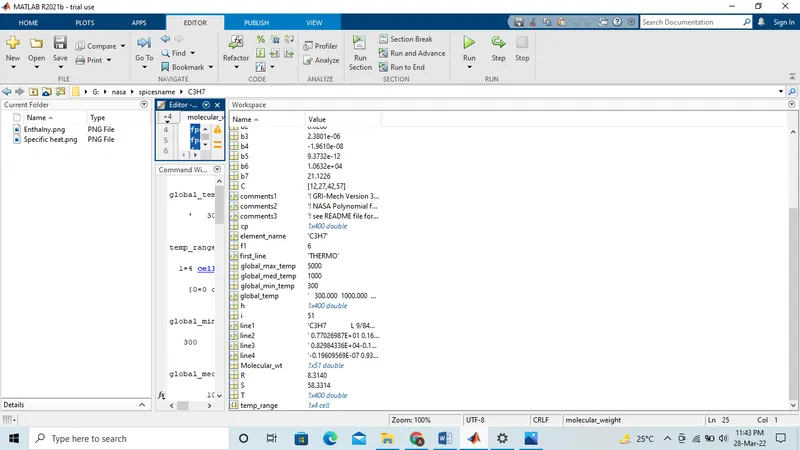
Workspace
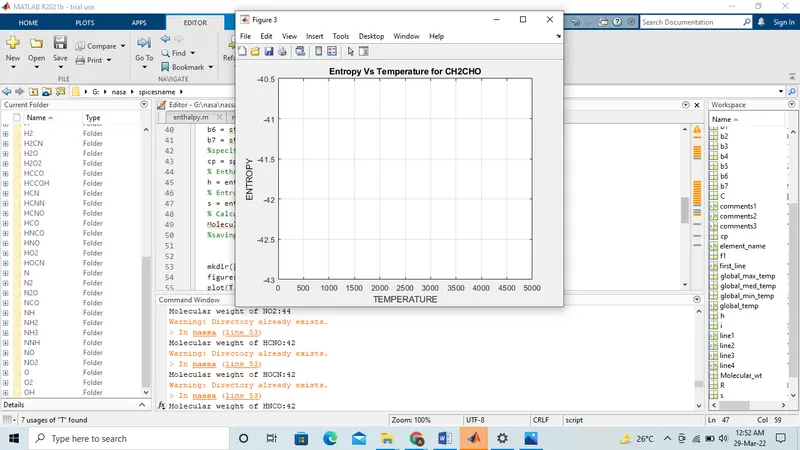
ERROR for entropy plot
Thank you!