%Statistical Behavior of STALAGMITE FUNCTION

close all
clear all
clc
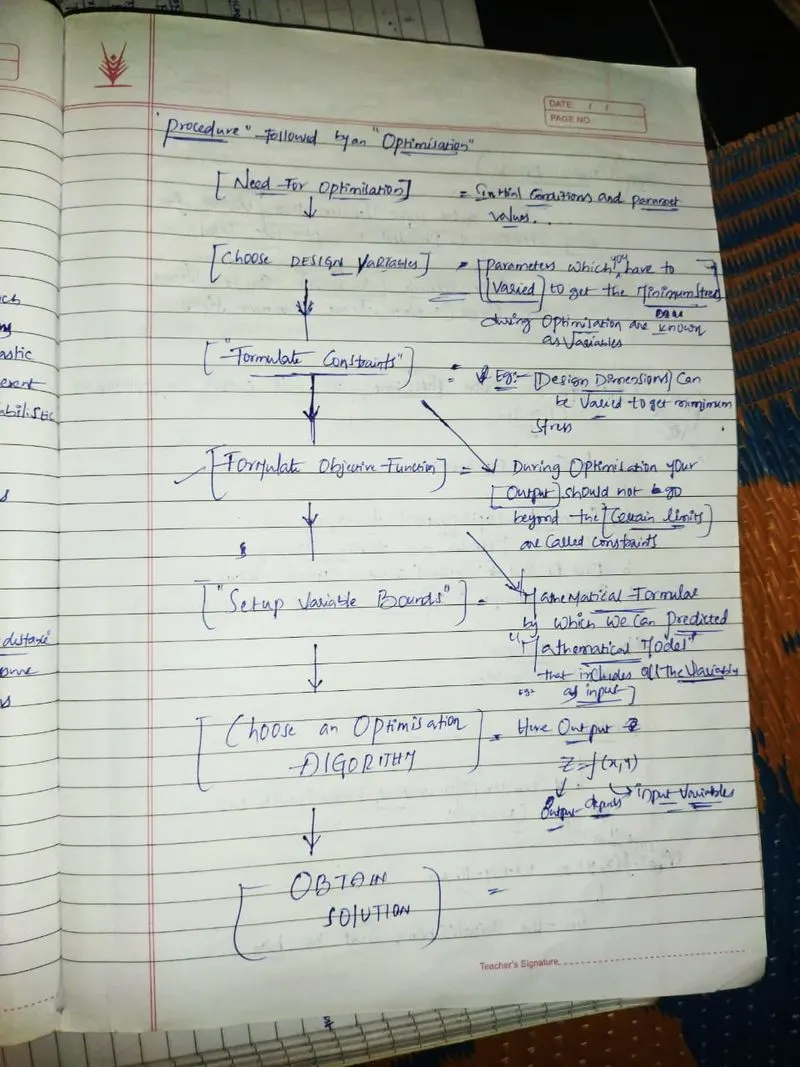
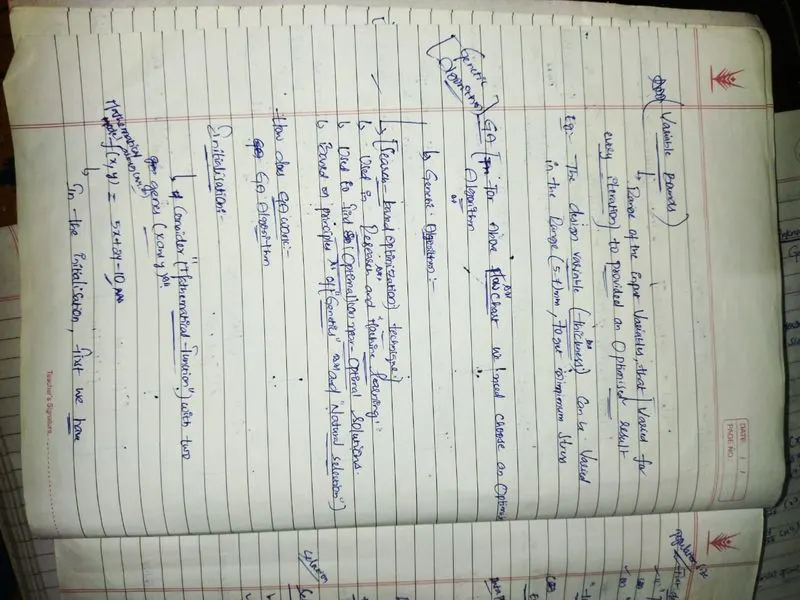
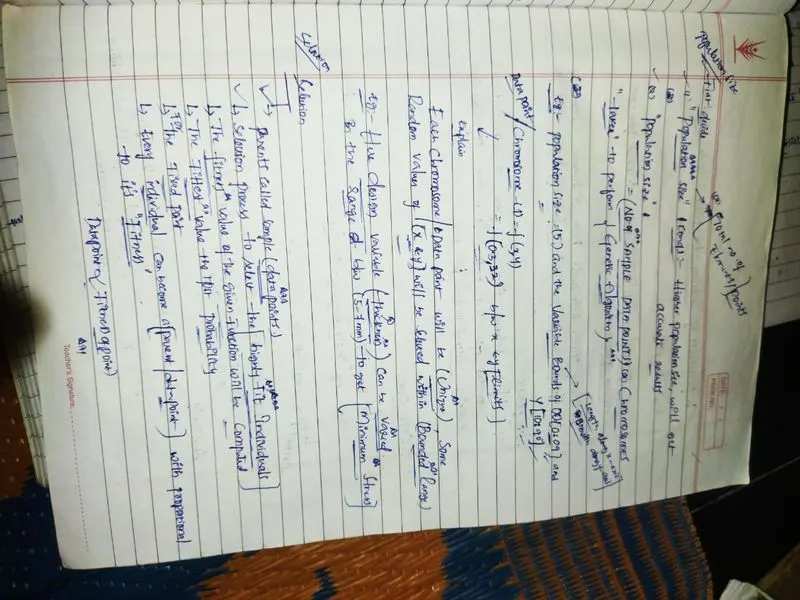
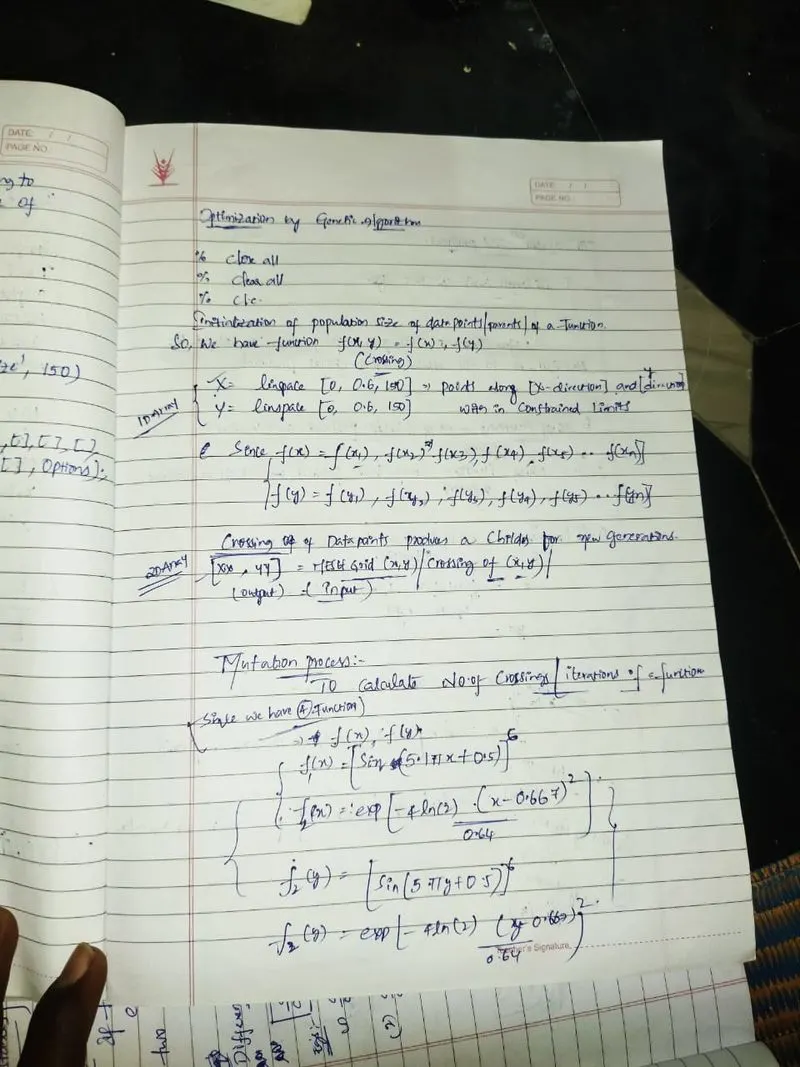
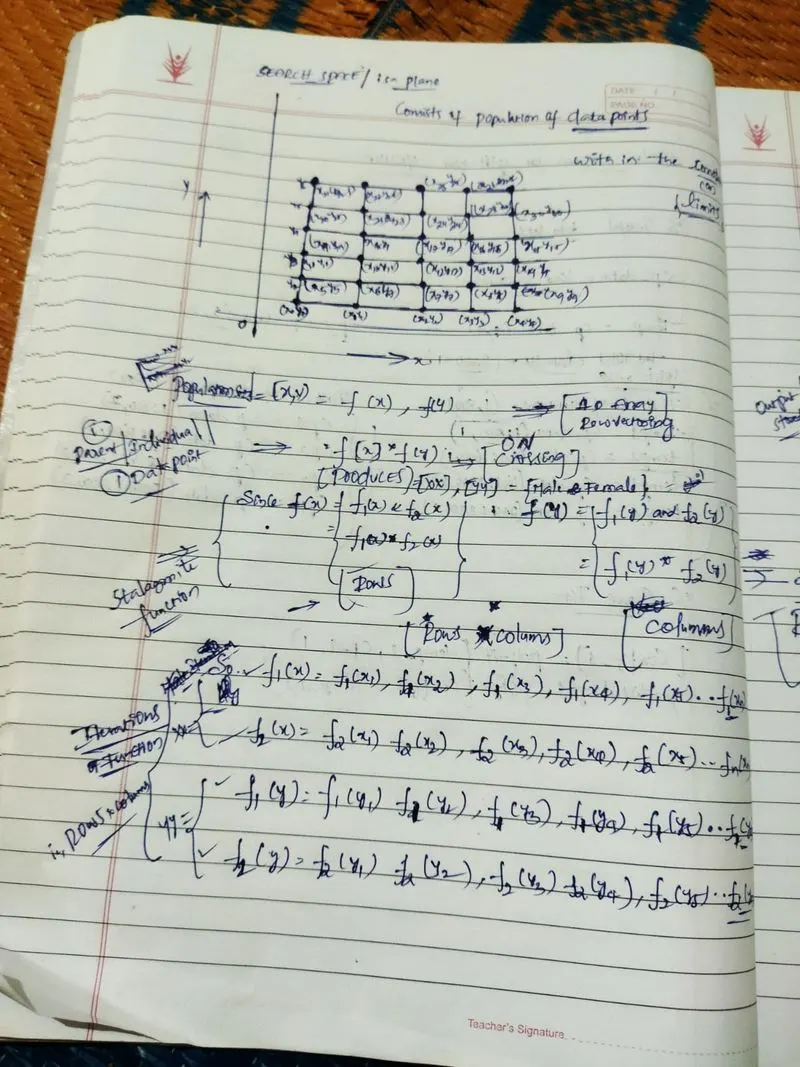
%search space[intialisation of poulation of chhromozomes/datapoints/parents
x=linspace(0,0.6,150);%population of size with in limits[0,0.6]
y=linspace(0,0.6,150);%population of size with in limits[0,0.6]

num_cases=50%no iterations is equal to no of crossings(x,y)
%f=get_stalagmite function
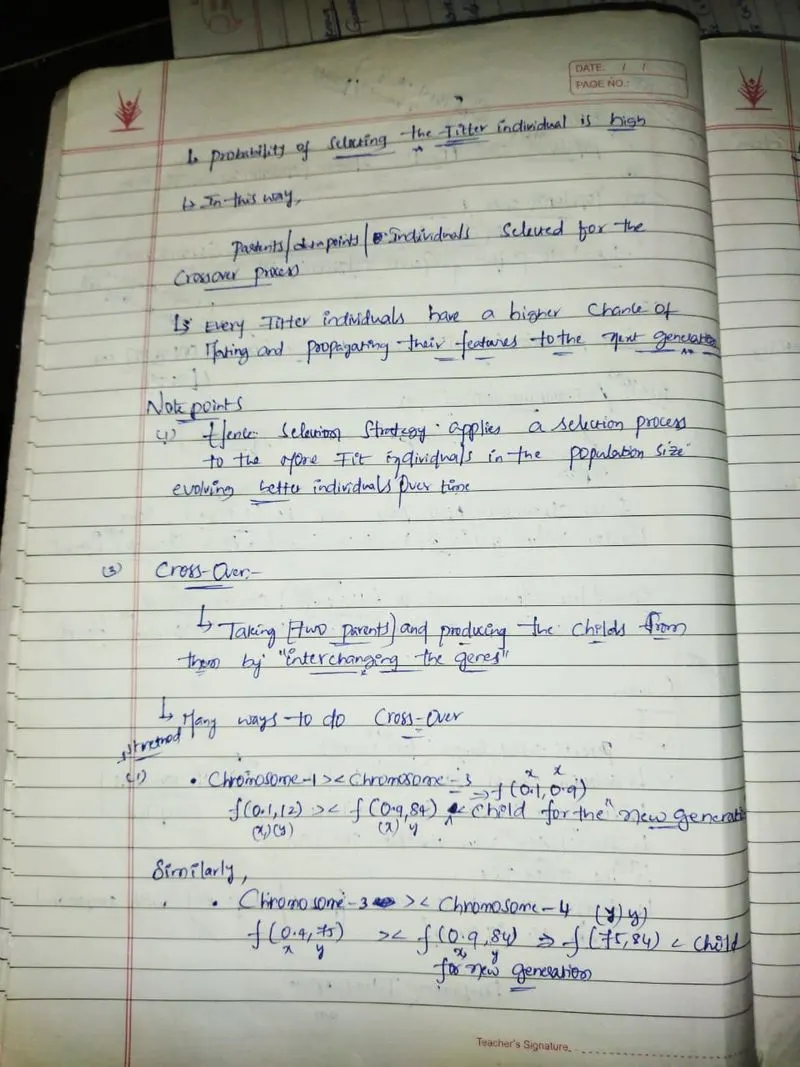
[xx,yy]=meshgrid(x,y)%this is crossings

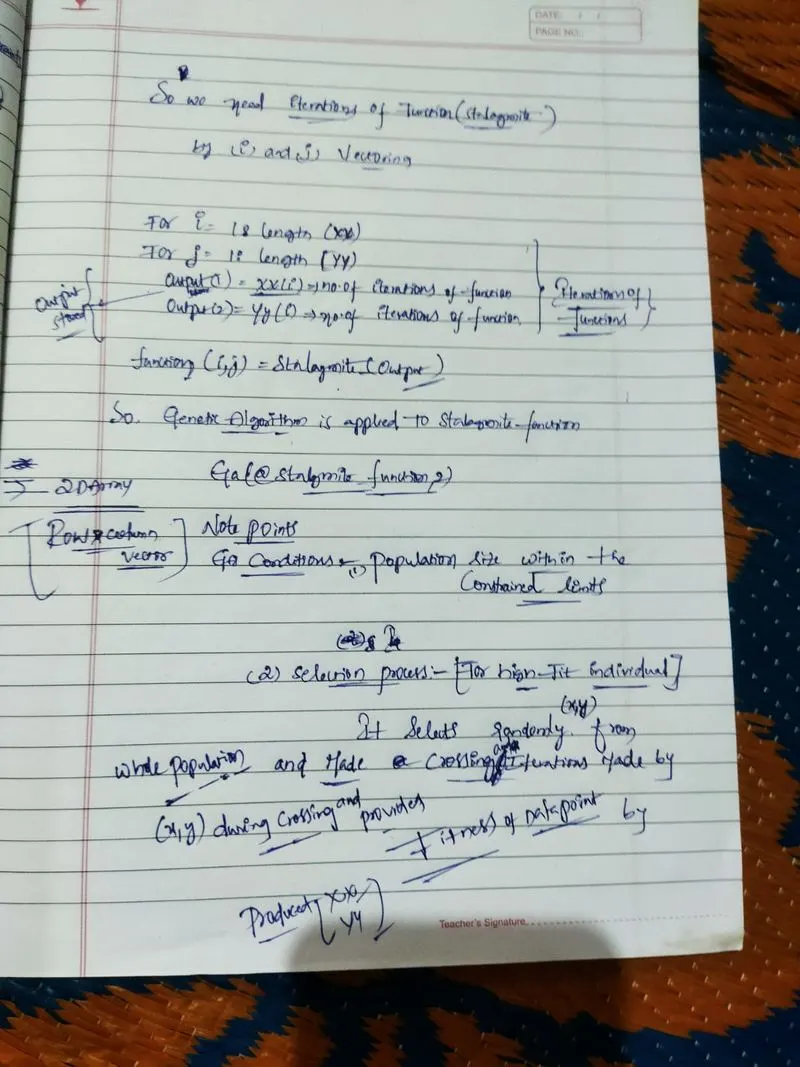
for i=1:length(x)% The function i={f1(x),f2(x)}repeats to the length of xx(crossings of x,y)
 for j=1:length(yy)%The functionj={f1(y),f2(y)}repeats to the length of xx(crossings of x,y)
     input_vector(1)=xx(i,j);%no of iterations stored
     input_vector(2)=yy(i,j);%no of iterations stored
     f(i,j)=stalagmite(input_vector);%function(i,j) is the total no of iterations stored in inpur vector.
 end
end

%study1=statistical behavior b/w no of iterations of functions v/s function
%optimum

%WE study x&y & optimum function value that GA predicts over 50
%studies/iterations provided by stalagmite function....
tic
for i=1:num_cases% As a function of iterations
    [inputs,fopt(i)]=ga(@stalagmite,2)%
    xopt(i)=inputs(1);%stored as input of x
    yopt(i)=inputs(2);%stored as input of y
end
study_time=toc%time taken for 50 iterations
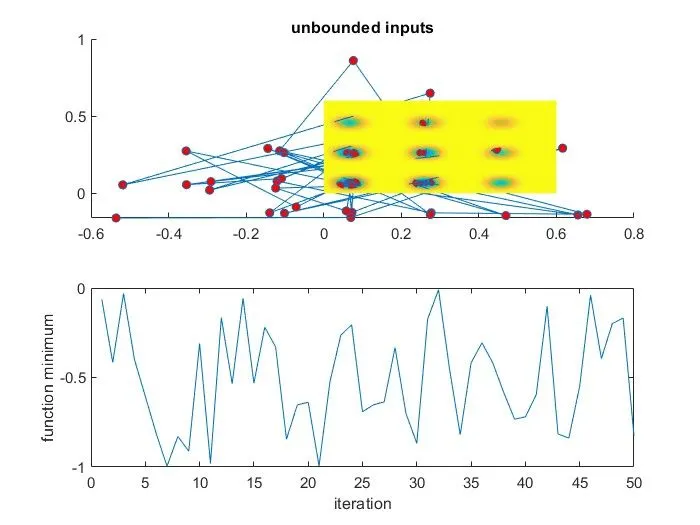
figure(1)%
subplot(2,1,1)%multiple plots inside fig window.so we create subplot
hold on
surf(x,y,f)%3d surface
shading interp%mesh grid lines visible or not to visible
%To plot x&y & optimum function value that GA predicts over 50
%studies/iterations...
plot3(xopt,yopt,fopt,'Marker','o','markersize',5,'markerfacecolor','r')

title('unbounded inputs')
subplot(2,1,2)
plot(fopt)
xlabel('iteration')
ylabel('function minimum')
%Study2-statistical beheavior for upper &lower bounds
tic
for i=1:num_cases
    [inputs,fopt(i)]=ga(@stalagmite,2,[],[],[],[],[0;0],[0.6;0.6])
    xopt(i)=inputs(1);
    yopt(i)=inputs(2);
end

study_time=toc
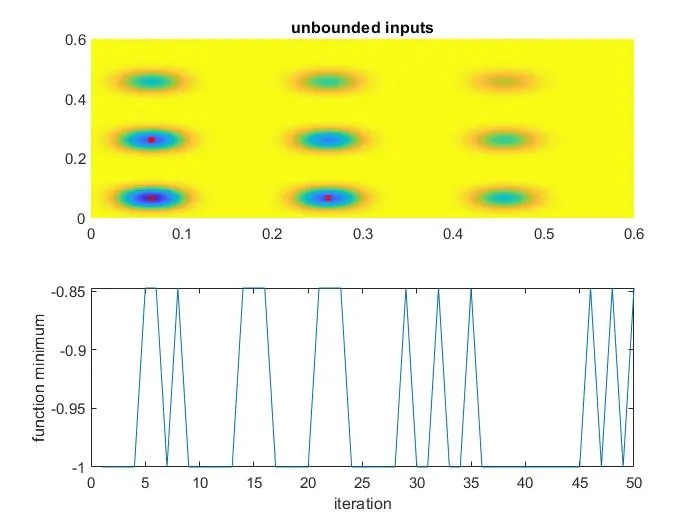
figure(2)
subplot(2,1,1)
hold on
surf(x,y,f)
shading interp
plot3(xopt,yopt,fopt,'Marker','o','markersize',5,'markerfacecolor','r')
title('unbounded inputs')
subplot(2,1,2)
plot(fopt)
xlabel('iteration')
ylabel('function minimum')


%Study 3 increases Ga iterations

options=optimoptions('ga')
options=optimoptions(options,'populationsize',150)
tic
for i=1:num_cases
    [inputs,fopt(i)]=ga(@stalagmite,2,[],[],[],[],[0;0],[0.6;0.6],[],[],options)
    xopt(i)=inputs(1);
    yopt(i)=inputs(2);
end
study_time=toc
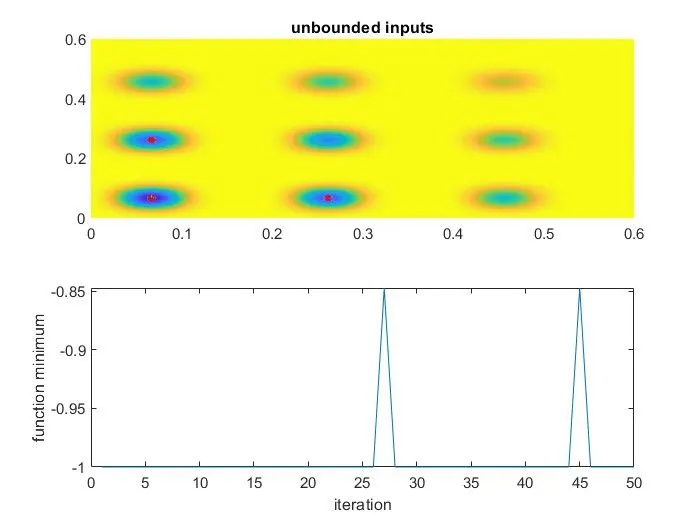
figure(3)
subplot(2,1,1)
hold on
surf(x,y,f)
shading interp
plot3(xopt,yopt,fopt,'Marker','o','markersize',5,'markerfacecolor','r')
title('unbounded inputs')
subplot(2,1,2)
plot(fopt)
xlabel('iteration')
ylabel('function minimum')

%Study 3 increases Ga iterations

options=optimoptions('ga')
options=optimoptions(options,'populationsize',150)
tic
for i=1:num_cases
    [inputs,fopt(i)]=ga(@stalagmite,2,[],[],[],[],[0;0],[0.6;0.6],[],[],options)
    xopt(i)=inputs(1);
    yopt(i)=inputs(2);
end
study_time=toc
figure(3)
subplot(2,1,1)
hold on
surf(x,y,f)
shading interp
plot3(xopt,yopt,fopt,'Marker','o','markersize',5,'markerfacecolor','r')
title('unbounded inputs')
subplot(2,1,2)
plot(fopt)
xlabel('iteration')
ylabel('function minimum')

%Study 3 increases Ga iterations

options=optimoptions('ga')
options=optimoptions(options,'populationsize',150)
tic
for i=1:num_cases
    [inputs,fopt(i)]=ga(@stalagmite,2,[],[],[],[],[0;0],[0.6;0.6],[],[],options)
    xopt(i)=inputs(1);
    yopt(i)=inputs(2);
end
study_time=toc
figure(3)
subplot(2,1,1)
hold on
surf(x,y,f)
shading interp
plot3(xopt,yopt,fopt,'Marker','o','markersize',5,'markerfacecolor','r')
title('unbounded inputs')
subplot(2,1,2)
plot(fopt)
xlabel('iteration')
ylabel('function minimum')