Week 4.1 - Genetic Algorithm
Aim:
To optimise the given stalagmite function and find the global maxima of the function.
Introduction to Stalagmites & Stalactites:
Stalactites are structures formed from mineral deposits that hang from caves. These formations hold tightly to the ceiling and hang down. As opposed to hanging from the ceiling, Stalagmite structures are formed from the cave floor that point upward. Stalagmite and Stalactite functions are mathematical functions that represent shapes similar to that of the stalagmite and stalactite functions.
Introduction to Genetic Algorithm (GA):
The Genetic Algorithm (GA) is an optimization technique used to solve non linear optimization problems. It uses concepts of evolutionary biology (Darwin’s theory of evolution) to find the global minima for optimization a problem. An initial set of solutions is tested against the objective function. Subsequent generations evolve through the processes mentioned below:
The Genetic Algorithm is done in 3 steps:
Selection: A number of individuals are selected from the population in the mating pool. Based on the previously calculated fitness value, the best individuals based on a threshold are selected. After that step, we will end by selecting a subset of the population in the mating pool.
Crossover: Crossover in GA generates a new generation the same as natural mutation. By mutating the old generation parents, the new generation offspring comes by carrying genes from both parents. The amount of genes carried from each parent is random.
Mutation: For each offspring, select some genes and change their value. The mutation prevents the solution from falling into local minima.
Syntax:
x = ga(fun,nvars)
x = ga(fun,nvars) finds a local unconstrained minimum, x, to the objective function, fun. nvars is the number of design variables of function, fun.
Code Explanation:
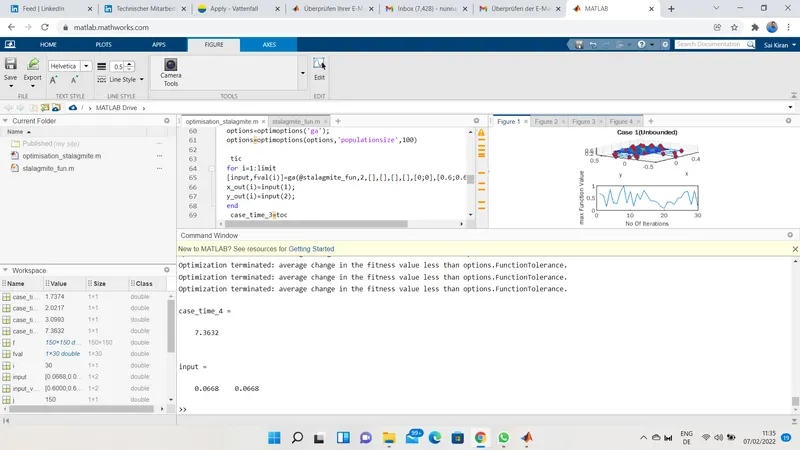
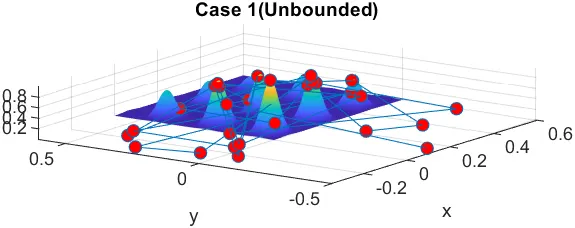
Firstly a random array of x & y values were created and the corresponding 2D array was obtained using the mesh grid function. A nested loop was used to assign values from this array into an array named input_vector. input_vector is the input to the stalagmite function. The stalagmite function is written as separate. Minus (-) sign is given to the output of the stalagmite function so that, after the ga process we get the Global Maxima (Normally ga outputs Global Minima). TicToc commands are used to get the running time of each case. In the first case, the bounds were not defined and the plots were made. The negative sign is given for the f value inside the surface function to get the stalagmite function upwards. Bounding is given in the next case so that the number of solution approaches is more accurately. The population is increased in the subsequent cases and plotting is done. The Global Maxima is found in the last case. The x & y values for which the function has maximum value is also displayed. The iterations were decreased to such a value that the results didn't vary and the program consumed minimum time to execute.
Stopping Criteria:
Generations — The algorithm stops when the number of generations reaches the value of Generations.
Time limit — The algorithm stops after running for an amount of time in seconds equal to the Time limit.
Fitness limit — The algorithm stops when the value of the fitness function for the best point in the current population is less than or equal to the Fitness limit.
Main code:
%Start Of the Program
close all
clear all
clc
x=linspace(0,0.6,150);
y=linspace(0,0.6,150);
limit=30;
%Creating 2D array using meshgrid function
[xx yy]=meshgrid(x,y);
%Nested loop for array value input
for i=1:length(xx)
 for j=1:length(yy)
 input_vector(1)=xx(i,j);
 input_vector(2)=yy(i,j);
 f(i,j)= stalagmite_fun(input_vector);
 end
end
tic
for i=1:limit
[input,fval(i)]=ga(@stalagmite_fun,2);
x_out(i)=input(1);
y_out(i)=input(2);
end
case_time_1=toc
figure(1)
subplot(2,1,1)
surfc(xx,yy,-f)
xlabel('x')
ylabel('y')
title('Case 1(Unbounded)','color','k')
shading interp
hold on;
plot3(x_out,y_out,-fval,'marker','o','markersize',6,'markerfacecolor','r');
subplot(2,1,2)
plot(-fval);
xlabel('No Of Iterations')
ylabel('max Function Value')
 %Case:2 Inserting Bounding Box
 tic
for i=1:limit
[input,fval(i)]=ga(@stalagmite_fun,2,[],[],[],[],[0;0],[0.6;0.6]);
x_out(i)=input(1);
y_out(i)=input(2);
end
case_time_2=toc
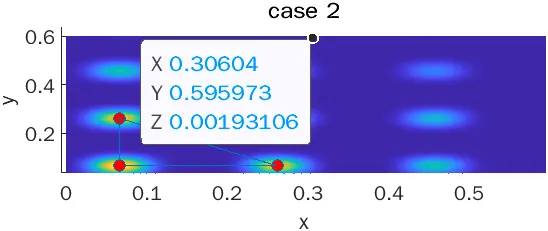
figure(2);
subplot(2,1,1)
hold on;
surfc(xx,yy,-f)
xlabel('x')
ylabel('y')
title('case 2','color','k')
shading interp
plot3(x_out,y_out,-fval,'marker','o','markersize',6,'markerfacecolor','r');
subplot(2,1,2)
plot(-fval)
xlabel('No Of Iterations')
ylabel('max Function Value')
 %Case:3
options=optimoptions('ga');
options=optimoptions(options,'populationsize',100)

 tic
for i=1:limit
[input,fval(i)]=ga(@stalagmite_fun,2,[],[],[],[],[0;0],[0.6;0.6],[],[],options);
x_out(i)=input(1);
y_out(i)=input(2);
end
 case_time_3=toc
figure(3)
subplot(2,1,1)
hold on
surfc(xx,yy,-f)
shading interp
xlabel('x');
ylabel('y');
title('Case 3','color','k')
plot3(x_out,y_out,-fval,'marker','o','markersize',6,'markerfacecolor','r')
subplot(2,1,2)
plot(-fval)
xlabel('No Of Iterations')
ylabel('max Function Value')
 %Case:4
options=optimoptions('ga');
options=optimoptions(options,'populationsize',300)

 tic
for i=1:limit
[input,fval(i)]=ga(@stalagmite_fun,2,[],[],[],[],[0;0],[0.1;0.1],[],[],options);
x_out(i)=input(1);
y_out(i)=input(2);
end
 case_time_4=toc
figure(4)
subplot(2,1,1)
hold on
surfc(xx,yy,-f)
shading interp
xlabel('x');
ylabel('y');
title('Case 4','color','k')
plot3(x_out,y_out,-fval,'marker','o','markersize',6,'markerfacecolor','r')
subplot(2,1,2)
plot(-fval)
xlabel('No Of Iterations')
ylabel('max Function Value')
%Displaying the values of x & y for maximum value of function
display(input)
%End Of Program
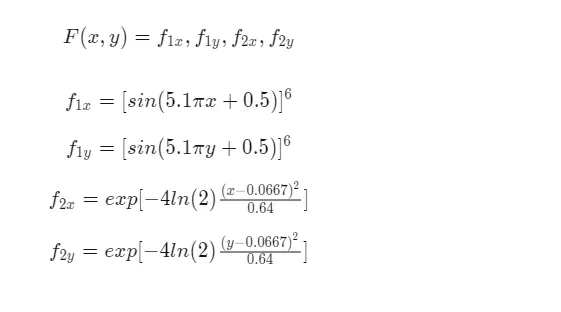
function [f]= stalagmite_fun(input_vector)
f1x= (sin((5.1*pi).*input_vector(1)+0.5)).^6;
f1y= (sin((5.1*pi).*input_vector(2)+0.5)).^6;
f2x= exp((((input_vector(1)-0.0667).^2)/0.64).*(-4*log(2)));
f2y= exp((((input_vector(2)-0.0667).^2)/0.64).*(-4*log(2)));
f1=f1x*f1y*f2x*f2y;
f=-f1;
endResults:
Results can be seen in the google drive attached
https://drive.google.com/drive/folders/14maQBwvPEyt1k3CfefrTIDfOTAEZcJrV?usp=sharing
Value of X and Y