Project 1 - Parsing NASA thermodynamic data
https://drive.google.com/drive/folders/13KAUan4q0OYOiUckhyPSSevTqLrSIj-s?usp=sharing
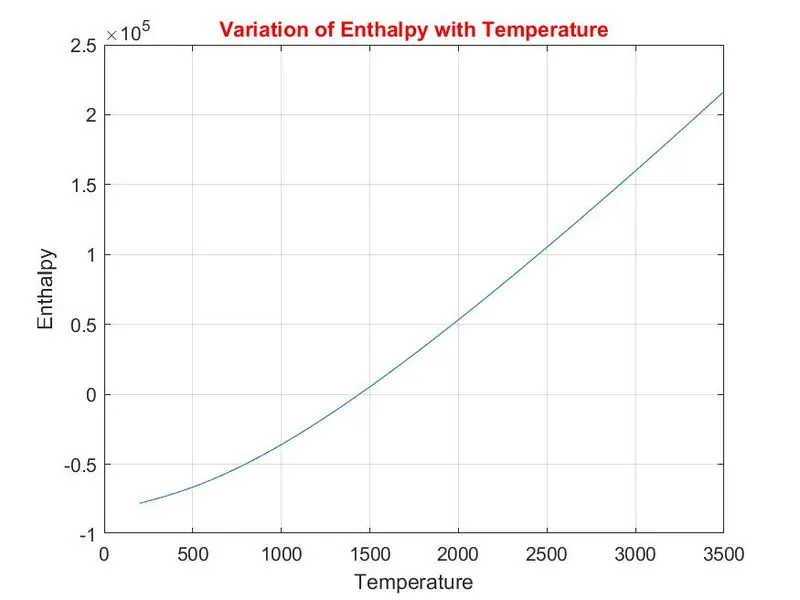
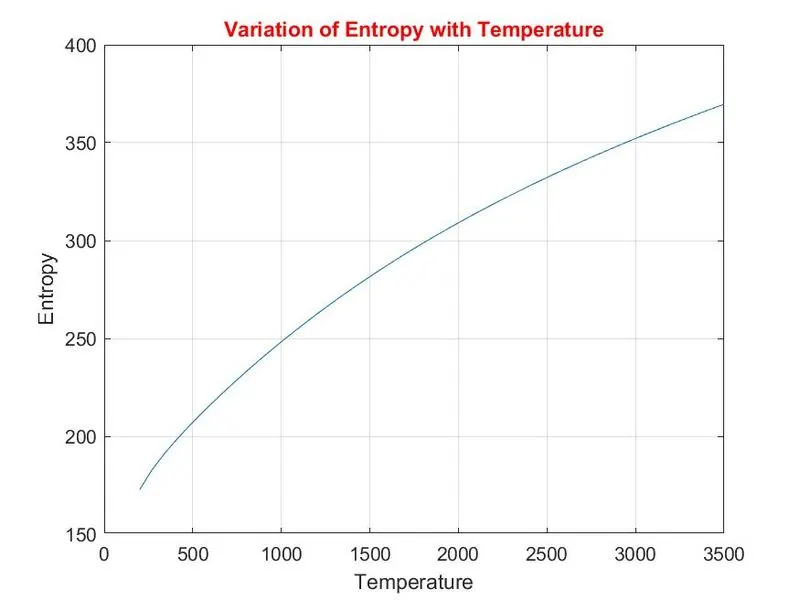
Objective: Writing a MATLAB code to extract essential coefficients from NASA thermodynamic data to calculate the enthalpy, entropy and specific heat for all the species in the data file and plotting the values of enthalpy, entropy and specific heat against the local temperature range. The code also evaluates the molecular mass of the species.
The equations to calculate specific heat, enthalpy and entropy are shown below:
Code Algorithm:
Main Program
(1) First the Thermo.dat file is opened to read using 'fopen' command and is saved in a specific file identifier.
(2) Now the second line is extracted using 'fgetl' command.
(3) This second line is split using 'strsplit' command and then each entry is accessed and converted into a numeric value using the str2num command. It will provide a global temperature range.
(4) Next three lines are skipped, as they are only part of the header, using 'textscan' command.
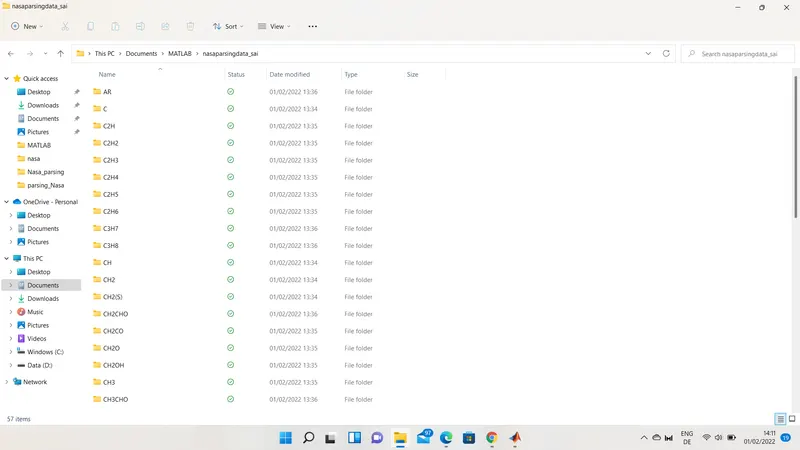
(5) Now we have the data that needs to be operated but before starting, we create a folder using 'mkdir' command at a specific location and name it as new_folder.
(6) Now, we need to extract data from every next four lines till it reaches END. So, we use for loop which will break when it reaches the work 'END'. For this purpose, we use 'strcmpi' command which returns logical 1 when it reaches the word we are seeking and will eventually break the loop.
(7) After entering into the loop, we access lines one by one to collect the data.
(8) The first line will provide the local temperature range in the same way as we have found the global temperature range.
(9) In the second line, we find where the 'E' word appears using 'strfind' command. It helps to find the value of the coefficient. This line has five coefficients written in scientific notation. So, the value of the coefficient will be all values before 'E' and three positions after 'E'. The next coefficient will start from where the first ends.
(10) The value extracted is in string format so we convert it into numeric values using 'str2num' command.
(11) Same logic is used for the next two lines, the only difference is that the fourth lines have only four coefficients, therefore, changes are made accordingly.
(12) Once we have all the coefficients, we can calculate values of specific heat, enthalpy and entropy against various local temperatures. Since the value of all coefficients are different according to the temperature value, the 'if' condition is used.
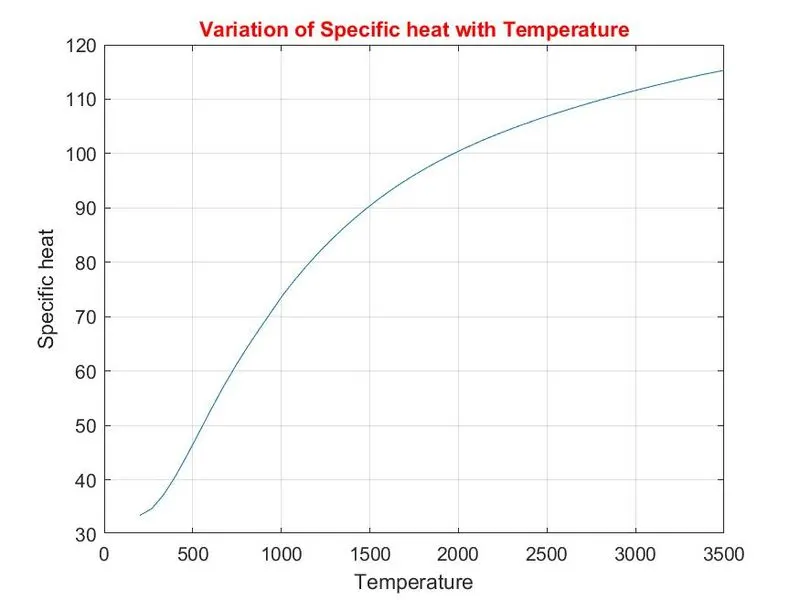
(13) Three figures are created using the 'figure' and 'plot' commands. They are labelled using 'xlabel', 'ylabel' and 'title' commands.
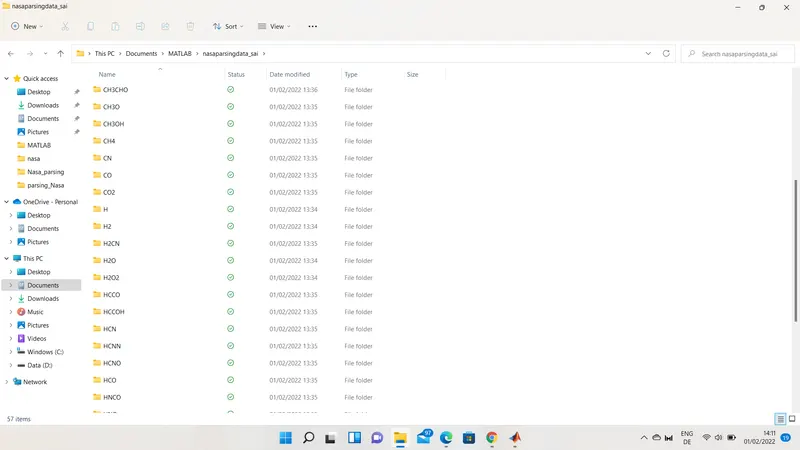
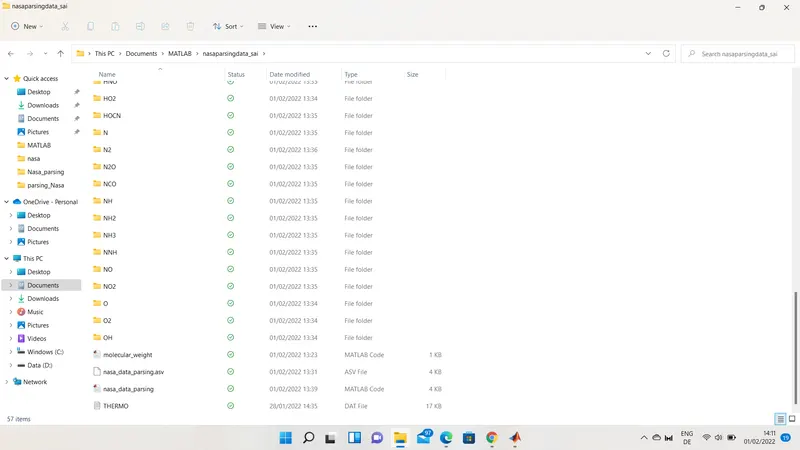
(14) A subfolder in new_folder is created with the name 'component' using 'mkdir' command with giving the location under new_folder and name the subfolder as that of 'component' using 'sprintf' command.
(15) A new subfolder is created each time loop run and their corresponding three figures are dumped into it using 'saveas' command providing the location of subfolder with the name of that component.
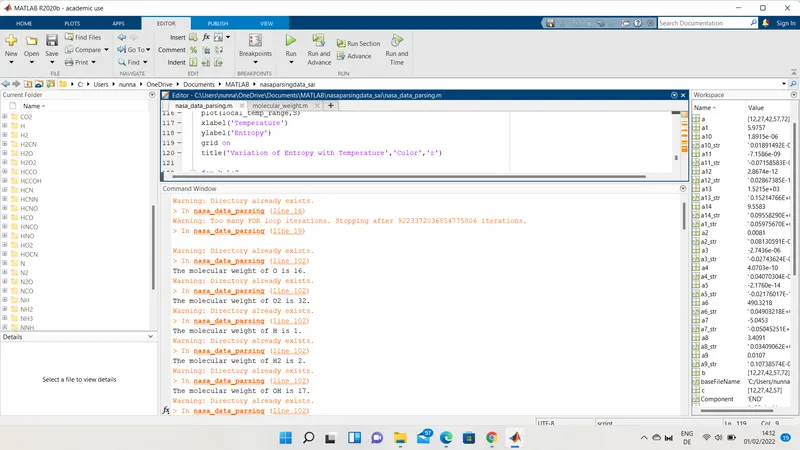
(16) After that molecular weight is calculated by calling the function defined separately and the result is printed in the command window using 'fprinf' command.
Function
(1) Component is taken as input in the function.
(2) After assigning value to each possible element of the component, a string array, namely 'Elements' and molecular weight array, namely 'Weight' of the elements are defined.
(3) 'for' loopis used for every entry of Component is called one by one.
(4) Now we use one more for loop to check that entry agrees with any element. For that, we use 'strcmpi' command and put conditions using 'if-elseif' Command. The position where it matches is also the position of corresponding molecular mass in the Weight array. Thus, it is added to the molecular weight.
(5) If the entry is 'A', it does not make sense alone so using 'strcat' command next entry of 'component' is added. Its position is then found using 'strfind' command and at that particular location corresponding molecular weight is taken from the Weight array.
(6) When the next entry comes in first for the loop, it would be 'R' which has already been used so we directly break the loop then.
(7) If the entry doesn't match with any of the given conditions, it directly comes out of the second loop.
(8) Now the entry to the component is converted into numeric data using 'str2num'. To check if it is a number, a condition is used as if it is greater than 1. If it returns true, many times we need to add the molecular weight of the preceding element to the total molecular weight of the component. Since it has already been added one time when the element is encountered in the second for loop, we multiply it one less time.
Results:
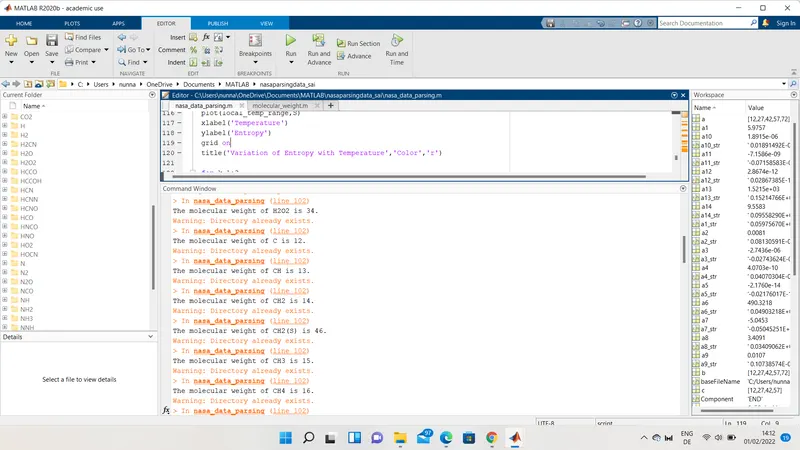
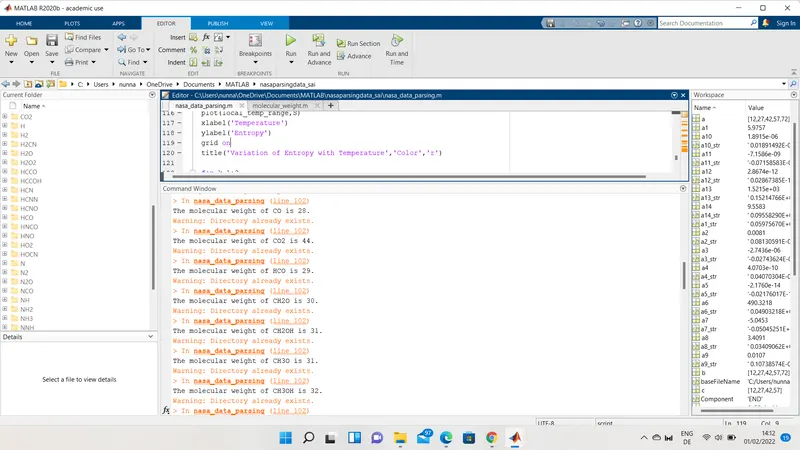
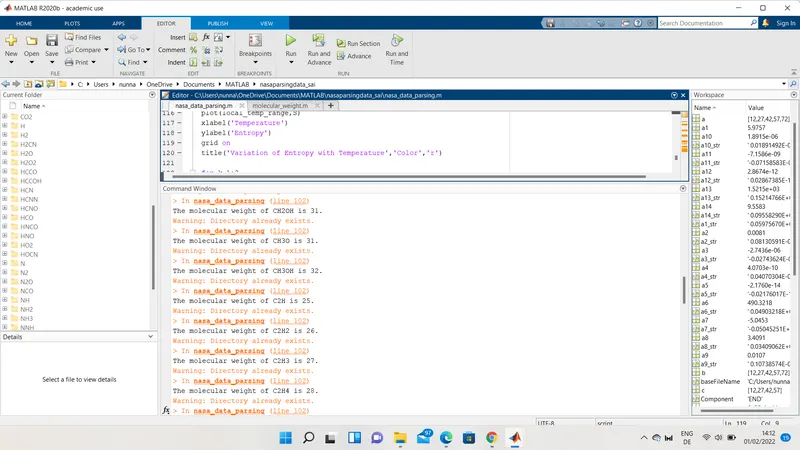
The results can be found in the google drive link attached to this file. Warnings are shown in the output windows, since I have added a grid after executing the program.
%Molecular weight function

function y = molecular_weight(Component)
[O, H, C, S, N, AR] = deal(16,1,12,32,14,39.948);
Elements = ['O' 'H' 'C' 'S' 'N' 'AR'];
Weight = [O H C S N AR];
mole_wgt = 0;
for i = 1:length(Component)
 for j = 1 : length(Elements)
 td = strcmpi(Component(i),Elements(j));
 tf = strcmpi(Component(i),'A');
 tn = strcmpi(Component(i),'R');
 if td == 1
 mole_wgt = mole_wgt + Weight(j);
 position = j;
 elseif tf == 1
 p = strcat(Component(i), Component(i+1));
 q = strfind(Elements, p);
 mole_wgt = mole_wgt + Weight(q);
 position = q;
 break
 elseif tn == 1
 break
 end
 end

 m = str2num(Component(i));
 if m > 1
 mole_wgt = mole_wgt+Weight(position)*(m-1);
 end
end
y = mole_wgt;
end
%Main code
clear all
close all
clc
R = 8.314; % Value of Universal gas conatant in J/mol-K
f1 = fopen('THERMO.dat','r');
% Reading header to extract the value of Global temperature
t_1 = fgetl(f1);
t_2 = fgetl(f1);
global_temp = strsplit(t_2, ' ');
global_temp_low = str2num(global_temp{2});
global_temp_medium = str2num(global_temp{3});
global_temp_high = str2num(global_temp{4});
% Leaving next three lines as they are part of header
header = textscan(f1,'%s',1,'delimiter','\n','headerlines',2);
% Before start we create a folder at desired location
mkdir 'C:\Users\nunna\OneDrive\Documents\MATLAB\nasaparsingdata_sai'
% Now we can access data to be operated
s1 = 'END';
for i =1:Inf
% extracting first line of data information
tline_1str = fgetl(f1);
tline_1 = strsplit(tline_1str, ' ');
Component = tline_1{1};
tf = strcmpi(s1,Component);
if tf == 1
break
end
low_temp = str2num(tline_1{end-3});
medium_temp = str2num(tline_1{end-1});
high_temp = str2num(tline_1{end-2});
% Extracting Coefficients
tline_2str = fgetl(f1);
% Coefficient is extracted as string
a = strfind(tline_2str,'E');
a1_str = tline_2str(1:a(1)+3);
a2_str = tline_2str(a(1)+4:a(2)+3);
a3_str = tline_2str(a(2)+4:a(3)+3);
a4_str = tline_2str(a(3)+4:a(4)+3);
a5_str = tline_2str(a(4)+4:a(5)+3);
% Saving coefficient as number
a1 = str2num(a1_str);
a2 = str2num(a2_str);
a3 = str2num(a3_str);
a4 = str2num(a4_str);
a5 = str2num(a5_str);
% Similar proceedure for next line
tline_3str = fgetl(f1);
b = strfind(tline_3str,'E');
% Coefficient extracted as a string
a6_str = tline_3str(1:b(1)+3);
a7_str = tline_3str(b(1)+4:b(2)+3);
a8_str = tline_3str(b(2)+4:b(3)+3);
a9_str = tline_3str(b(3)+4:b(4)+3);
a10_str = tline_3str(b(4)+4:b(5)+3);
% Saving coefficient as number
a6 = str2num(a6_str);
a7 = str2num(a7_str);
a8 = str2num(a8_str);
a9 = str2num(a9_str);
a10 = str2num(a10_str);
% for next line we have only four coefficients
tline_4str = fgetl(f1);
c = findstr(tline_4str,'E');
% Coefficient is extracted as string
a11_str = tline_4str(1:c(1)+3);
a12_str = tline_4str(c(1)+4:c(2)+3);
a13_str = tline_4str(c(2)+4:c(3)+3);
a14_str = tline_4str(c(3)+4:c(4)+3);
% Saving coefficient as number
a11 = str2num(a11_str);
a12 = str2num(a12_str);
a13 = str2num(a13_str);
a14 = str2num(a14_str);
% Calculating cp, H and S
local_temp_range = linspace(low_temp, high_temp,50);
for i = 1:length(local_temp_range)
T = local_temp_range(i);
if T>1000
cp(i) = R*(a1+a2*T+a3*(T^2)+a4*(T^3)+a5*(T^4));
H(i) = (R*T)*(a1 + (a2*T)/2 + (a3*T^2)/3 + (a4*T^3)/4 + (a5*T^4)/5 + a6/T);
S(i) = R*(a1*log(T) + a2*T + (a3*T^2)/2 + (a4*T^3)/3 + (a5*T^4)/4 + a7);
elseif T<=1000
cp(i) = R*(a8+a9*T+a10*(T^2)+a11*(T^3)+a12*(T^4));
H(i) = (R*T)*(a8 + (a9*T)/2 + (a10*T^2)/3 + (a11*T^3)/4 + (a12*T^4)/5 + a13/T);
S(i) = R*(a8*log(T) + a9*T + (a10*T^2)/2 + (a11*T^3)/3 + (a12*T^4)/4 + a14);
end
end
% Making a subfolder
mkdir (sprintf('C:/Users/nunna/OneDrive/Documents/MATLAB/nasaparsingdata_sai/%s',Component))
figure(1);
plot(local_temp_range,cp)
xlabel('Temperature')
ylabel('Specific heat')
grid on
title('Variation of Specific heat with Temperature','Color','r')
figure(2);
plot(local_temp_range,H)
xlabel('Temperature')
ylabel('Enthalpy')
grid on
title('Variation of Enthalpy with Temperature','Color','r')
figure(3);
plot(local_temp_range,S)
xlabel('Temperature')
ylabel('Entropy')
grid on
title('Variation of Entropy with Temperature','Color','r')
for k=1:3
% Specify some particular, specific folder:
baseFileName = sprintf('C:/Users/nunna/OneDrive/Documents/MATLAB/nasaparsingdata_sai/%s/figure_%d.jpg',Component,k);
% figure(k); % Activate the figure again.
saveas(figure(k),baseFileName);
end
% Calculating Molecular Weight
mole_weight = molecular_weight(Component);
fprintf('The molecular weight of %s is %d.\n',Component, mole_weight)
end