Week 4.1 - Genetic Algorithm
Aim: To use the Genetic Algorithm funtion in Matlab to evaluate and determine the optim values of X and Y in a population
Method: Using Matlab built-in function ga(fun,vars) and limiting the function valuation generation using MaxGenerations and MaxStallGenerations options. Ref Note: Increasing MaxGenerations can improve the final result. The related MaxStallGenerations option controls the number of steps ga looks over to see whether it is making progress. Increasing MaxStallGenerations can enable ga to continue when the algorithm needs more function evaluations to find a better solution.
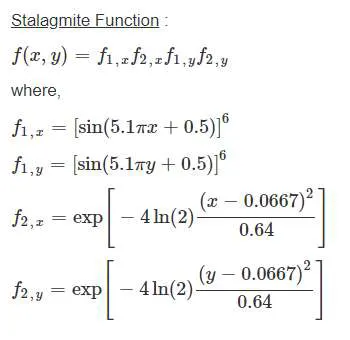
MaxGenerations — The algorithm stops when the number of generations reaches MaxGenerations preset in the code- MaxStallGenerations — The algorithm stops when the average relative change in the fitness function value over MaxStallGenerations is less than Function tolerance.
Matlab code:
Function definition for Stalagmite
function [f] = stalagmite(input_vector)
	x = input_vector(1);
y = input_vector(2);
f1_x = (sin(5.1*pi*x + 0.5)).^6;
f1_y = (sin(5.1*pi*y + 0.5)).^6;
t1 = ((x-0.0667).^2)/(0.64); f2_x = exp(-4.*log(2)*t1);
t2 = ((y-0.0667).^2)/(0.64); f2_y = exp(-4.*log(2)*t2);
f = -(f1_x.*f2_x.*f1_y.*f2_y);
end
Main program:
close all
clear all
clc


%meshgrid data formation
x=linspace(0,0.6,250);
y=linspace(0,0.6,250);
limit=25;
[xx yy]=meshgrid(x,y);

for i=1:length(xx)
 for j=1:length(yy)
 mesh(1)=xx(i,j);
mesh(2)=yy(i,j);
 f(i,j)= stalagmite(mesh);
 end
end
Creating the surface plot of stalagmite function:
for i=1:limit
[input,mark(i)]=ga(@stalagmite,2);
x_out(i)=input(1);
y_out(i)=input(2);
end

figure(1)
subplot(2,1,1)
surfc(xx,yy,-f)
xlabel('x')
ylabel('y')

shading interp
hold on;
plot3(x_out,y_out,-mark,'marker','o','markersize',5,'MarkerFaceColor','r');
subplot(2,1,2)
plot(-mark);
xlabel('No Of iterations')
ylabel('Max function value')
title('Case I (Unbounded)','color','k')
Case 2: Bounded with iteration limit to Maxstallgeneration @100 and Maxgeneration @300
options=optimoptions('ga');
options = optimoptions(options,'MaxStallGenerations',100,'MaxGenerations',300);

for i=1:limit
[input,mark(i)]=ga(@stalagmite,2,[],[],[],[],[0;0],[0.6;0.6]);
x_out(i)=input(1);
y_out(i)=input(2);
end

figure(2);
subplot(2,1,1)
hold on;
surfc(xx,yy,-f)
xlabel('x')
ylabel('y')
title('Case II - Maxstallgeneration @100 and Maxgeneration @300','color','k')
shading interp
plot3(x_out,y_out,-mark,'Marker','o','MarkerFaceColor','r','Markersize',5);
subplot(2,1,2)
plot(-mark)
xlabel('No Of iterations')
ylabel('Max function value')
display(input)
Case 3: Bounded with iteration limit to Maxstallgeneration @300 and Maxgeneration @700
options=optimoptions('ga');
options = optimoptions(options,'MaxStallGenerations',300,'MaxGenerations',700);

for i=1:limit
[input,mark(i)]=ga(@stalagmite,2,[],[],[],[],[0;0],[0.6;0.6],[],[],options);
x_out(i)=input(1);
y_out(i)=input(2);
end

figure(3)
subplot(2,1,1)
hold on
surfc(xx,yy,-f)
shading interp
xlabel('x');
ylabel('y');
title('Case III - Maxstallgeneration @300 and Maxgeneration @700','color','k')
plot3(x_out,y_out,-mark,'Marker','o','MarkerFaceColor','r','Markersize',5)
subplot(2,1,2)
plot(-mark)
xlabel('No Of iterations')
ylabel('Max function value')
display(input)
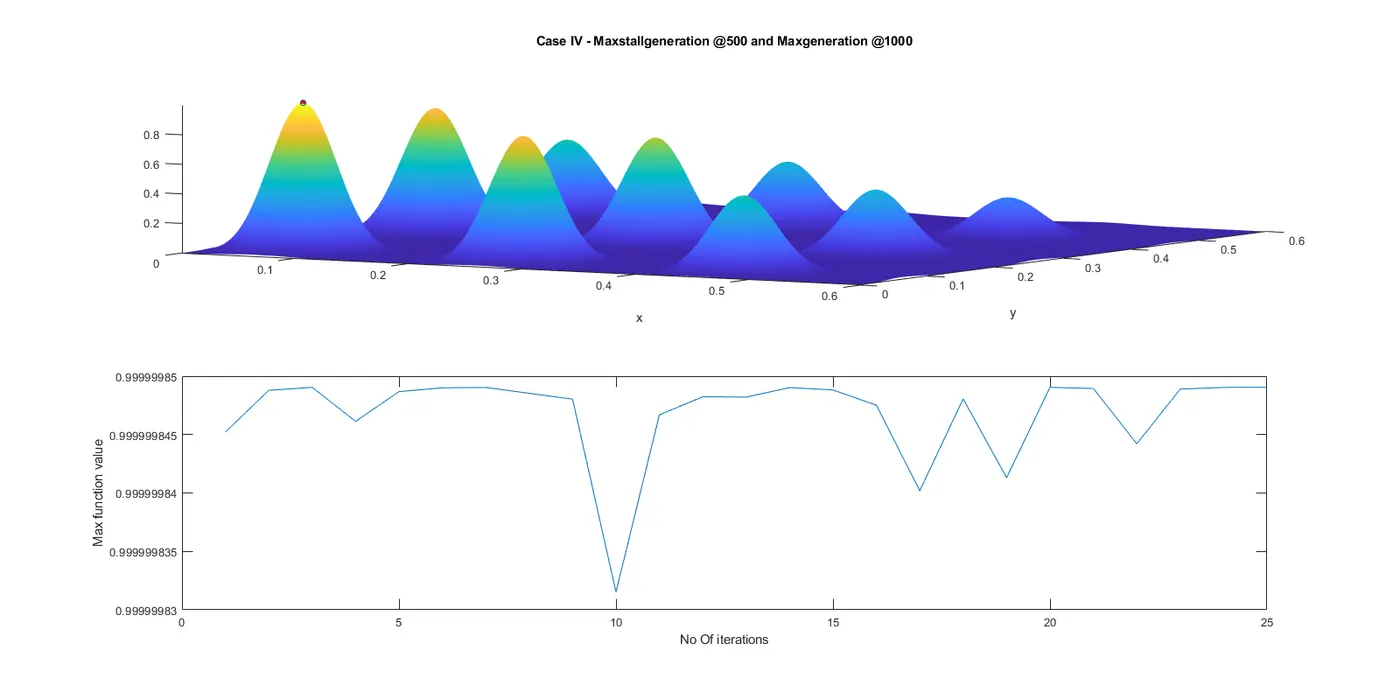
Case:4 - Bounded with iteration limit to Maxstallgeneration @500 and Maxgeneration @1000
options=optimoptions('ga');
options = optimoptions(options,'MaxStallGenerations',500,'MaxGenerations',1000);

for i=1:limit
[input,mark(i)]=ga(@stalagmite,2,[],[],[],[],[0;0],[0.1;0.1],[],[],options);
x_out(i)=input(1);
y_out(i)=input(2);
end

figure(4)
subplot(2,1,1)
hold on
surfc(xx,yy,-f)
shading interp
xlabel('x');
ylabel('y');
title('Case IV- Maxstallgeneration @500 and Maxgeneration @1000','color','k')
plot3(x_out,y_out,-mark,'Marker','o','MarkerFaceColor','r','markersize',5)
subplot(2,1,2)
plot(-mark)
xlabel('No Of iterations')
ylabel('Max function value')

%Maximum value of function
display(input)Output:
Case 2
Optimization terminated: average change in the fitness value less than options.FunctionTolerance.
Optimization terminated: average change in the fitness value less than options.FunctionTolerance.
Optimization terminated: maximum number of generations exceeded.
input =
0.0668 0.0669
Case 3
Optimization terminated: average change in the fitness value less than options.FunctionTolerance.
Optimization terminated: average change in the fitness value less than options.FunctionTolerance.
Optimization terminated: average change in the fitness value less than options.FunctionTolerance.
input =
0.0668 0.0668
Case 4
Optimization terminated: average change in the fitness value less than options.FunctionTolerance.
Optimization terminated: average change in the fitness value less than options.FunctionTolerance.
input =
0.0668 0.0668
Figure 1
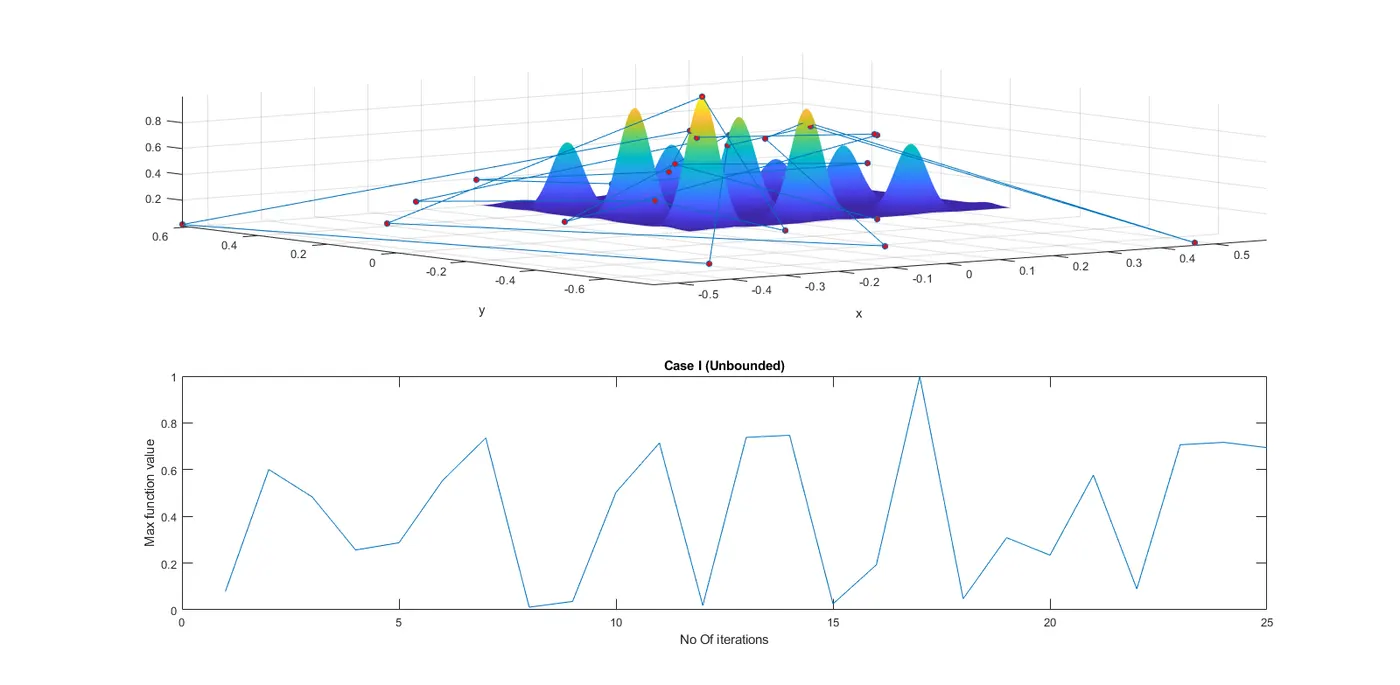
Figure 2
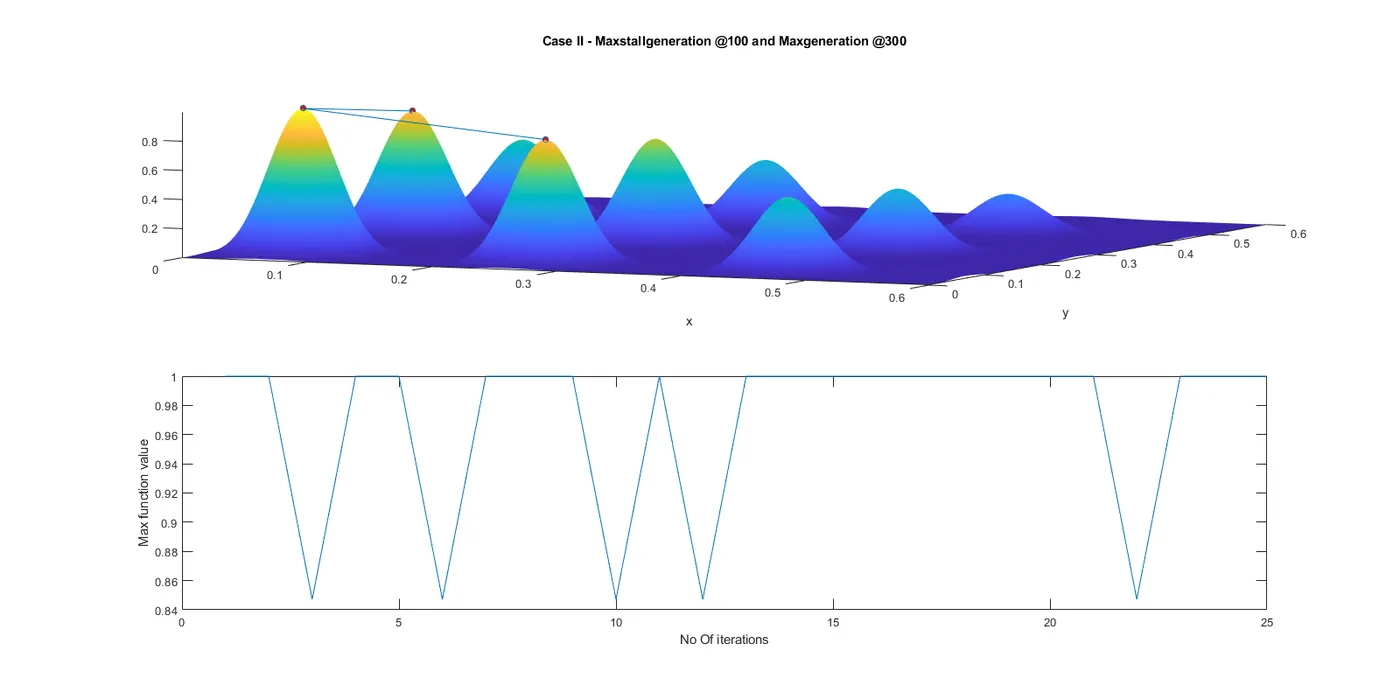
Figure 3
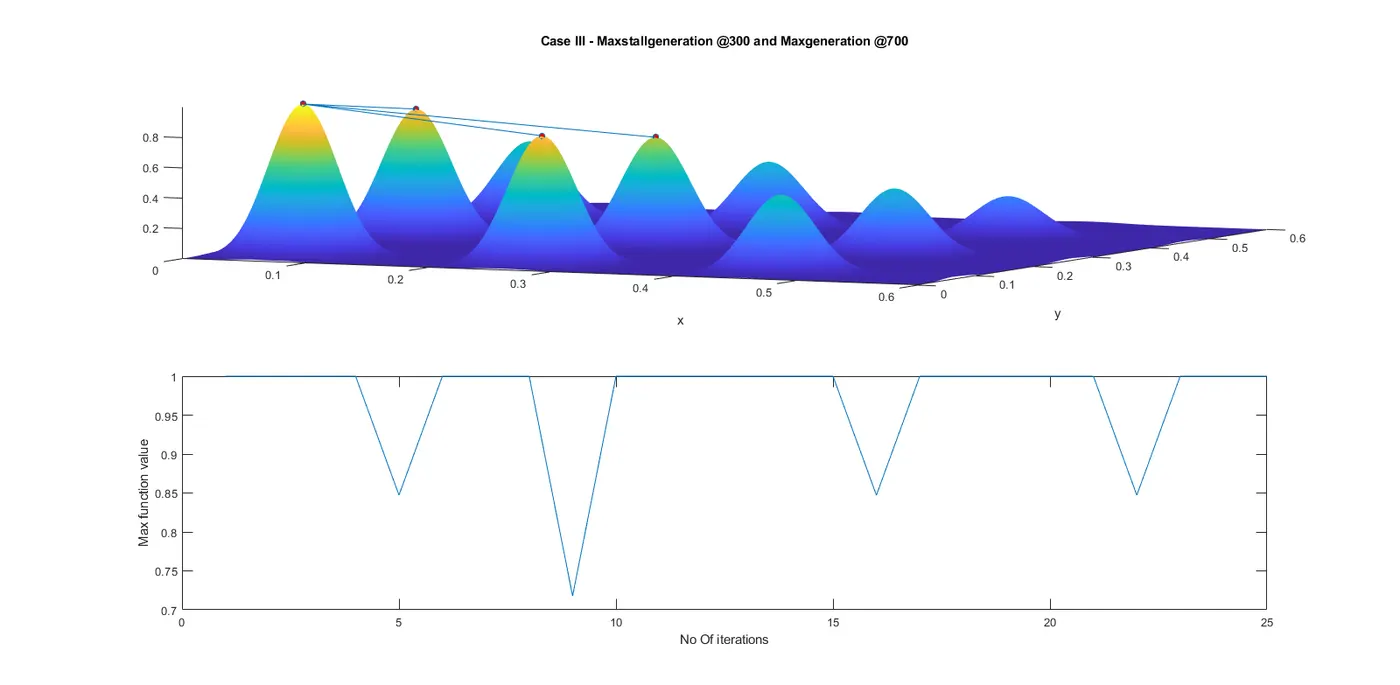
Figure 4
References:
- https://in.mathworks.com/help/gads/how-the-genetic-algorithm-works.html#f6243
- https://in.mathworks.com/help/gads/setting-the-maximum-number-of-generations.html