Project 1 - Parsing NASA thermodynamic data
AIM:- To parse the NASA thermodynamic data file and calculate thermodynamic properties of various gas species using Matlab.
Method:
- Extract the 14 co-efficients and calculates the enthalpy, entropy and specific heats for all the species in the data file using functions.
- Calculate the molecular weight of each species and plot Cp, Enthalpy and Entropy for the local temperature range (low temperature : high temperature) specific for each species.
Input:
NASA Thermodynamic File:-
NASA thermodynamics file which is THERMO.dat file in which there are temperature range and 53 species are given in these data and each species contains 14
coefficients and temperature ranges and we have to parse these 14 coefficients to find Specific heat, Entropy and Enthalpy using formula as:-
where,
R = Universal Gas constant
T = Temperature
Cp = Specific heat (KJ)
S = Entropy(KJ/mol-K)
H = Enthalpy(KJ/mol)
a(i) = Coefficients where, i = 1 to 14
- Specific Heat:-
Cp = R*(a1 + (a2*T) + (a3*(T).^2) + (a4*(T).^3) + (a5*(T).^4)) - Entropy:-
S = R*(a1.*log(T) + (a2*T) + ((a3*(T).^2)/2) + ((a4*(T).^3)/3) + ((a5*(T).^4)/4) + a7) - Enthalpy:-
H = R*T.*(a1 + ((a2*T)/2) + ((a3*(T).^2)/3) + ((a4*(T).^3)/4) + ((a5*(T).^4)/5) + ((a6./T)))
Matlab code:
Funtions:
Specific heat
% Specific heat calculation
function Cp = Specificheat(a1,a2,a3,a4,a5,a8,a9,a10,a11,a12,Temp,R,g_medium_temp)
if Temp <= g_medium_temp
Cp = R*(a8 + (a9*Temp) + (a10*(Temp).^2) + (a11*(Temp).^3) + (a12*(Temp).^4));
else
Cp = R*(a1 + (a2*Temp) + (a3*(Temp).^2) + (a4*(Temp).^3) + (a5*(Temp).^4));
end
Entropy calculation:
% Entropy Calculation
function S = Entropy_calc(a1,a2,a3,a4,a5,a7,a8,a9,a10,a11,a12,a14,Temp,R,g_medium_temp)

 if Temp <= g_medium_temp
 S = R.*(a8.*log(Temp) + (a9.*Temp) + (a10*((Temp).^2)/2) + (a11*((Temp).^3)/3) + (a12*((Temp).^4)/4) + a14);
 else

 S = R.*(a1.*log(Temp) + (a2.*Temp) + (a3*((Temp).^2)/2) + (a4*((Temp).^3)/3) + (a5*((Temp).^4)/4) + a7);
end
Enthalpy calculation:
% Enthalpy Calculation
function H = Enthalpy(a1,a2,a3,a4,a5,a6,a8,a9,a10,a11,a12,a13,Temp,R,g_medium_temp)

 if Temp <= g_medium_temp
 H = R*Temp.*(a8 + ((a9*Temp)/2) + ((a10*(Temp).^2)/3) + ((a11*(Temp).^3)/4) + ((a12*(Temp).^4)/5) + ((a13./Temp)));
 else

 H = R*Temp.*(a1 + ((a2*Temp)/2) + ((a3*(Temp).^2)/3) + ((a4*(Temp).^3)/4) + ((a5*(Temp).^4)/5) + ((a6./Temp)));

end
Molecular weight calculation:
% Molecular Weight Calculation
function Molecularweight = Molecular_weight(speciesSP)

 atomic_name = ['H','C','O','N','A'];

 fprintf('Molecular Weight of ');
 fprintf(speciesSP);
 fprintf(' : ');

 Atomic_Weight = [1.008 12.011 15.999 14.007 39.948];
 Molecularweight = 0;

 for i = 1:length(speciesSP)
 for j = 1:length(atomic_name)
 if strcmpi(speciesSP(i),atomic_name(j))
 Molecularweight = Molecularweight +Atomic_Weight(j);
 position = j;
 end
 end
 n = str2num(speciesSP(i));

 if n>1

 Molecularweight = Molecularweight + Atomic_Weight(position)*(n-1);

 end
 end
 fprintf('molecular weight %s :',speciesSP);
 fprintf('%d',Molecularweight);
 disp(' ');
end
Main program:
clear all
close all
clc

% Make directory and read file
mkdir 'D:NASA File Parsing'
f1=fopen('THERMO.dat','r')
gt=fgetl(f1);
g_temp=fgetl(f1);
t=strsplit(g_temp);

% Converting string cells to numbers using str2num,
g_low_temp=str2num(t{2});
g_medium_temp=str2num(t{3});
g_high_temp=str2num(t{4});

Temp=linspace(g_low_temp,g_high_temp,1000);
% Universal Gas Constant J/(mol-K)
 R = 8.314;

% skipping three comment lines in the file
for i = 1:3
 gt=fgetl(f1);
end
 for i = 1:53
gt=fgetl(f1);
A=strsplit(gt,' ');
speciesSP=(A{1})
l1=fgetl(f1) ;
a=strfind(l1,'E');
% temperature coefficients and first 7 coefficients: high temperature coefficients
a1=l1(1:a(1)+3);
a1=str2num(a1); %1
a2=l1(a(1)+4:a(2)+3);
a2=str2num(a2) ; %2
a3=l1(a(2)+4:a(3)+3);
a3=str2num(a3) ; %3
a4=l1(a(3)+4:a(4)+3);
a4=str2num(a4); %4
a5=l1(a(4)+4:a(5)+3);
a5=str2num(a5) ; %5
l2=fgetl(f1);
b=strfind(l1,'E');;
a6=l2(1:b(1)+3);
a6=str2num(a6) ; %6
a7=l2(a(1)+4:b(2)+3);
a7=str2num(a7); %7

% second 7 coefficients - LOW-temperature coefficients
a8=l2(b(2)+4:b(3)+3);
a8=str2num(a8); %8
a9=l2(b(3)+4:b(4)+3);
a9=str2num(a9) ; %9
a10=l2(b(4)+4:b(5)+3);
a10=str2num(a10) ; %10
l3=fgetl(f1);
c=strfind(l1,'E');
a11=l3(1:c(1)+3);
a11=str2num(a11); %11
a12=l3(c(1)+4:c(2)+3);
a12=str2num(a12); %12
a13=l3(c(2)+4:c(3)+3);
a13=str2num(a13); %13
a14=l3(c(3)+4:c(4)+3);
a14=str2num(a14); %14

% Specific heat calculation
Cp = Specificheat(a1,a2,a3,a4,a5,a8,a9,a10,a11,a12,Temp,R,g_medium_temp);

 % Enthalpy calculation
 H = Enthalpy(a1,a2,a3,a4,a5,a6,a8,a9,a10,a11,a12,a13,Temp,R,g_medium_temp);

 % Entropy calculation
 S = Entropy_calc(a1,a2,a3,a4,a5,a7,a8,a9,a10,a11,a12,a14,Temp,R,g_medium_temp);

 % Calculating molecular weight of species
 Molecularweight(i) = Molecular_weight(speciesSP);

 % Read & Write Molecular list
 Molecular_list = fopen('Molecular weight.txt','a+');
 fprintf( Molecular_list,'Molecular weight of %s is %d n',speciesSP,Molecularweight);
 fclose(Molecular_list);

 % plotting(CP,H,S,Temp,speciesSP)
 % Saving as a folder
 cur_dir=pwd;
 mkdir(speciesSP);
 cd(speciesSP);

 % Plot 1, Specific heat (CP) vs Temperature Range (Temp)
 figure(1)
 plot(Temp,Cp,'linewidth',2,'color','r');
 xlabel('Temperature [K]');
 ylabel('Specific Heat [kJ]');
 title(sprintf('Varying Specific Heat with Temperature Range of %s',speciesSP));
 grid on
 saveas(figure(1),'Specific Heat.jpg');

 % Plot 2, Enthalpy (H) vs Temperature Range (Temp)
 figure(2)
 plot(Temp,H,'linewidth',2,'color','g');
 xlabel('Temperature [K]');
 ylabel('Enthalpy in [kJ/(mol)]');
 title(sprintf('Varying Enthalpy with Temperature Range of %s',speciesSP));
 grid on
 saveas(figure(2),'Ethalpy.jpg');

 % Plot 3, Entropy (S) vs Temperature Range (Temp)
 figure(3)
 plot(Temp,S,'linewidth',2,'color','b');
 xlabel('Temperature [K]');
 ylabel('Entropy in [kJ/(mol-K)]');
 title(sprintf('Varying Entropy with Temperature Range of %s',speciesSP));
 grid on
 saveas(figure(3),'Entropy.jpg');
 cd(cur_dir);
 % Molecular weight

 M = Molecular_weight(speciesSP)
 f2 = fopen('molecular mass','w');
 fprintf('%s n %s n %f n','species','Molecular mass',M)
 fclose(f2)
end
Folder with species names and plots:

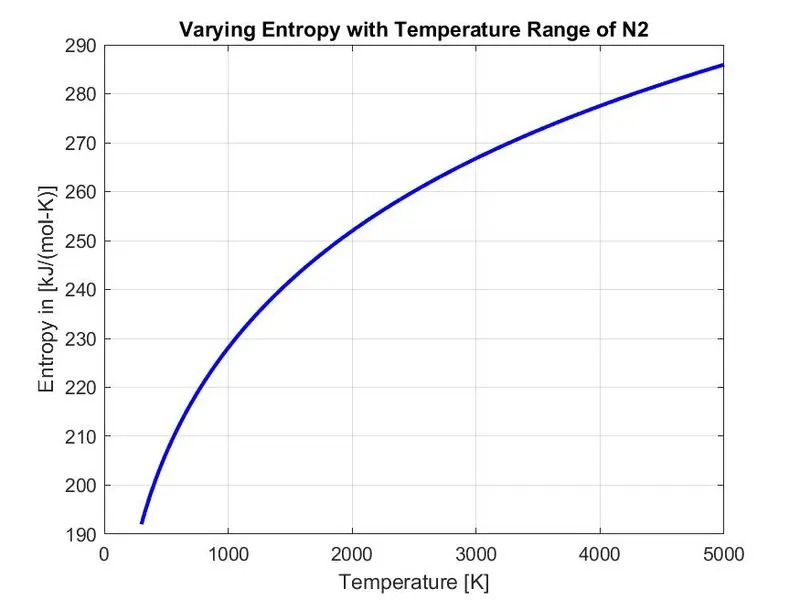
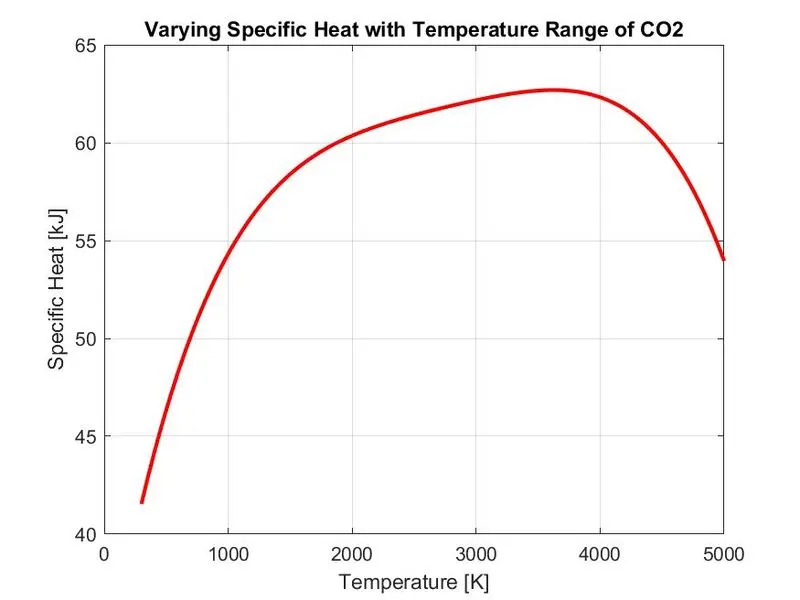
Plots for O₂, N₂ and CO₂
Oxygen, O₂
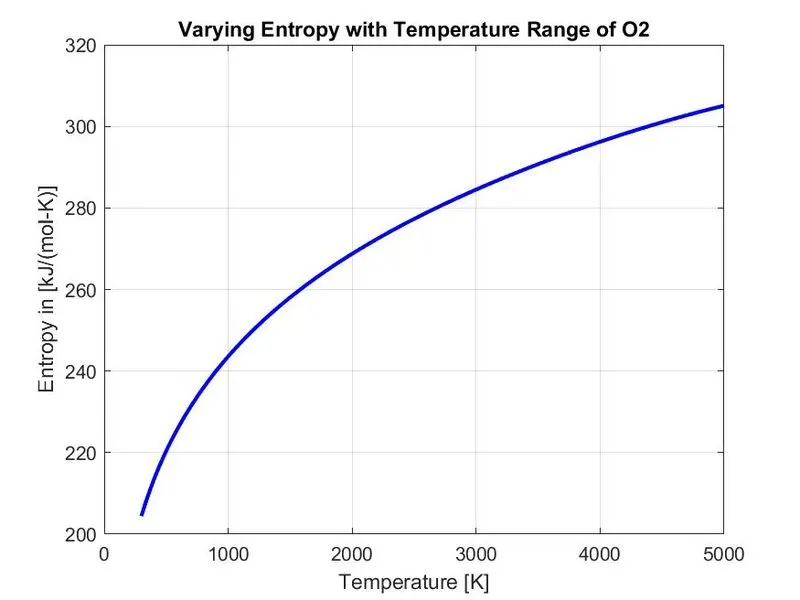
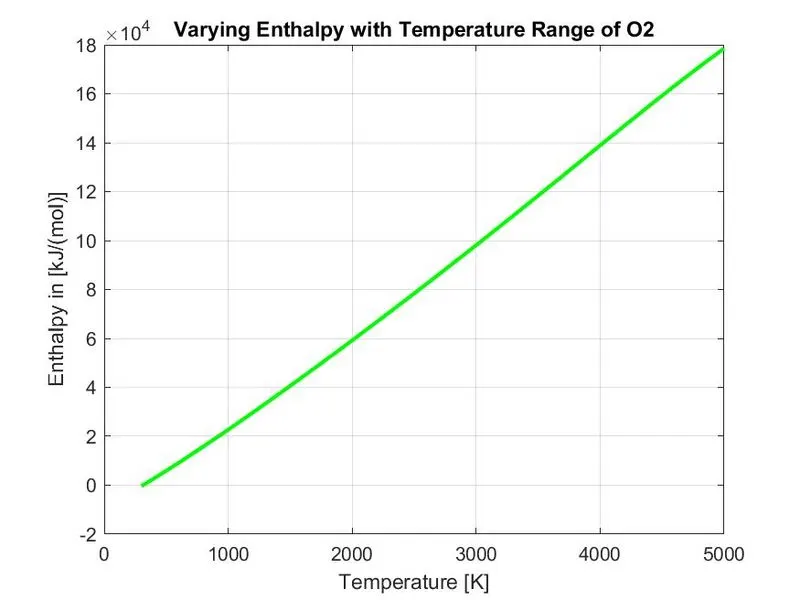
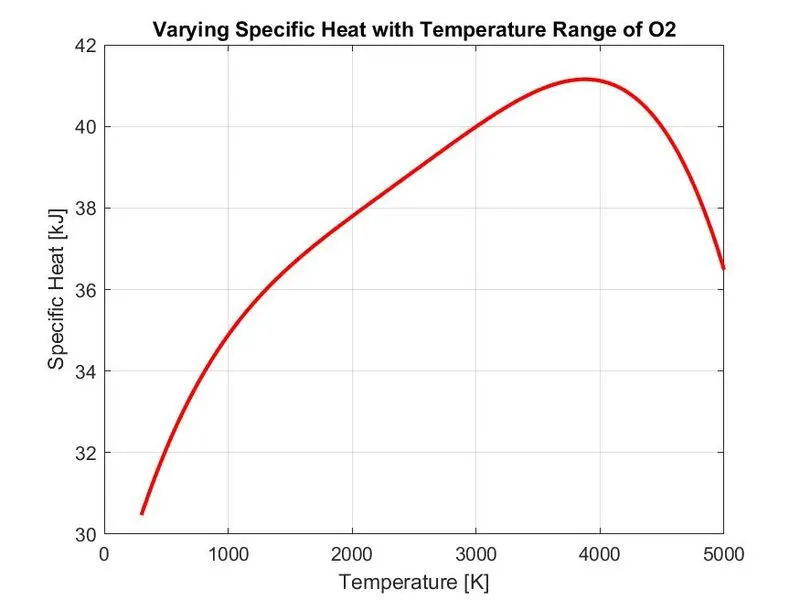
N₂
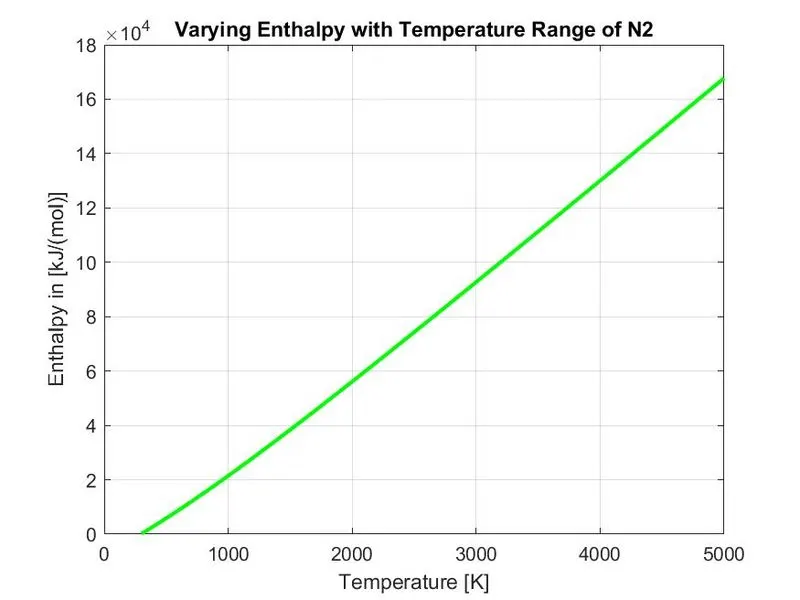
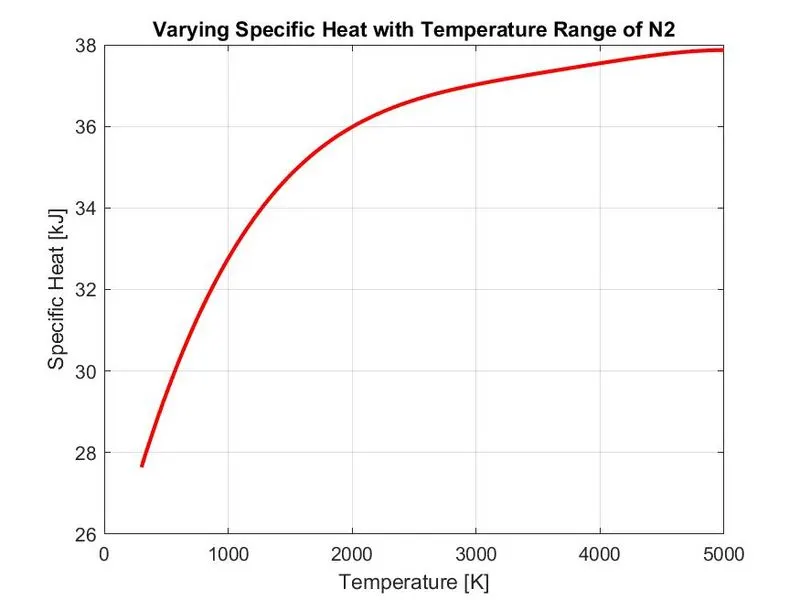
CO₂
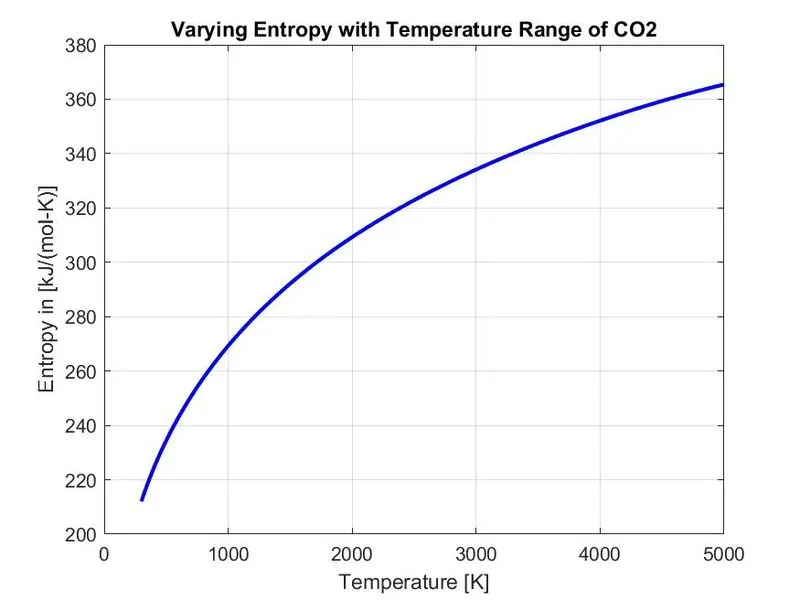
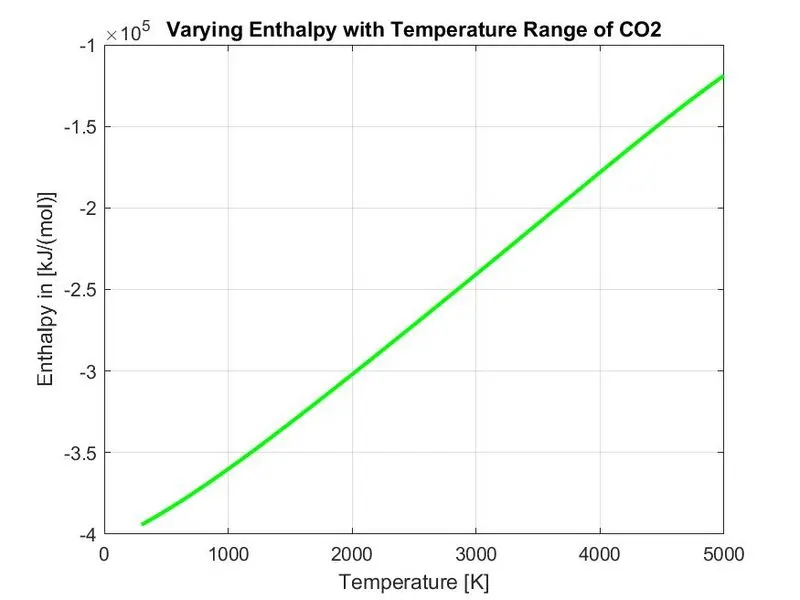
Conclusion:
File parsing is an effective way to read unformated data and can save time to calculate values using these data in an organized manner. The above example is a great example of how parsing can simplify complex data sources by simple Matlab codes.
Refrence Matlab source materials:-
https://www.mathworks.com/matlabcentral/answers/317006-create-new-folders-by-mkdir
https://www.mathworks.com/matlabcentral/answers/17580-how-to-define-a-path-in-saveas-command
https://www.mathworks.com/matlabcentral/answers/106320-make-a-loop-to-calculate-molecular-weight