Week 4.1 - Genetic Algorithm
AIM: Write a code in MATLAB to optimise the stalagmite function and find the global maxima of the function.Clearly expalin the concept of genetic algorithm Plot graphs for all 3 studies and for F maximum vs no. of iterations. Title and axes labels are a must, legends could be shown if necessary.
STALUGMITE MAINFUNCTION: To write the mainfunction of stalugmite by using the formula as shown.
`f(x,y) = f_1,_xf_2,_xf_1,_yf_2,_y`
`f_1,_x=[sin(5.1pix+0.5)]^6` `f_1,_y=[sin(5.1piy+0.5)]^6`
`f_2,_x=exp[-4ln(2)frac{(x-0.0667)^2}{0.64}]``
`f_2,_y=exp[-4ln(2)frac{(y-0.0667)^2}{0.64}]`
CODE1:
%Stalagmite function for GA

function sol = stagfun(input_vector)
x = input_vector(1);
y = input_vector(2);
fxone = (sin(((5.1*pi).*x)+0.5)).^6;
fxtwo = exp((((x-0.0667).^2).*(-4*log(2)))./0.64);
fyone = (sin(((5.1*pi).*y)+0.5)).^6;
fytwo = exp((((y-0.0667).^2).*(-4*log(2)))./0.64);
sol = -((fxone)*(fxtwo)*(fyone)*(fytwo));
end
CODE2:
clear all
close all
clc

%defining our search space

x = linspace(0,0.6,150);
y = linspace(0,0.6,150);
n_cases = 50;
%creating a 2Dimensional mesh
 [xx,yy] = meshgrid(x,y);


%evaluating a stalugmite function
for i = 1:length(xx)
    for j = 1:length(yy)
        input_vector(1) = xx(i,j);
        input_vector(2) = yy(i,j);
        f(i,j) = stagfun(input_vector);
    end
end
 shading interp


%Case 1: Statistical behaviour of Genetic Algorithm
tic
for k = 1:n_cases
    [Inputs_vector, Fopt(k)] = ga(@stagfun,2);
     xopt(k) = Inputs_vector(1);
     yopt(k) = Inputs_vector(2);
end

Fopt = -Fopt;
f = -f;
Time_Study1 = toc
figure(1)
subplot(2,1,1)
hold on
surfc(x,y,f)
shading interp
plot3(xopt,yopt,Fopt,'color','b','Marker','o','markersize',5,'markerfacecolor','r');
title('Unbounded Inputs');
subplot(2,1,2)
plot(Fopt,'color','b','linewidth',1)
xlabel('Iterations');
ylabel('Function Maximum');

%Case2: Statistical behaviour of Genetic Algorithm with Upper and Lower Bounds

tic
for k = 1:n_cases
 [Inputs_vector2, Fopt2(k)] = ga(@stagfun,2,[],[],[],[],[0;0],[1;1]);
     xopt2(k) = Inputs_vector2(1);
     yopt2(k) = Inputs_vector2(2);
end

Fopt2 = -Fopt2;
Time_Study2 = toc
figure(2)
subplot(2,1,1)
hold on
surfc(x,y,f)
shading interp
plot3(xopt2,yopt2,Fopt2,'color','b','Marker','o','markersize',5,'markerfacecolor','r');
title('Unbounded Inputs');
subplot(2,1,2)
plot(Fopt2,'color','b','linewidth',1)
xlabel('Iterations');
ylabel('Function Maximum');

%Case3: Statistical behaviour of GA by increasing the number of iterations.

options = optimoptions('ga');
options = optimoptions(options, 'PopulationSize',200);
tic
for k = 1:n_cases
 [Inputs_vector3, Fopt3(k)] = ga(@stagfun,2,[],[],[],[],[0;0],[1;1],[],[],options);
     xopt3(k) = Inputs_vector3(1);
     yopt3(k) = Inputs_vector3(2);
end

Fopt3 = -Fopt3;
Time_Study3 = toc
figure(3)
subplot(2,1,1)
hold on
surfc(x,y,f)
shading interp
plot3(xopt3,yopt3,Fopt3,'color','b','Marker','o','markersize',5,'markerfacecolor','r');
title('Unbounded Inputs');
subplot(2,1,2)
plot(Fopt3,'color','b','linewidth',1)
xlabel('Iterations');
ylabel('Function Maximum');
rng('default');
STEPWISE EXPLANATION OF CODE:
1.To write a main function to define a code. the mainfunction is write by using farmula and devide the formula to stepwise to write the code and multiply the steps and run the code.
2.The code is started with cammands clear all, close all, clc and to store data in variable x,y values of [0,0.6,150] by using linspace cammand.and input of n_cases is 50 it is used to shown like a 50 itretions.
3.The variable x,yof 1d is to canvert as 2d by using [xx,yy]by using mesh_grod cammand.
4.inthis code we are using two for loops to evaluating the stalugmite function first loop to store the iof xxand second loop to store length of yy and varible of input vectors 1and2 and using main function.
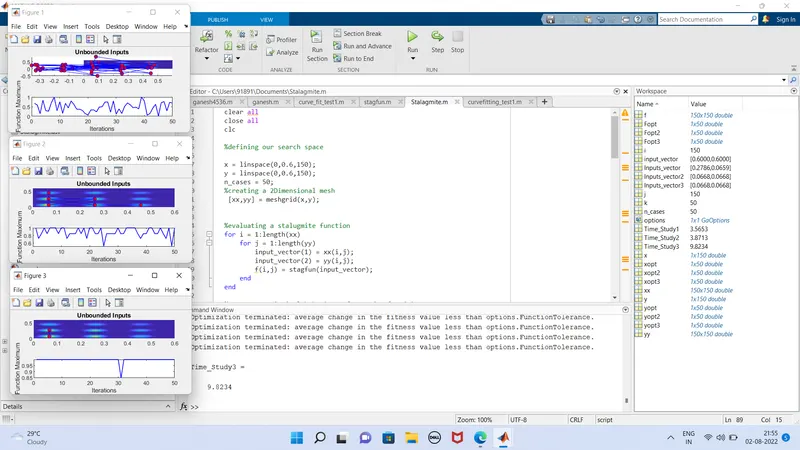
FIGRE1:
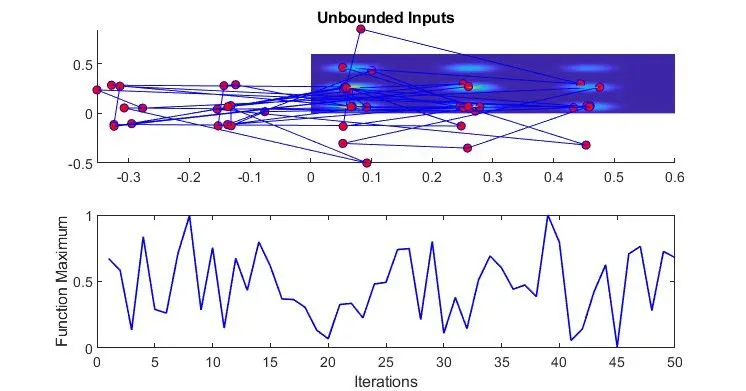
FIG2:
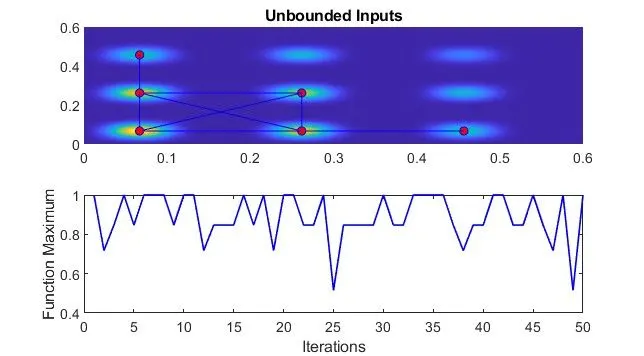
FIG3:
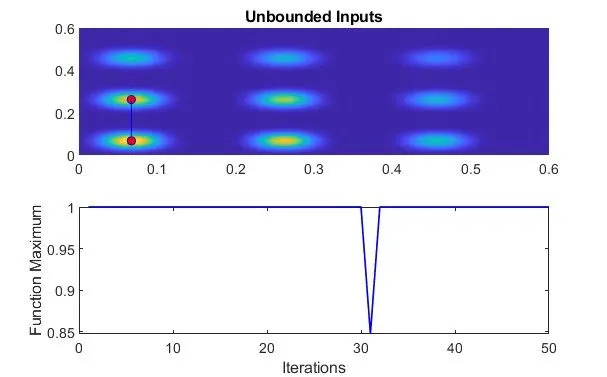
RESULT:
the stalagmite function and find the global maxima of the function.Clearly expalin the concept of genetic algorithm Plot graphs for all 3 studies and for F maximum vs no. of iterations.is done by using MATLAB