Week 3 - Solving second order ODEs
%ODE pendulum position plot

clear all
close all
clc

%Inputs
g = 9.81;   %m/s^2
l = 1;      %m
b = 0.05;
m = 1;      %kg

%Initial conditions of the pendulum | displacement=0 and velocity = 3 rad/s
theta_0 = [0;3];

%Time period is between 0 to 20 sec
t_span = linspace(0,20,600);

%solving ODE
[t,result] = ode45(@(t,theta) ode_fun(g,l,b,m,t,theta), t_span, theta_0);


%Pendulum Animation


ct=1;
for i = 1:length(result(:,1))


    %the end points of the string
    x0 =0;
    y0=0;
    x1=l*sin(result(i,1));
    y1=-l*cos(result(i,1));

    %plotting the values of result in graph format
    subplot(6,4,[1,2,3,4,5,])

    plot(t,result(:,1),'color','r')
    hold on
    plot(t,result(:,2),'color','b')

    %plotting bob displacement on the curve for the given instantaneous time.
    plot(t(i),result(i,1),'marker','o','markerfacecolor','m')
    grid on
    xlabel('Time(sec)')
    ylabel('Plots')
    legend('displacement','angular velocity')
    hold off


    %the animation of the pendulum from the given values
     subplot(6,4,[13,14,15,17,18,19,20,21,22,23,24])


    plot([x0,x1],[y0,y1],'linewidth',2,'color','r')
    hold on
    plot([-0.5,0.5],[0,0],'linewidth',5,'color','black')

    plot (x1,y1,'marker','o','markersize',10,'markerfacecolor','m')
    hold off
    axis([-1.5 1.5 -1.5 0.5])
    grid on
    pause(0.028)
    A(ct)=getframe(gcf);

    ct=ct+1;

end

%making gif/movie

movie(A)
videofile = VideoWriter('pendulum_anime.avi','uncompressed avi');
open(videofile)
writeVideo(videofile,A)
close(videofile)
%defining the ODE equation in the function
%the given differential equation was simplified to be a first order
%differential equation and the equation is defined in this function
function [dtheta_dt] = ode_fun(g,l,b,m,t,theta)
theta1 = theta(1);
theta2 = theta(2);
dtheta1_dt = theta2;
dtheta2_dt = -(b/m)*dtheta1_dt-(g/l)*sin(theta1);
dtheta_dt = [dtheta1_dt; dtheta2_dt];
endThe output of the code and the created animation of the pendulum can be accessed throught the following link:
Code explaination:
Initially the given differential equation was converted in the first order equation for simplicity and the equation was defined in the function 'ode_fun'. The ode45 solver in the MATLAB needs this defined function in it's syntax, thus it is necessary to define the equation properly without an error.
The input values were assigned to the input variables and the initial conditions (displacement and angular velocity) were defined. 600 values from the timespan of 0 to 20 seconds were taken using the linspace command to create an array of time values.
'ode45' solver was used to solve the differential equation and to acquire the corresponding displacement values and angular velocity for a given instant of time in the variable 'results'.The 'ode_fun' function was called in the ode45 solver as per its syntax. The 'result' had 2 columns, one for displament values and other for angular velocity values; for the corresponding time values.
As the values were acquired in the variable 'result', plot command was used to get two curves, one was displacement vs time, other was angular velocity vs time. In the code, 'result(:,1)' implies that 1st column (displacement) values are to be taken; 'result(:,2)' implies that 2nd column (angular velocity) values are to be taken while plotting. The point value of diosplacement with respect to time was plot using a 'o' marker to visualise the bob displacement in real time on the curve. The plots were merged using 'hold on' command.
The end points of the strings were defined using the counter and the for loop. Fixed end point of the string was given the co-ordinates (0,0) and the moving end was given (x1,y1) coordinates. The end point co-ordinates were defined as the sin and cos function of the displacement values respectively.
Counter and 'for loop' was used with the counter varying as per the time values defined by the 'linspace' command.
'Subplot' was used to merge the figures of the plotted curves and the plotted pendulum positions.
The images were captured in the variable 'A' using getframe and the movie was made using the captured images. 'movie(A)','videofile' command was used to name and define the movie. The 'writeVideo' command was used to feed the captured frames and create a frame by frame animation.
Errors faced while coding:
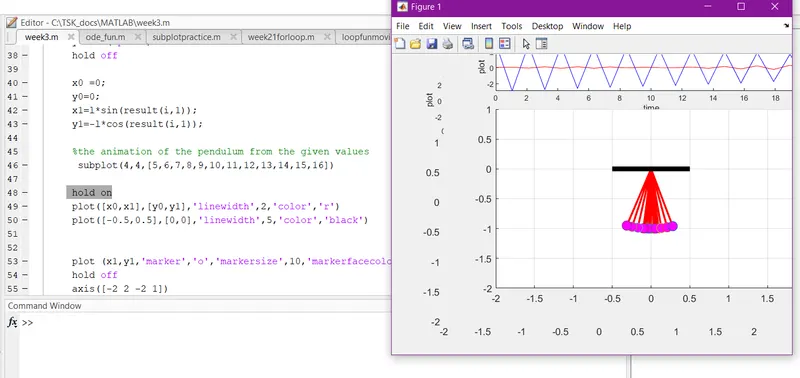
1) The 'hold on' command was used before the plot commands were used. Thus, when the counter restarts the 'for loop', the previous plots were saved in the next plots as well. The error was solved by adding 'hold off' at the end of the plot command and shifting the 'hold on' command after the first plot.
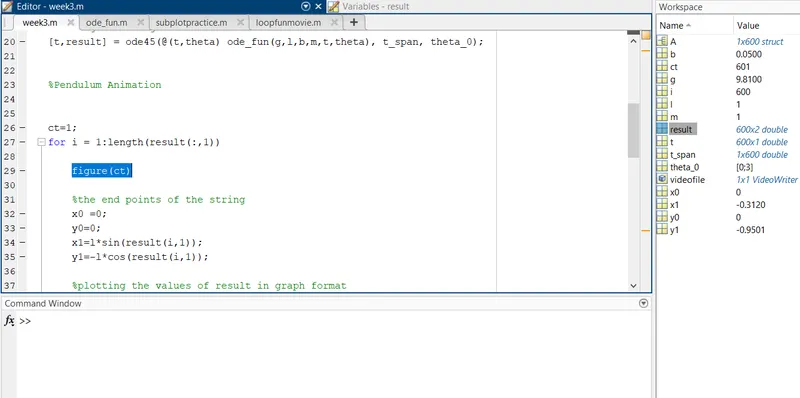
2)While capturing the different positions of the pendulum positions in the variable 'A' using 'getframe' command and counter; an unnecessary comand 'figure(ct)' was used. This command created individual figures for all the 600 time values which led to the excessive program run time and sometimes crashing of the software. It became known that the 'figure' command is not necessary for creating the movie as the 'getframe' command directly saves the plot in the assigned variable. The error was solved after deleting the 'figure' command and thus the code was running faster and more efficient for hight values of 'time'.