Week 3 - Solving second order ODEs
Objective:
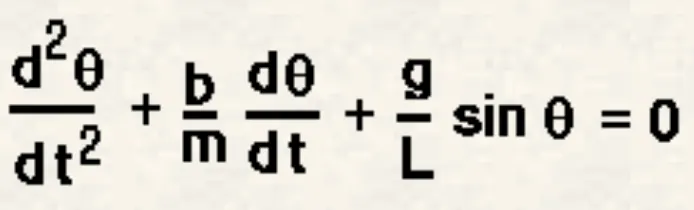
To write a program that solves the ODE. ODE represents the equation of motion of a simple pendulum with damping phenomenon.
Python code:
The explanation of the code is given in the code iteself.
# -*- coding: utf-8 -*-
"""
Created on Sun Jul 18 12:47:25 2021

@author: JAGGU
"""

"""
Simple pendulum Projects

"""

import numpy as np
from scipy.integrate import odeint
import matplotlib.pyplot as plt
import math
import os

def model(theta,t,b,g,l,m):
    theta1=theta[0]
    theta2=theta[1]
    dtheta1_dt=theta2
    dtheta2_dt=-(b/m)*theta2-(g/l)*math.sin(theta1)
    dtheta_dt=[dtheta1_dt,dtheta2_dt]
    return dtheta_dt


#look for current working Directory
cwd=os.getcwd()
new_dir=os.path.join(cwd,r'pendulumn')

# create new folder in the working directory
if not os.path.exists(new_dir):
   os.makedirs(new_dir)


b=0.008 #damping coefficeint
g=9.81 #accelaration due to gravity m/s2

l=1.8 #length of pendulum in m
m=0.1  #mass in kg

# intial condition
theta_0=[0,2]

# time points
t=np.linspace(0,40,300) #assumed time till 40s

#solve ODE
sol=odeint(model,theta_0,t,args=(b,g,l,m))

plt.figure()
"Solution for first ODe"
plt.plot(t,sol[:,0],'b-',label =r'$\frac{d\theta_1}{dt}=\theta_2$')


"solution for second ODE"

plt.plot(t,sol[:,1],'r--',label=r'$\frac{d\theta_2}{dt}=-\frac{b}{m}\theta_2-\frac{g}{l}sin\theta_1$')

plt.ylabel('plot')
plt.xlabel('time')
plt.legend(loc='best')
filename_1="pendulumn_ode.png"
#plt.show()
#save image for the graph
plt.savefig(filename_1)


sol_new=sol[:,0]

ct=1


#change working directory or open the folder where the image is to be saved
os.chdir(new_dir)


print(os.getcwd())


#looping to save points and image for motion of pendulum
for i in sol_new:
    # calculates the postion of point
    x=l*math.sin(i)
    y=-l*math.cos(i)

    filename="image_"+str(ct)+".png"
    ct=ct+1
    plt.figure()
    x1=[0,x]
    y1=[0,y]
    plt.plot(x1,y1,marker='o',markersize=20)
    plt.xlim(-2,2)
    plt.ylim(-2,0)
    plt.savefig(filename)

os.chdir(cwd)
print(os.getcwd())
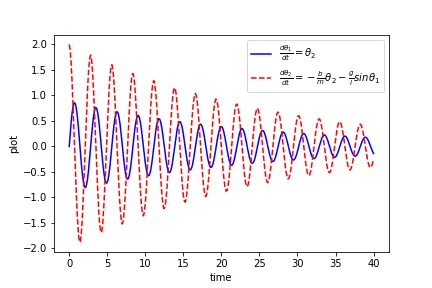
The image for the assumed value of length, mass and damping coefficient is plotted and show in the above figure.
Error faced while saving image:
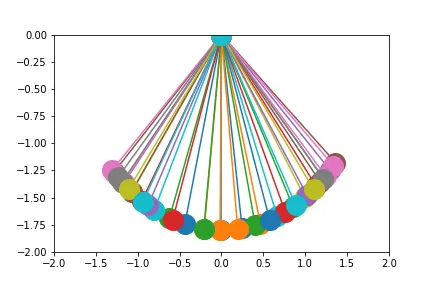
The image was ploteed in the single figure as did not open new figure So, rectified using plt.figure() for every loop.
The error in writing the image is as shown below:
The link for the animation is given below:
The animation was developed using ffmpeg command. If