Week 3 - Solving second order ODEs
Aim : To Simulate the Transient Movement of a simple pendulum and create an animation video of the pendulum motion using Matlab.
Google Drive Link for Code and Video: https://drive.google.com/drive/folders/1KZ5BCt0fv_hbbTscJHoTJDSyBrN2Pb4l?usp=sharing
% Main Code

close all
clear all
clc

%Inputs
b = 0.05;
l=1;
m=1;
g=9.81;

%Initial conditions
theta0 = [0;4];

t_span = linspace(0,20,200);

%Function_Call
[t,result] = ode45(@(t,theta) Ode_Function(b,g,l,m,t,theta), t_span, theta0);
In this main code we give initial inputs defining the Harmonic coefficient, length, mass and gravity
We split the t_span into 200 parts from 0 to 20
we call a function named Ode_Function which is written in another file
%Function

function [dtheta_dt] = Ode_Function(b,g,l,m,t,theta)
theta1 = theta(1);
theta2 = theta(2);
dtheta1_dt = theta2;
dtheta2_dt = -(b/m) * theta2 - (g/l)*sin(theta1);
dtheta_dt = [dtheta1_dt; dtheta2_dt];
end
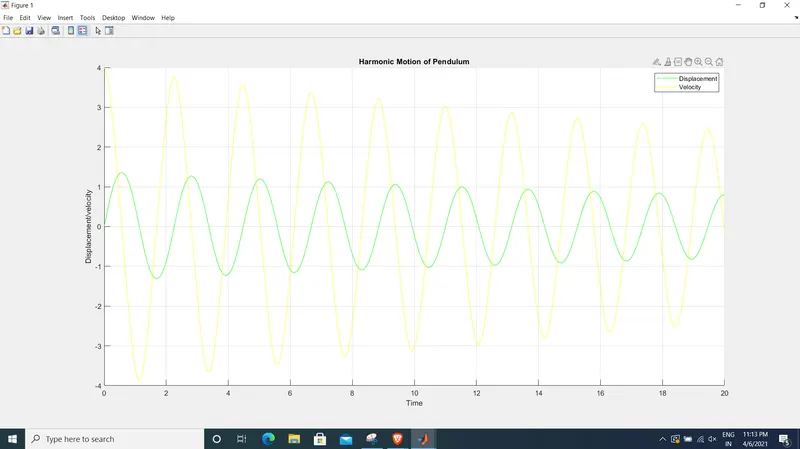
In this we get the plot for displacement, velocity and time which can be used to get a plot graph.
%Plot
figure(1)
hold on
plot(t, result(:,1), 'color', 'g');
plot(t,result(:,2), 'color' , 'y');

title('Harmonic Motion of Pendulum')
xlabel('Time')
ylabel('Displacement/velocity')
legend('Displacement', 'Velocity')

grid on

hold off
In this code we are plotting the graph by providing Title, Xlabel, Ylabel and Legend along with grid. Hold on is used to hold all the coordinates in a single plot.
%Conversion of Frames to Animation
ct = 1;

for i =1:length(t)

    x0 = 0;
    y0 = 0;

    x1 = 1*sin(result(i,1));
    y1 = 1*cos(result(i,1));


    figure(2)

    plot([-2 2] , [0 0], 'linewidth', 3, 'color', 'r');

    line([x0 x1], [y0 y1], 'linewidth' ,4);

    axis([-2 2 -2 2])

    hold on
    plot(x1, y1, 'o', 'markers' ,20, 'markercolor', 'g');
    hold off

    grid on
    pause(0.03);

    M(ct) = getframe(gcf);

    ct = ct+1;

end
In this we are collecting all the plot graphs into a single file which creates an animation overtime. The command getframe(gcf) is used to cummulate al the frames into an animation.
% Creation of Animation File

movie(M)
videofile = VideoWriter('Pendulum_animation.avi' , 'uncompressed avi');
open (videofile)
writeVideo(videofile, M)
close(videofile)
In this section we are creating an animation file in our desired path by giving it File Name and Format. After executing the file we can see the video file on the current path.
Graph Output:
Erros Faced:
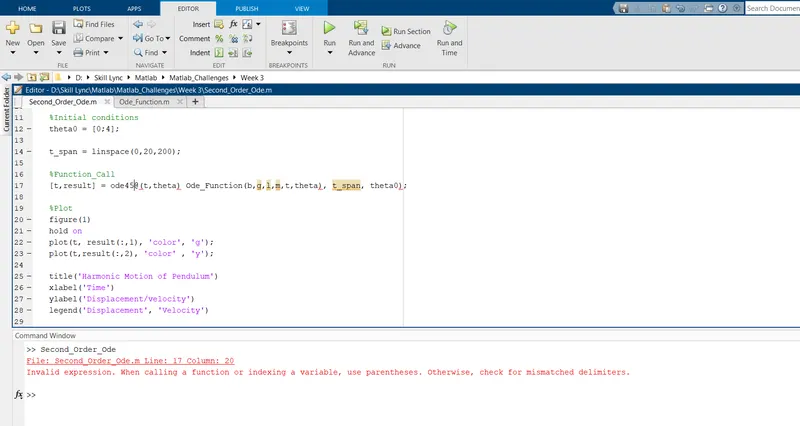
Error 1 : Faced careless Typo and Operators errors in the Calculation and Assignment part and Fixed it after Error was shown
Conclusion:
We have created a Transient Movement Graph and also created an Animation Video of the Simple Pendullum successfully using Matlab.