Project 1 - Parsing NASA thermodynamic data
Aim: To write a program to Parse the NASA Thermodynamic data file and calucalate the Thermodynamic properties of various gas elements using Matlab.
Objective:
1.Write a Function that extracts the 14 co-efficient and calculate the enthalpy, entropy and specific heats for all species.
2.Calculate molecular weight of each species and displaying it in command window.
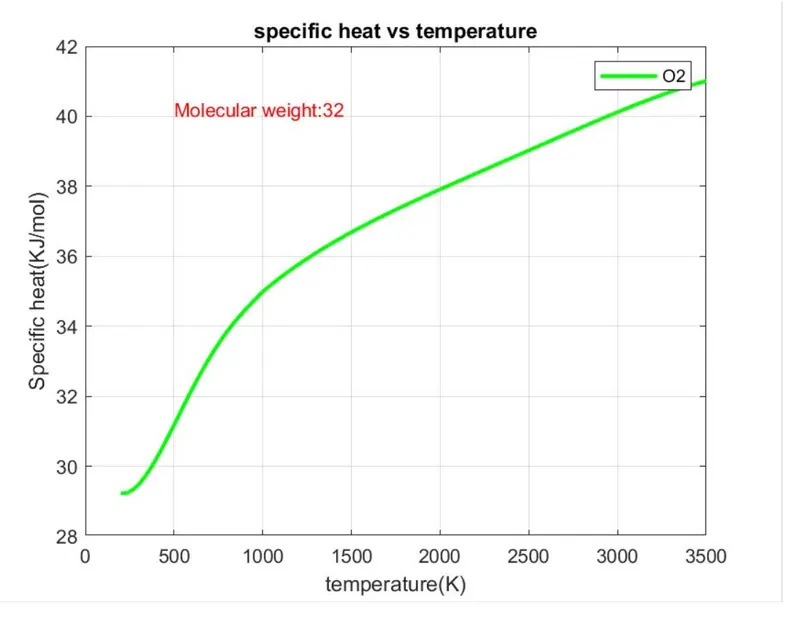
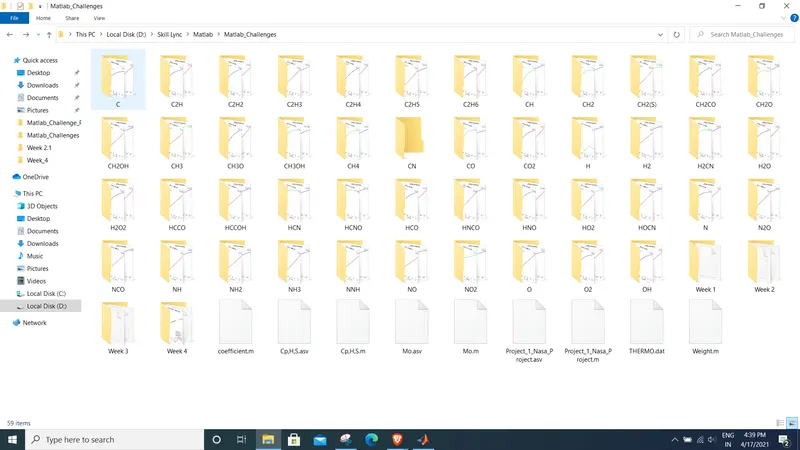
3.Plot images with appropriate names and place them in separate folders for each species with respective name.
Code:
%clear all the previous data or stored values
clear all
close all
clc

%Open the THERMO.dat file
f1 = fopen('THERMO.dat', 'r');


fgetl(f1);

%reading the Temperatute values distinguished as Local, Average and High
line = fgetl(f1);
a = strsplit(line, ' ');
global_low_temp = str2num(a{2});
global_average_temp = str2num(a{3});
global_high_temp = str2num(a{4});
fgetl(f1);
fgetl(f1);
fgetl(f1);

%Extracting Data for each Gas
for k = 1:53


    line = fgetl(f1);
    a = strsplit(line,' ');
    Gas = a(1);
    b = findstr(line, '.');
    local_low_temp = str2num(line(b(1) - 4:b(1) +4));
    local_high_temp = str2num(line(b(2)-4:b(2)+4));
    local_average_temp = str2num(line(b(3)-4:b(3)+4));

    %Extracting all 14 Coefficients
    ct = 1;
    for j = 1:3
        line = fgetl(f1);
        b = strfind(line, 'E')
        for i = 1:length(b)
            if ct<=7
                Ha(ct) = str2num(line(b(i)-11:b(i)+3));
                ct = ct+1;
            else
                La(ct-7) =str2num(line(b(i) - 11:b(i)+3));
                ct = ct+1;

            end
        end
    end

    %Intializing Specific Heat,Entropy and Enthalpy
    Cp = 0;
    H = 0;
    S = 0;


    [Cp,H,S] = coefficient(local_low_temp,local_average_temp,local_high_temp,La,Ha);


    M = Weight(Gas)

    %Plotting
    GAS = char(Gas);
    T = local_low_temp:local_high_temp;
    current= pwd;
    mkdir(GAS);
    cd(GAS)
    figure(1);
    plot(T,Cp, 'color', 'g', 'linewidth', 2);
    legend(Gas);
    txt1 = ['Molecular weight:' num2str(M)];
    text(500,max(Cp)*0.98,txt1,'color','r');
    grid on

    xlabel('Temperature(K)');
    ylabel('Specific heat(KJ/mol)');
    title('Specific heat vs temperature');

    figure(2);
    plot(T,H,'color', 'r', 'linewidth', 2');
    legend(Gas);
    txt1 = ['molecular weight:' num2str(M)];
    text(500,max(H)*0.98,txt1,'color','b');
    grid on
    xlabel('temperature(k)');
    ylabel('enthalpy(kj/mol)');
    title('enthalpy vs temperature');

    figure(3);
    plot(T,S,'color', 'b', 'linewidth', 2);
    legend(Gas);
    txt1 = ['Molecular weight:' num2str(M)];
    text(500,max(S)*0.98,txt1,'color','b');
    grid on
    xlabel('temperature(K)');
    ylabel('entropy (KJ/mol)');
    title('entropy vs temperature');

    saveas(figure(1), 'Cp.jpg');
    saveas(figure(2), 'H.jpg');
    saveas(figure(3), 'S.jpg');

    cd(current);

end


%Weight Function:
function Mo = Weight(Gas)

Weight = [1 12 14 16 32 0 40];
Gas1 = ['H' 'C' 'N' 'O' 'S' 'A' 'R'];
number = [1 2 3 4];

M = 0;
GAS = char(Gas);
for i = 1:length(GAS)
    for j = 1:length(Gas1)
    if GAS(i)==Gas1(j)
        M(i) = Weight(j);
    end
    for j = 1:length(number)
        if str2double(GAS(i))==number(j)
            M(i)=M(i-1)*(number(j)-1);
        end
    end
    end
end

Mo = sum(M);
end

%Coefficient Function:
function [Cp,H,S] = coefficient(local_low_temp,local_average_temp,local_high_temp,La,Ha)
for i=1:local_high_temp-local_low_temp+1

    R=8.34;
    T=i+local_low_temp-1;
    %for Lower temperature values
     if T<= local_average_temp
         Cp(i) = R*(La(1)+La(2)*T+La(3)*T^2+La(4)*T^3+La(5)*T^4);
         H(i) = R*T*(La(1)+(La(2)*T)/2+(La(3)*T^2)/3+(La(4)*T^3)/4+(La(5)*T^4)/5+La(6)/T);
         S(i) = R*(La(1)*log(T)+(La(2)*T)+((La(3)*T^2)/2)+((La(4)*T^3)/3)+((La(5)*T^4)/4)+(La(7)));

         %for Higher temperature values

     else
         Cp(i) = R*(Ha(1)+Ha(2)*T+Ha(3)*T^2+Ha(4)*T^3+Ha(5)*T^4);
         H(i) = R*T*(Ha(1)+((Ha(2)*T)/2)+(Ha(3)*T^2)/3+(Ha(4)*T^3)/4+(Ha(5)*T^4)/5+(Ha(6)/T));
         S(i) = R*(Ha(1)*log(T)+(Ha(2)*T)+(Ha(3)*T^2)/2+(Ha(4)*T^3)/3+(Ha(5)*T^4)/4+(Ha(7)));
     end
end
end
Code Explanation:
1. First we are clearing previous stored data using clear all, close all, clc
2. Open the data file named "THERMO.dat" file which contains all the respective datas for the gas elements.
3. First we extract 53 gas data from the THERMO data file and categorize them into low, high, average temperatures.
4. After that we calculate all the 14 coefficients using Coefficient function file.
5. We also calculate molecular weight of the gases using the Molecular Weight Function.
6. Then we plot the coefficient of these gases by keeping Specific Heat, Enthalpy, Entropy vs Temperature as Y Axis and storing them in Folder.
Output:
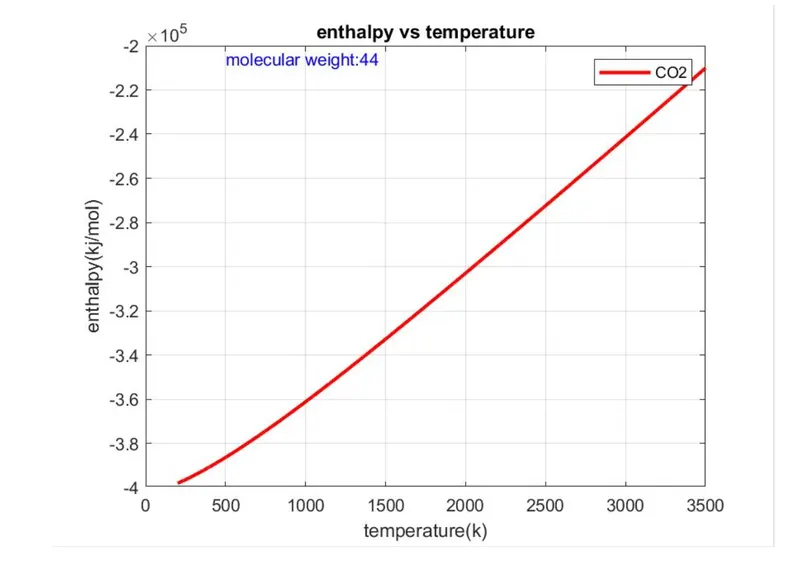
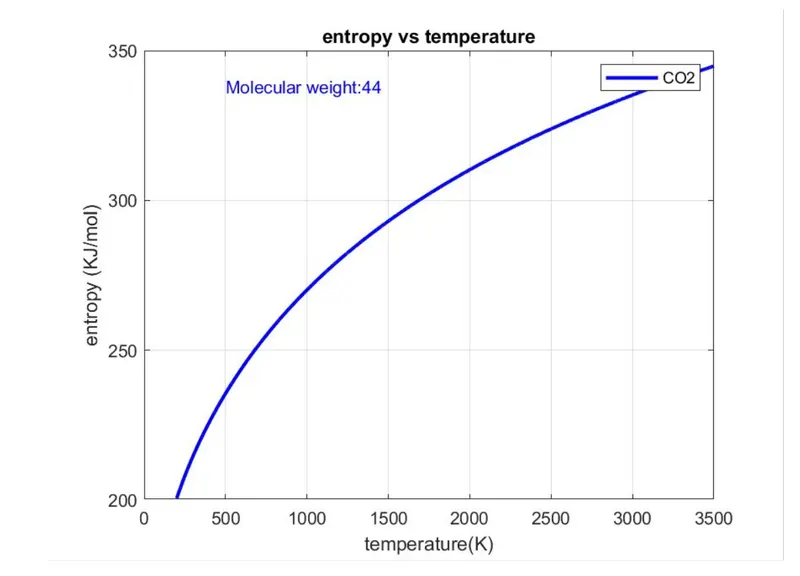
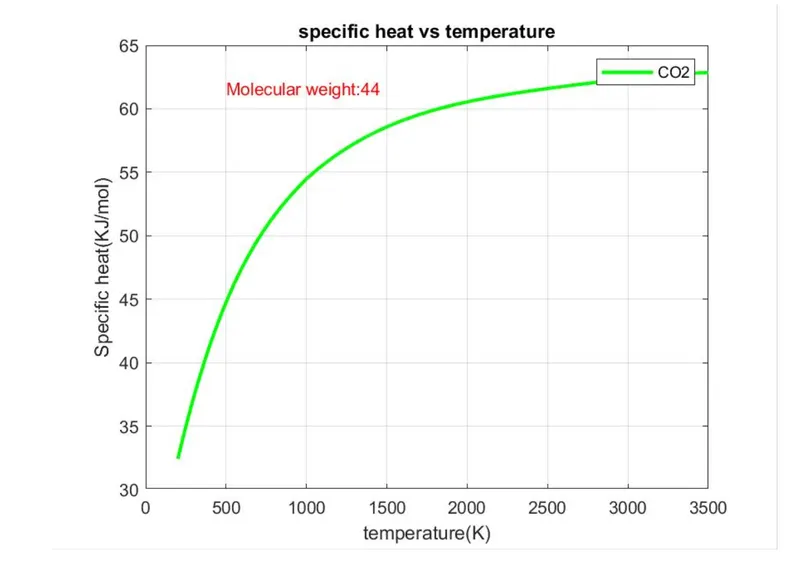
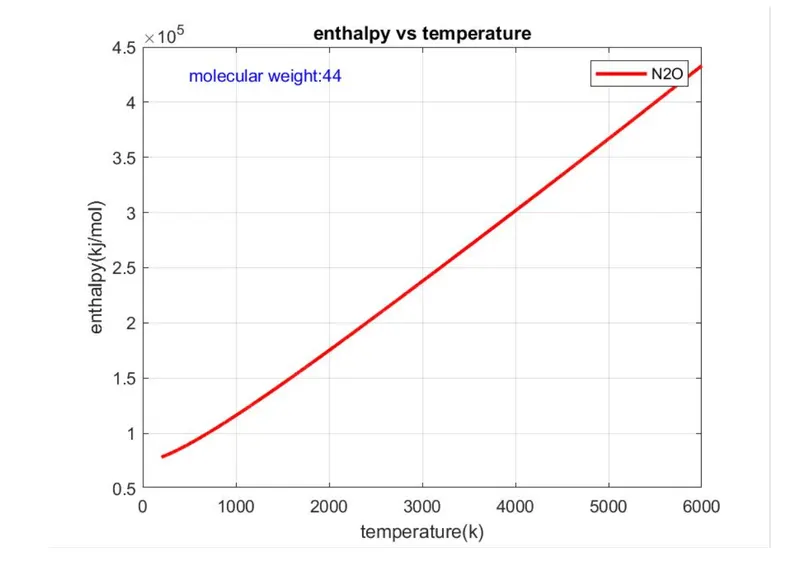
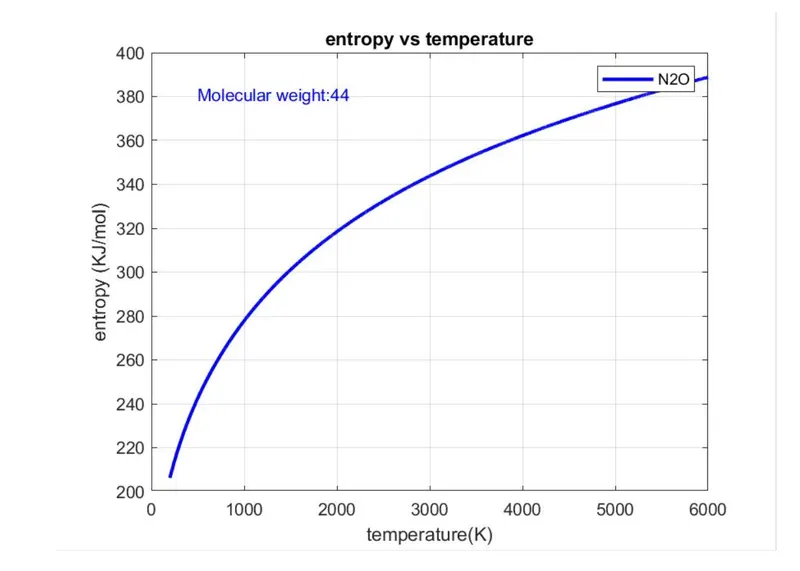
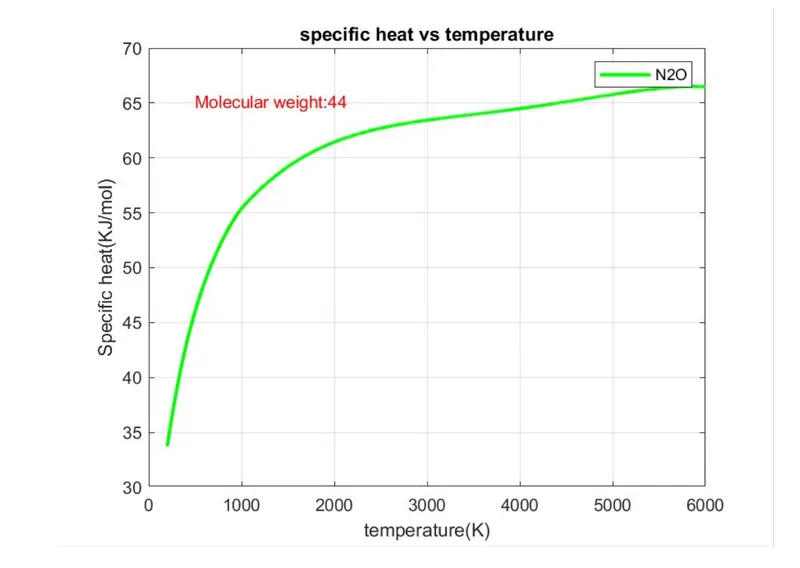
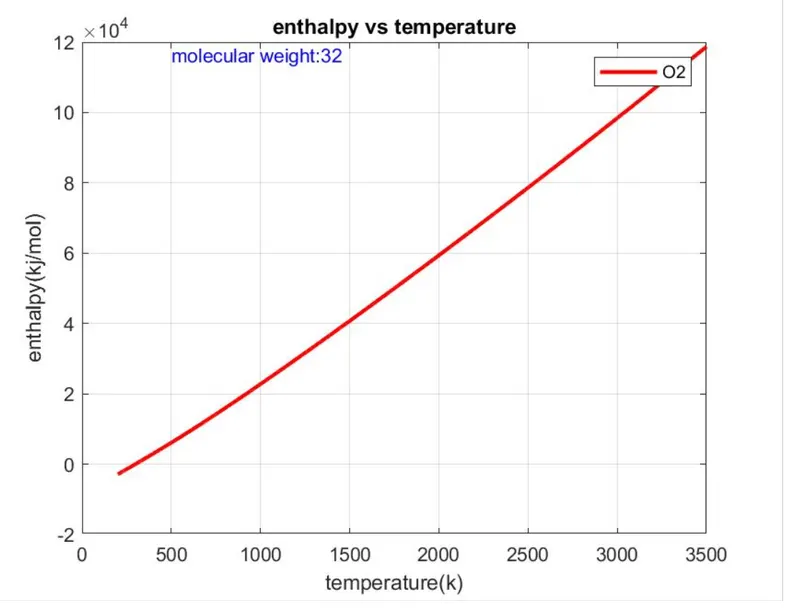
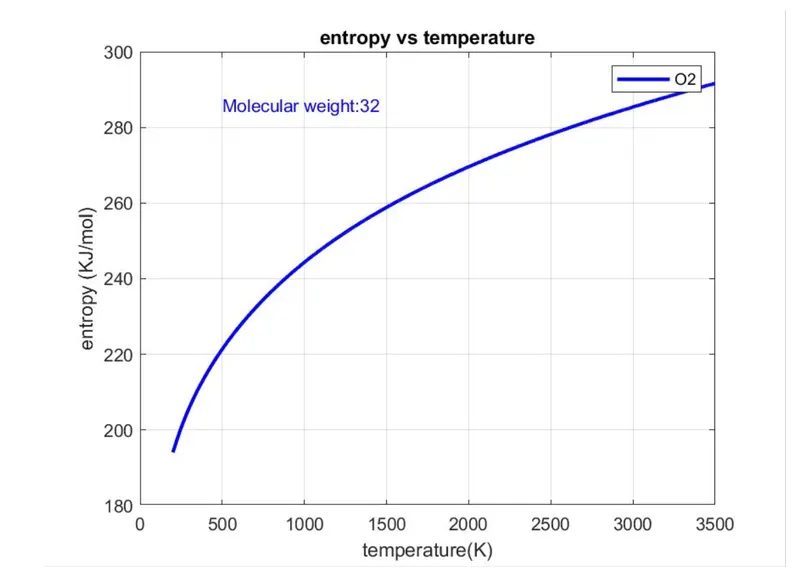
Folder Screenshot:
Googe Drive Link:
https://drive.google.com/drive/folders/1xATKasVQU5ZRqtw6HMeN_kg5kdnQkkW2?usp=sharing
Conclusion:
Thus we have successfully extracted data from THERMO file and found the Molecular Weight of 53 Gases and Ploted the Entropy, Enthalpy and Specific Heat against temperature for all the Molecules using MATLAB.