Week 3 - Solving second order ODEs
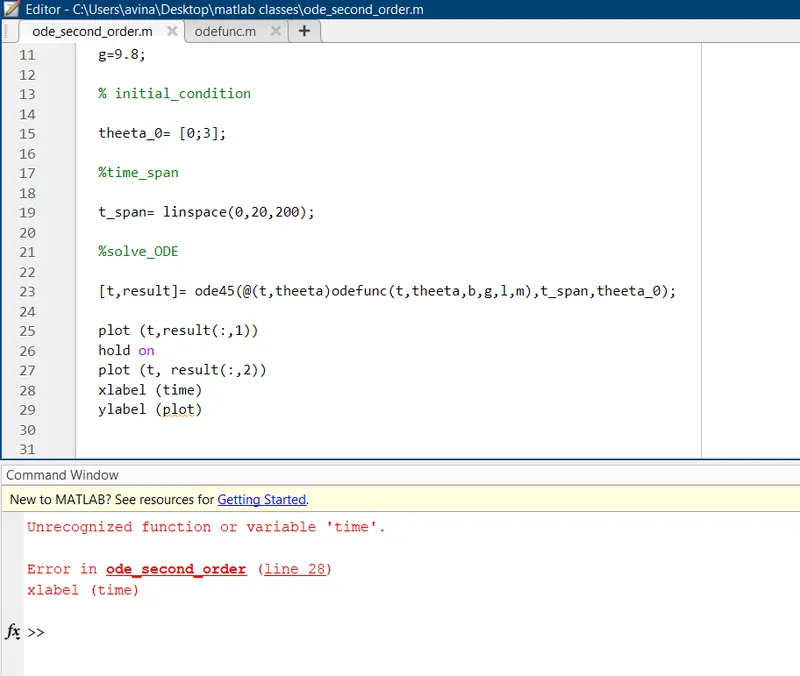
the label command was missing ' symbol inside the bracket so it couldn't give names to the x and the y axises.
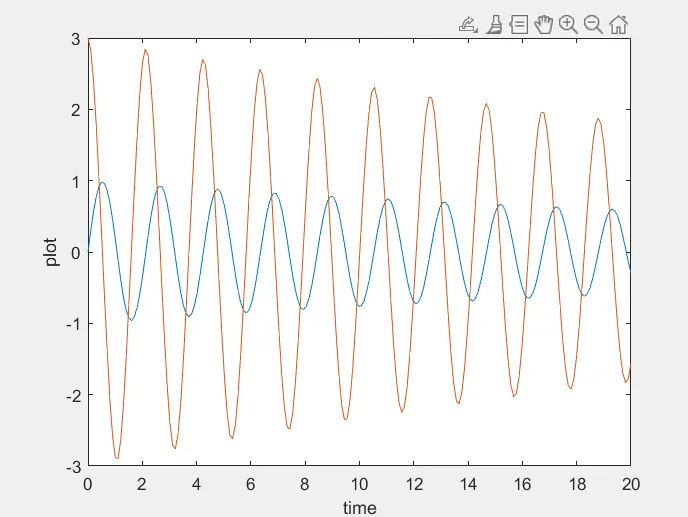
the blue curve shows the displacement of the pendulum whereas the red curve shows the velocity of the pendulum.
% Simple_Harmonic_motion
clear all
close all
clc
%input
b=0.05;
m=1;
l=1;
g=9.8;
% initial_condition
theeta_0= [0;3];
%time_span
t_span= linspace(0,20,200);
%solve_ODE
[t,result]= ode45(@(t,theeta)odefunc(t,theeta,b,g,l,m),t_span,theeta_0);
plot (t,result(:,1))
hold on
plot (t, result(:,2))
xlabel ('time')
ylabel ('plot')
call function coding
function [dtheeta_dt] = odefunc(t,theeta,b,g,l,m)
theeta1= theeta(1);
theeta2= theeta(2);
dtheet1_dt= theeta2;
dtheeta2_dt=-(((b/m)*theeta2)+((g/l)*sin(theeta1)));
dtheeta_dt= [dtheet1_dt;dtheeta2_dt];
end
Making Movie for a the file:
% Simple_Harmonic_motion
clear all
close all
clc
%input
b=0.05;
m=1;
l=1;
g=9.8;
% initial_condition
theeta_0= [0;3];
%time_span
t_span= linspace(0,20,200);
%solve_ODE
[t,result]= ode45(@(t,theeta)odefunc(t,theeta,b,g,l,m),t_span,theeta_0);
figure (1);
plot (t,result(:,1))
hold on
plot (t, result(:,2))
xlabel ('time')
ylabel ('plot')
%inputs_for_movie
theeta= result(:,1);
ct=1;
for i= 1:length(theeta)
x_0= 0;
y_0=0;
x_1= -(l*sin(theeta(i)));
y_1= -(l*cos(theeta(i)));
figure(2)
plot ([x_0 x_1],[y_0 y_1])
hold on
plot ( x_1,y_1,'o', MarkerSize=20)
hold off
xlim ([-2.5, 2.5])
ylim ([-2.5,2.5])
M(ct)= getframe(gcf);
ct=ct+1;
end
movie(M)
videofile= VideoWriter('shm_ode.avi');
open(videofile)
writeVideo(videofile,M)
close(videofile);
Description:
To to solve a second order ODE we compromise to a theory off breaking down the ODE into two different ODE:
now we begin with the interest giving the values of b,l,m,g as asind in the problem. Then we calculate the initial conditions for displacement and velocity the initial displacement to be zero and the initial velocity to be 3, this is then followed by defining the time span off the movement of the Bob which starts from zero to 20 seconds and we define 200 values in between. Then we call out a function named odefunc and store the results in array of t, result. The function that we called defines the value of the angles Theta one and Theta 2 followed by which we get dtheeta/dt. Then we use plot command in the first figure to plot the different values off displacement and velocity on the plot which gives us a sinusoidal curve as shown in the picture 1. Now for making the movie or the animation we begin a for loop which defines the values of the graph where the Bob is located at a particular time and then create a plot which is shown in figure 2 that stores the animation off the Bob while osculating, to store the animation in a movie format reuse movie command and then with the videofile command we store it in a file named SHM_ode.avi, and then close videofile.