Week 3 - Solving second order ODEs
STEP-1
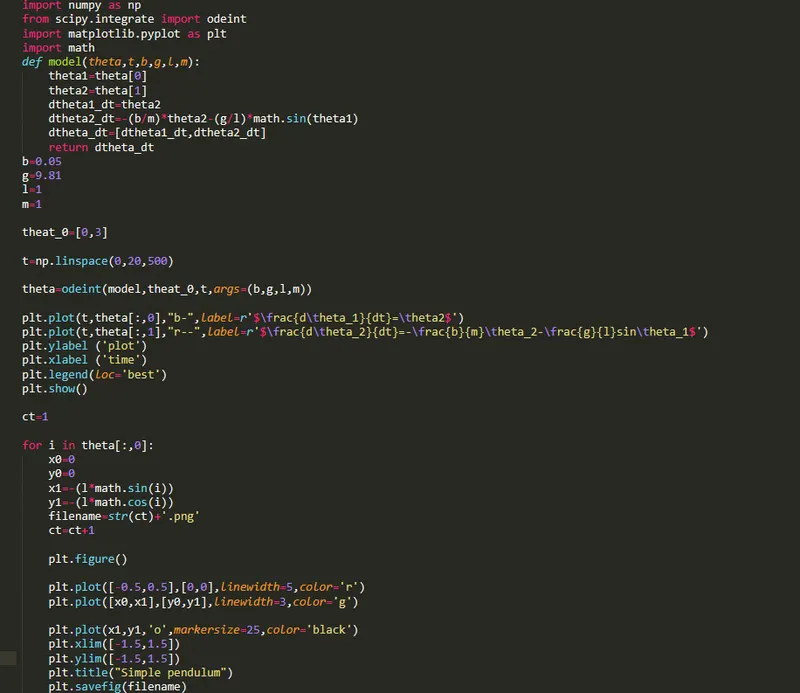
- Importing requried library duch as matplotlib,scipy and numpy for execution of code.
- Considering parameters such as damping coeffecient ,gravity ,lenth of string and mass of the bob as shown below:

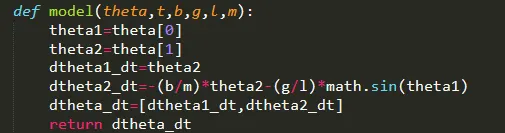
- Then defining a function that return dz/dt value , by calculating dtheta_1 and dtheta_2 values and which takes in parameters as b,g,l,m and theta.As shown below.
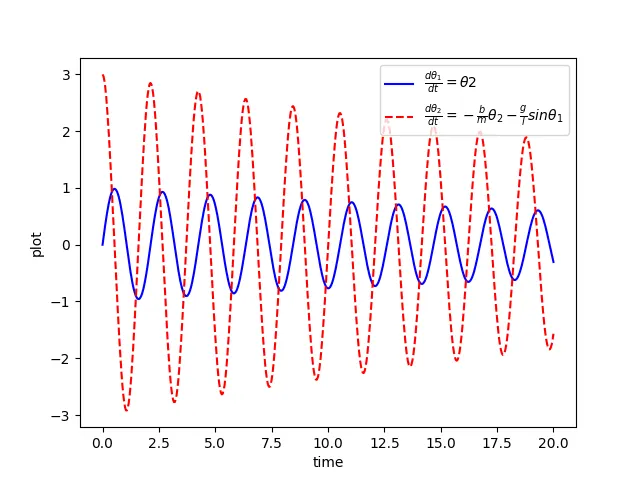
- Motionwas simulated between 0-20 sec, for angular displacement=0,angular velocity=3 rad/sec at time t=0.
- For that timre array was created between 0 and 20 genrating 500 values of time step.

- The code was written to genrate the graph as shown below which shows that how velocity and displacement varies w.r.t time .
STEP-2
- An count variable ct=1 was introduced to keep the count.
- Then an image was generated by considering intial and final postition of rod/string of prndulum.
- Then an bob of prndulum was created by using marker and specifying its size.
- after all images was obtained an GIF was generated.
The below is the code :
import numpy as np
from scipy.integrate import odeint
import matplotlib.pyplot as plt
import math
def model(theta,t,b,g,l,m):
	theta1=theta[0]
	theta2=theta[1]
	dtheta1_dt=theta2
	dtheta2_dt=-(b/m)*theta2-(g/l)*math.sin(theta1)
	dtheta_dt=[dtheta1_dt,dtheta2_dt]
	return dtheta_dt
b=0.05
g=9.81
l=1
m=1

theat_0=[0,3]

t=np.linspace(0,20,500)

theta=odeint(model,theat_0,t,args=(b,g,l,m))

plt.plot(t,theta[:,0],"b-",label=r'$\frac{d\theta_1}{dt}=\theta2$')
plt.plot(t,theta[:,1],"r--",label=r'$\frac{d\theta_2}{dt}=-\frac{b}{m}\theta_2-\frac{g}{l}sin\theta_1$')
plt.ylabel ('plot')
plt.xlabel ('time')
plt.legend(loc='best')
plt.show()

ct=1

for i in theta[:,0]:
	x0=0
	y0=0
	x1=-(l*math.sin(i))
	y1=-(l*math.cos(i))
	filename=str(ct)+'.png'
	ct=ct+1

	plt.figure()

	plt.plot([-0.5,0.5],[0,0],linewidth=5,color='r')
	plt.plot([x0,x1],[y0,y1],linewidth=3,color='g')

	plt.plot(x1,y1,'o',markersize=25,color='black')
	plt.xlim([-1.5,1.5])
	plt.ylim([-1.5,1.5])
	plt.title("Simple pendulum")
	plt.savefig(filename)
Link for GIF animation - https://youtu.be/h3rBXZkdviI