Week 3 - Solving second order ODEs
https://drive.google.com/file/d/18CHMpy-at_Ew0niriXQpW0Pv2Vz3aJPl/view?usp=s
TO FIND THE PROGRAM OF 2ND ORDER  SIMPLE PENDULUM

% problem on ode clock pendulum
clear all
close all
clc
b=0.05;
g= 98.1 m/s
l=1;
m=1;

% initial condition
theta_0 = [0,5];

% time points
t_span = linspace(0,10,200);
t= linspace(0,20,200);
x0=[0,3];
% this below step is for solve differential equation ode45 (matlab inbuilt function)
[t,x] = ode45(@(t,theta) ode_func(t, theta, b,g,l,m),t_span, theta_0);

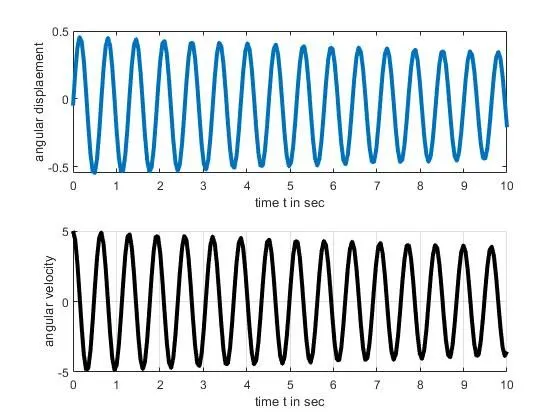
 %plottingfor tracking of angular velociry and angular displacement
 subplot(2,1,1)
 plot(t,x(:,1)'-b','LineWidth',3);
 xlabel('time t in sec');
 ylabel('angular displaement');
 subplot(2,1,2)
 hold on;
 plot(t,x(:,2),'-k','LineWidth',3);
 xlabel('time t in sec');
 ylabel('angular velocity');
 grid on;

 % ANIMATION
 x0=0;
 y0=0;

 ct=1;% counter actually represents each and every frame
 for i=1:length(t)
     x1=l*sin(x(i,1));
     y1=-l*cos(x(i,1));

     figure(2)
     plot([-1 1],[0 0],'LineWidth',6,'Color','g');
     axis([-2 2 -2 2]);
     line([x0,x1],[y0,y1],'linewidth',2,'color','b');
     hold on;
     plot(x0,y0,'o','markersize',3,'markerfacecolor','y');
     plot(x1,y1,'o','markersize',20,'markerfacecolor','r');
     legend('supportrod','length of pendulum','fixed point','bod of pendulum');
     grid on;
     hold off;
     M(ct)=getframe(gcf);
     ct=ct+1;
 end


movie(M)
videofile = VideoWriter('simple_pendulum','Uncompressed AVI');
open(videofile)
writeVideo(videofile,M)
close(videofile)

AIM : TO FIND THE PROGRAM OF 2ND ORDER  SIMPLE PENDULUM

EXPLINATION:
            In this program first we give the input values are b=0.05,g= 98.1 m/s
l=1,m=1,intial condition theta_0 =[0,5];and time points are t_span =linspace(0,10,200);
t= linspace(0,20,200);x0=[0,3];and then solve differential equation ode45 (matlab inbuilt function) [t,x] = ode45(@(t,theta) ode_func(t, theta, b,g,l,m),t_span, theta_0);are given for this a sub-function is exicuted


function [dtheta_dt] = ode_func(t,theta,b,g,l,m)
        theta1 = theta(1);
        theta2 = theta(2);
        dtheta1_dt = theta2;
        dtheta2_dt = -(b/m)*theta2 - (g/l)*sin(theta1);
        dtheta_dt = [dtheta1_dt; dtheta2_dt];
end

and we plot for  angular displacement subplot and plot the values for  x-label as time,y- labels as as angular displacement and plot for  angular velocity subplot and enter  hold on  and then plot the values for  x-label as time,y- labels as as angular velocity and enter grid on and then animation part in this we give the x0,y0,forloop  for movie animation from this code ct = (ct+1) i,x1,y1 values for figure 2 plot,axis lines and hold on plot markerface , markercolor and givesupportrod,length of pendulum
fixed point,bod of pendulum and then grid on hold off.then we apply video file  using the command  videofile and file name and command open videofile writevedio(videofile,M) and close video file  and exicute the 'M'movie file .