Week 3 - Solving second order ODEs
1.
close all
clc

b = 0.05;
g = 9.81; %m/s2
l = 1; %m
m = 1; %kg
ct = 1;

% Initial condition
init_val = [0;3];

% Time points
t_span = linspace(0,20,200);

% Solve ODE
[t, results] = ode45(@(t,theta) ode_func(t,theta,b,g,l,m),t_span,init_val);

figure(1)
plot(t,results(:,1))
hold on
plot(t,results(:,2))
xlabel('Time')
ylabel('Plot')

thetax = results(:,1);

for i = 1:length(results(:,1));
    theta = thetax(i);

    x0 = 0;
    y0 = 0;

    x1 = l*sin(theta);
    y1 = - l*cos(theta);

    %Plot
        figure(2)
        plot([-0.5 0.5],[0,0],'LineWidth',5,'Color',[0 0 0])
        hold on
        plot([x0 x1],[y0 y1],'Color',[0 0 1])
        hold on
        plot(x1,y1,'Marker','o','MarkerFaceColor',[1 0 0])
        hold off
        axis([-2 2 -2 2])
        xlabel('x axis')
        ylabel('y axis')
        pause(0.001)
        M(ct) = getframe(gcf);
        ct = ct+1;

end

movie(M)
videofile = VideoWriter('pendulum.avi','Uncompressed AVI')
open(videofile)
writeVideo(videofile,M)
close(videofile)- Initial all previous codes are closed and the window command is cleared.
- The variables b, l, m, g, and ct are defined.
- The initial conditions are in angular displacement and velocity, thus the array init_val is 2 rows and 1 column.
- The pendulum needs to run for 20 sec, so t_span ranges from 0 to 20 with 200 intervals.
- ode45 is used to solve the ODE, first is mentioned that the ODE has 2 variables (t & theta), then the actual ode function is called (ode_func), then the time range is specified (t_span) and finally the initial conditions are given to solve the ode.
- The solution of the above ODE is saved in an array called [t, results].
- In fig (1) the 1st column of [t, results] is plotted, the graph is held, and upon that the 2nd column of [t, results] is plotted with the mentioned x and y labels.
- The first column of [results] is saved as thetax.
- A for loop is start where i goes from 1 to the length of the 1st column of [results].
- Theta changes according to the column of [results].
- The open end of the string is fixed, so the x0 and y0 coordinates are given as 0,0.
- The position of the pendulum on the other end can be determined by using the hypotenuse of the angle made by the string and loaded as x1 and y1.
- In fig (2) a line is plotted from (-0.5,0) to (0.5,0) with a width of 5 and of the color black to represent a fixed wall.
- The plot is held and another plot is drawn from (x0,y0) to (x1,y1) with the color blue.
- The plot is held and at the point (x1,y1) a marker in the shape of a sphere is added in the color red.
- The axis ranges from -2 to 2 on the x-axis and y-axis and is labeled.
- The code is paused for 0.001
- For each ct, the frame on the screen is captured to develop a movie. The ct is incremented by 1 and the loop continues until the time of 20 sec is reached.
- All the captured frames are stitched together as a movie and saved as 'pendulum.avi'.
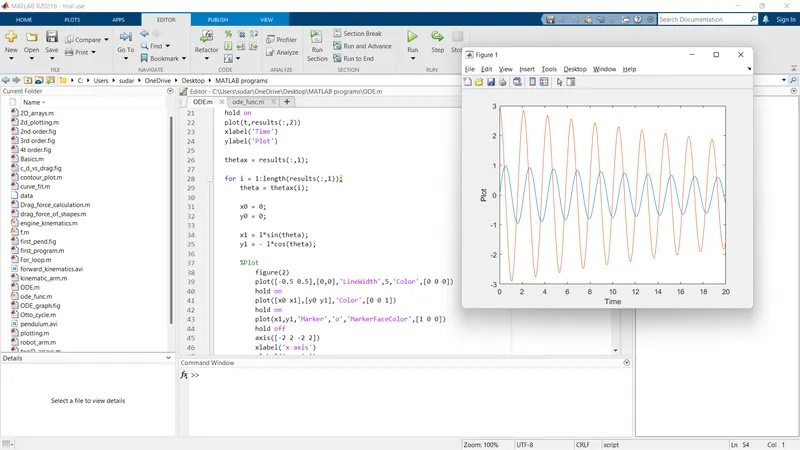
The above photo is the plot of the above code.
The youtube link for the animation video - https://youtu.be/BOaqnqvNSHo
2.
function [dtheta_dt] = ode_func(t,theta,b,g,l,m)

    theta1 = theta(1);
    theta2 = theta(2);
    dtheta1_dt = theta2;
    dtheta2_dt = - (b/m)*theta2 - (g/l)*sin(theta1);
    dtheta_dt = [dtheta1_dt; dtheta2_dt];

end
The above code is the function that the code in 1. is called upon.
- The function value is saved as [dtheta_dt] with a function name ode_func.
- ode_func is given with all the required variables.
- theta1 is given as theta of 1 and the same with theta2.
- The ODE given to solve is broken down into 2 ODEs which is dtheta1_dt and dtheta2_dt
- The array dtheta_dt actually consists of dtheta1_dt and dtheta2_dt as a 1X2 matrix.
3. Errors
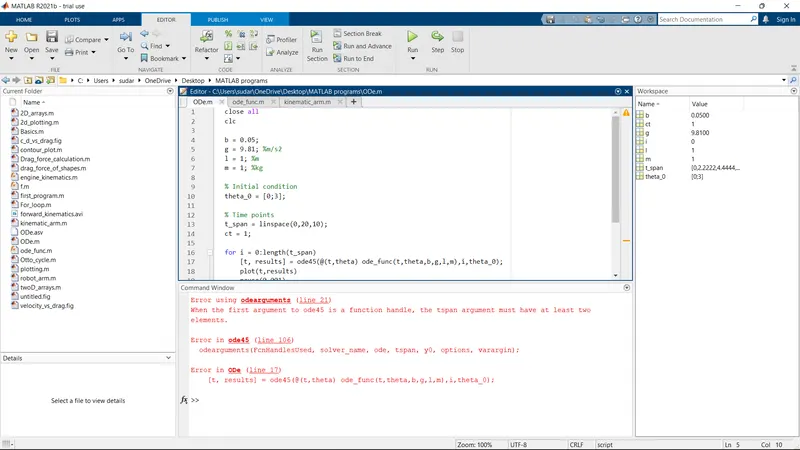
In the for loop, I used i for changing the time, but i was the length of another array and not time. It was then changed to t_span to get the right answer.
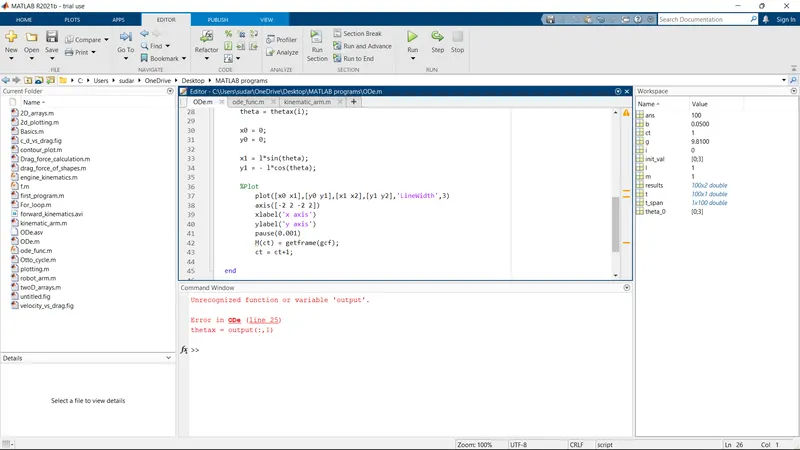
The variable 'output' was written instead of 'results'
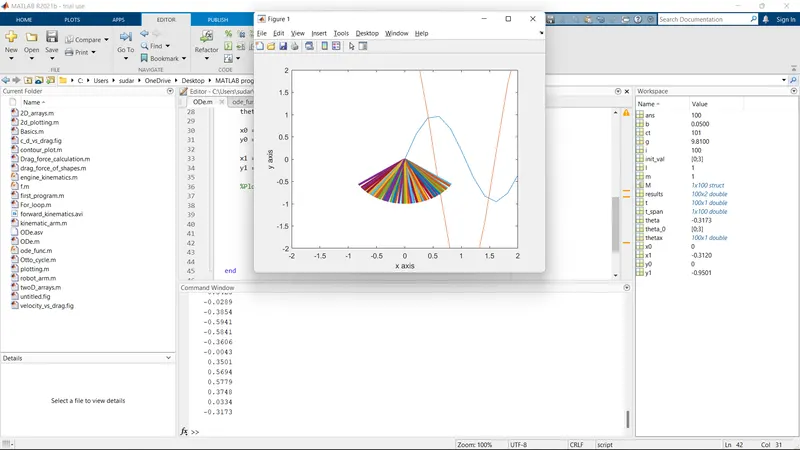
Both the fig(1) and fig(2) plots were in the same window, the fixed wall was not being plotted and the pendulum was leaving an afterimage. The code for fig(1) was taken out of the for loop and the 'hold on" command was used multiple times to get the right plot.
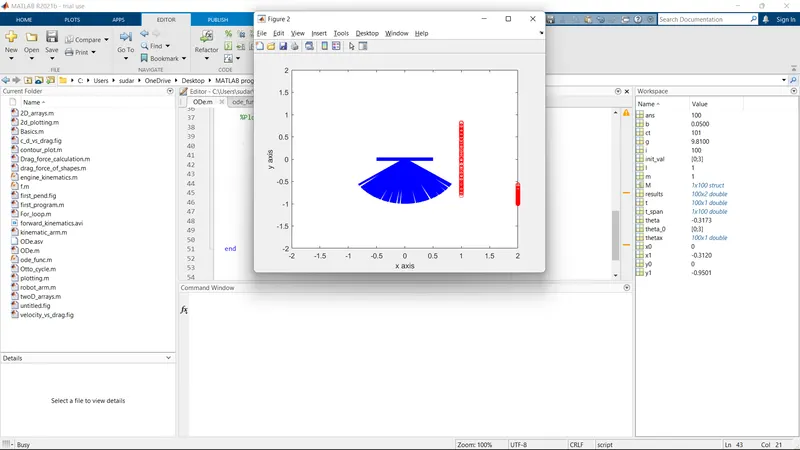
The bob of the pendulum did not coincide with the end position of the string, because in the code the coordinates of the bob were not clearly mentioned. When the bob's coordinates and the free end of the string's coordinates matched, the plot was achieved.