Week 3 - Solving second order ODEs
SIMULATING A PENDULAM USING MATLAB
INTRODUCTION
A pendulum follows a second order linear differential equation as given below
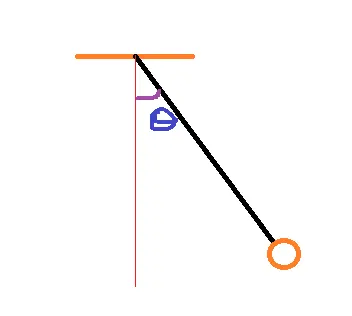
Here theta represents the angular displacement of the pendulum with respect to y-axis. b is the damping coefficent,m is the mass ,L is the lngth of te pendulum from fixed axis .
In the above given differential equation sin(theta) can be approximated to theta for small values of theta.Hence the final differential equation will be of the form
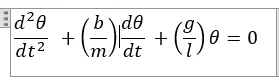
This equation can be solve using ODE 45 solver. Initially we define a function which returns a column vector containing the equation for slopes y2 and y3, where dy1/dt = y2 ; and d(y2)/dt=y3
function z=myfun(t,y,b,m,l,g)
z=[y(2);(-b/m)*y(2)-(g/l)*y(1)];
end
here dy1/dt = y(2);
dy2/dt = y(3);
we are solving these to set of equations for a span of [0 20]
following command is used for calling ODE45 module to solve the function myfun (as defined above)
[t,y]=ode45(@(t,y)myfun(t,y,.05,1,1,9.8),tspan,y0)
@(t,y) solves for t vs y .
b=.05;
m=1;
l=1;
g=9.8;
CODE
tspan=[0 20];%defining the time interval upto which result required
y0=[1,3];%initial condition for y1(displacement) and y2(angular velocity)
L=1;%declaring the length of pendulum
[t,y]=ode45(@(t,y)myfun(t,y,.05,1,1,9.8),tspan,y0) %using ODE 45 (y (:,1) is displacement and y(:,2) is velocity
for i=1:length(t)
    y1=-L*cos(y(i,1));% y coordinate
    x1=L*sin(y(i,1));% x cooedinate
    plot([0 x1],[0 y1],'linewidth',6);%plotting the penduum wire
    hold on
    plot(x1,y1,'o','Markersize',15)%plotting the ball
    xlabel('xposition')
    ylabel('yposition')
    title('pendulum animation')
    axis([-1 1 -1.1 0])%setting the axis
    pause(.1)
    M(i)=getframe(gcf);
    clf
end
%making a movie and saving in avi format
movie(M)
video=VideoWriter('pendulum.avi','Uncompressed AVI');
open(video);
writeVideo(video,M);
close(video);
The plot and hold command is used to plot the wire and the ball simultaneously. Markersize is used as 15. Axis is defined from -1 t0 1 for x axis and 0 to -1.1 for y -axis.
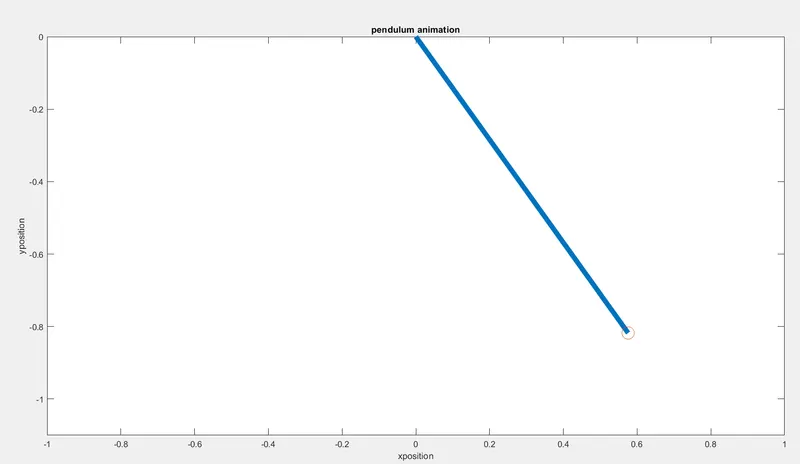
The plot obtained in each iteration is saved to an array M. The array M is used to create a movie and save it as pendulum.avi in the current folder using the below commands
%making a movie and saving in avi format
movie(M)
video=VideoWriter('pendulum.avi','Uncompressed AVI');
open(video);
writeVideo(video,M);
close(video);
The link for the animation is given below:
Errors appeared :
The error appeared to me for not calling ODE45 properly. Ode 45 could nt recognise which variable of function myfun is to be solved for.
ode45(myfun(t,y,.05,1,1,9.8),tspan,y0) wrong code
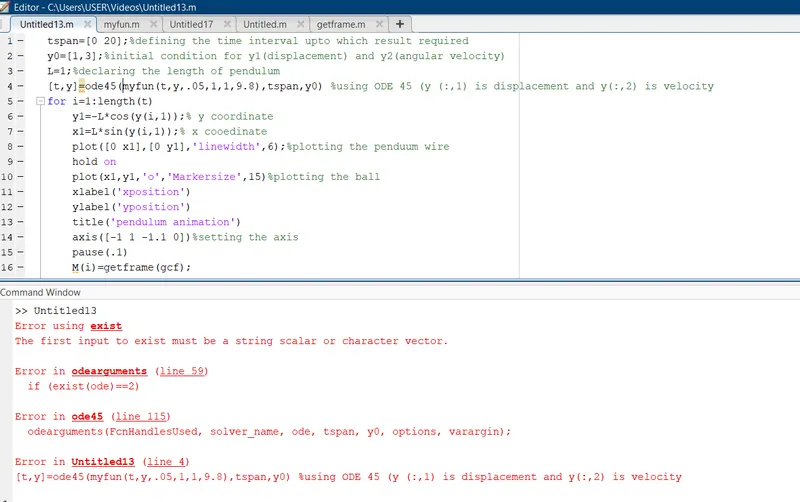
corrected the error by replacing the command in line 4 with
t,y]=ode45(@(t,y)myfun(t,y,.05,1,1,9.8),tspan,y0) %using ODE 45