Project 1 - Parsing NASA thermodynamic data
Parsing NASA thermodynamic data
In this file parsing project we read the thermodynamic properties file prepared by NASA. The file name is 'THERMO.dat' and it should be saved in your current working folder. We use the fopen command to open the file with reading permisiion passed on to fopen.We then read the contents of the file line by line
The structure of the file is as follows:
O L 1/90O 1 G 200.000 3500.000 1000.000 1
2.56942078E+00-8.59741137E-05 4.19484589E-08-1.00177799E-11 1.22833691E-15 2
2.92175791E+04 4.78433864E+00 3.16826710E+00-3.27931884E-03 6.64306396E-06 3
-6.12806624E-09 2.11265971E-12 2.91222592E+04 2.05193346E+00 4
O2 TPIS89O 2 G 200.000 3500.000 1000.000 1
3.28253784E+00 1.48308754E-03-7.57966669E-07 2.09470555E-10-2.16717794E-14 2
-1.08845772E+03 5.45323129E+00 3.78245636E+00-2.99673416E-03 9.84730201E-06 3
-9.68129509E-09 3.24372837E-12-1.06394356E+03 3.65767573E+00 4
We see that after every species name O,O2 3 lines are given for coefficents. Every last number in these three lines denote the line number of that secies only. So we need to ignore that.
Our major task lies in the identification of species name and stop the search when the species name matches our target species and then parse through the next three lines to fetch the coefficient matrix.
MAJOR STEPS
1.converting input argument to uppercase for it to be comparable with file
2.opening the file with an handle
main logic
3.checking if first cell of the splitted string is same as s species name
4.selecting next 3 lines ,cleaning the data and saving the numbers
5.cleaning the string : this was a major step of the process, since the file is very poorly arranged the strsplit command would split the numbers in a meaningless way .eg 2.345E004-8.234E006 would be splittes as '2.345E004-' '8.234E006'. So to clean this up i used strrep(string replace )command.
Replace - with ' -' and 'E -' wiht 'E-'
This comes with a lot of trial and error experience only !!!!!
6. converting the string to numbers
7.saving the numbers to coefficent matrix'
8.finding the local temperature ranges
9.Expanding the polynomial
10.plotting and saving the figure with species name
function C=parsed(s)
%converting input argument to uppercase for it to be comparable with file
s=upper(s);
x=s;
%opening the file with an handle
f5=fopen('THERMO.dat','r')
num=[0 0 0 0 0 0 0];
%main logic
frewind(f5)
for i=1:217
    A=fgetl(f5);
    comp=strsplit(A);
    % checking if first cell of the splitted string is same as s(species
    % name)
     if strcmpi(comp{1},s)
        l=i;

      %%%%%%%%will be used only for o2 ,n2 and co2
        if strcmpi(s,'O2')
            molecularweight=36;
            display('molecular weight is')
             display(molecularweight);
        end
        if strcmpi(s,'N2')
            molecularweight=14;
             display('molecular weight is');
             display(molecularweight);
        end
        if strcmpi(s,'CO2')
            molecularweight=48;
             display('molecular weight is');
             display(molecularweight);
        end
        %%%%%%%%%%%%%%%%%%%%%%%%
        %selecting next 3 lines ,cleaning the data and saving the numbers
        for j=1:3
       var= fgetl(f5);
       %cleaning the string
       for m=1:length(var)
              var= strrep(var,'-',' -');
              var=strrep(var,'E -','E-');
       end
        B=strsplit(var);
        for k=1:length(B)
            %converting string to numbers
            if isempty(B{k})==1
        num(k)=0;
        k=k+1;
            else
                num(j,k)=str2num(B{k});
            end

        end
        end
        %declaring the coefficent matrix
        C=[num(1,2),num(1,3),num(1,4),num(1,5),num(1,6),num(2,2),num(2,3),num(2,4),num(2,5),num(2,6),num(3,2),num(3,3),num(3,4),num(3,5)];
       %finding the ranges from the file
        temploc=strsplit(A)
         ranges=[str2num(temploc{length(temploc)-3})  str2num(temploc{length(temploc)-2}) str2num(temploc{length(temploc)-1})]

         break
     end


end
%finding the property values using the given set of equations
T1=linspace(ranges(3),ranges(2));
T2=linspace(ranges(1),ranges(3));
cp1=8.314*(C(1) +C(2)*T1 + C(3)*T1.^2+ C(4)*T1.^3 + C(5)*T1.^4);
cp2=8.314*(C(8) +C(9)*T2 + C(10)*T2.^2+ C(11)*T2.^3 + C(12)*T2.^4);
H1=8.314*T1.*(C(1)+C(2)*T1/2 + C(3)*(T1.^2)/2 + C(4)*(T1.^3)/3 + C(5)*(T1.^4)/4 + C(7));
H2=8.314*T2.*(C(8)+C(9)*T2/2 + C(10)*(T2.^2)/2 + C(11)*(T2.^3)/3 + C(12)*(T2.^4)/4 + C(14));
S1=8.314*(C(1)*log(T1) + C(2)*T1 + C(3)*(T1.^2)/2 + C(4)*(T1.^3)/3 + C(5)*(T1.^4)/4 + C(7));
S2=8.314*(C(8)*log(T2) + C(9)*T2 + C(10)*(T2.^2)/2 + C(11)*(T2.^3)/3 + C(12)*(T2.^4)/4 + C(14));

%plotting  each property in a seperate figure and saving using string
%concantation
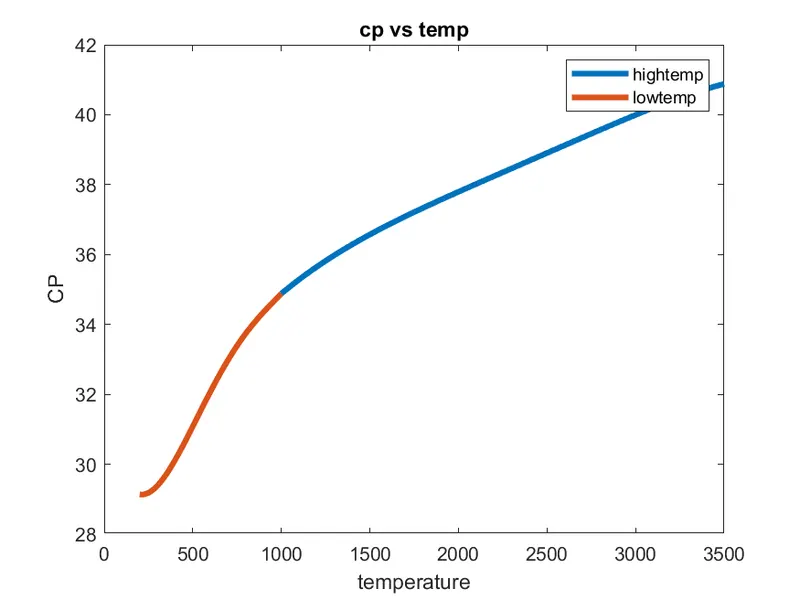
figure(1)
plot(T1,cp1,'linewidth',3)
hold on
plot(T2,cp2,'linewidth',3)
xlabel('temperature')
ylabel('CP')
title('cp vs temp')
legend('hightemp','lowtemp')
filename=['cpdata of '  x  '.png']
saveas(gcf,filename)

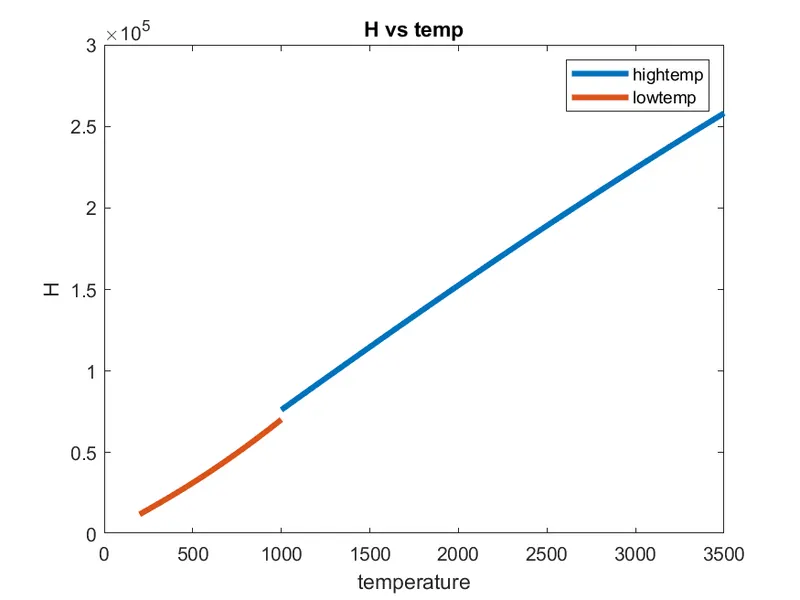
figure(2)
plot(T1,H1,'linewidth',3)
hold on
plot(T2,H2,'linewidth',3)
xlabel('temperature')
ylabel('H')
title('H vs temp')
legend('hightemp','lowtemp')
filename=['H data of' x '.png']
saveas(gcf,filename)


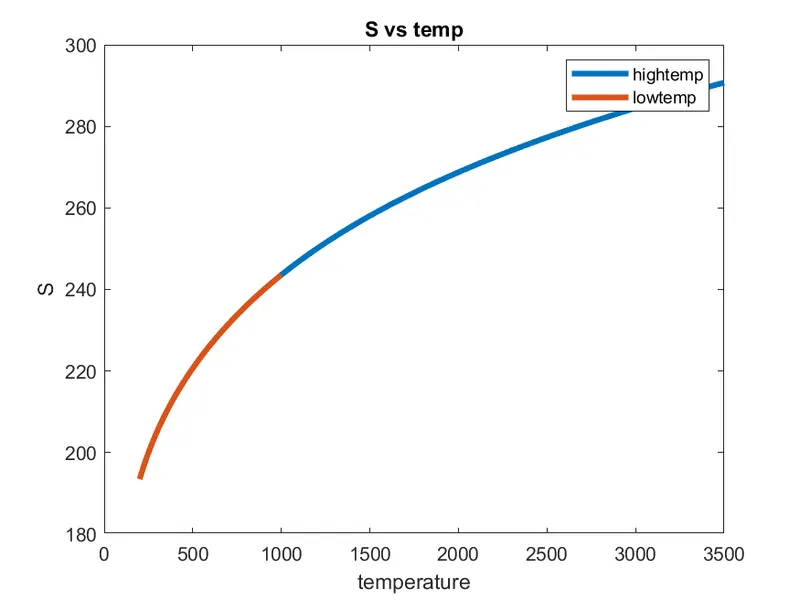
figure(3)
plot(T1,S1,'linewidth',3)
hold on
plot(T2,S2,'linewidth',3)
xlabel('temperature')
ylabel('S')
title('S vs temp')
legend('hightemp','lowtemp')
filename=['entropy chart of '  x  '.png']
saveas(gcf,filename)
fclose(f5);
end
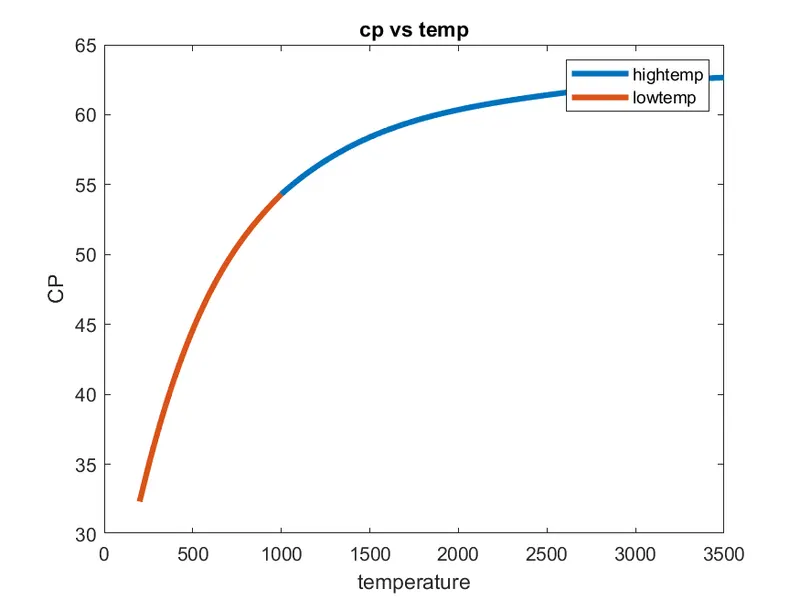
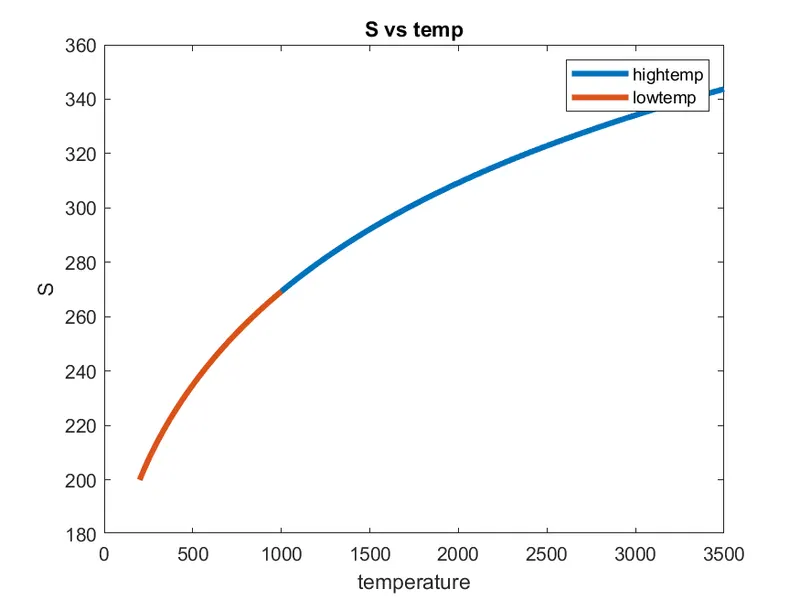
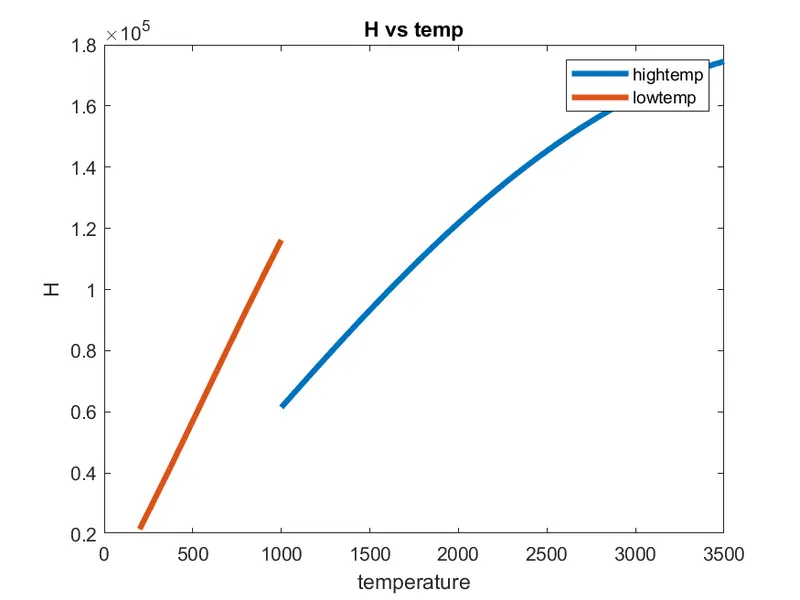
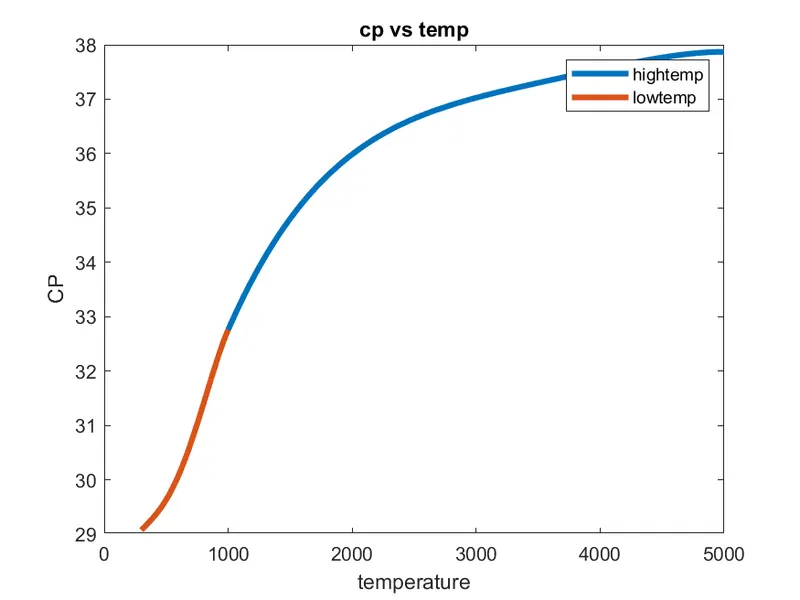
The results obtained plotted as shown::
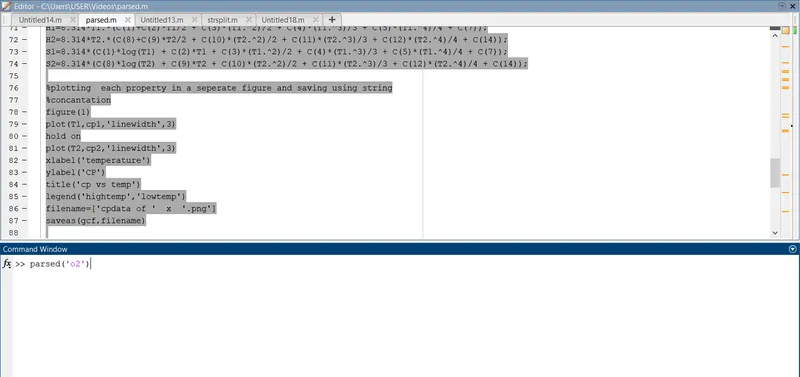
I have not given a seperate species name label for the figures as they are already save dby species name.
DATAS FOR O2:
DATAS FOR CO2
DATA FOR N2:
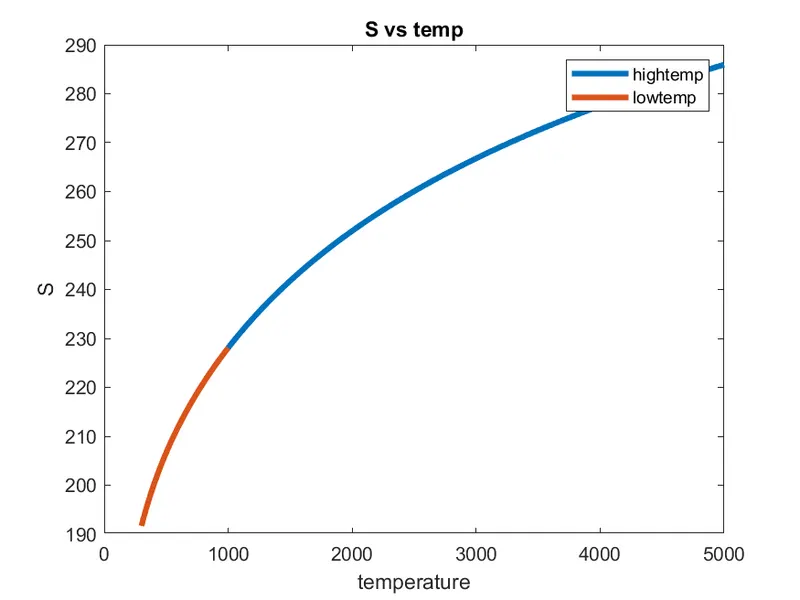
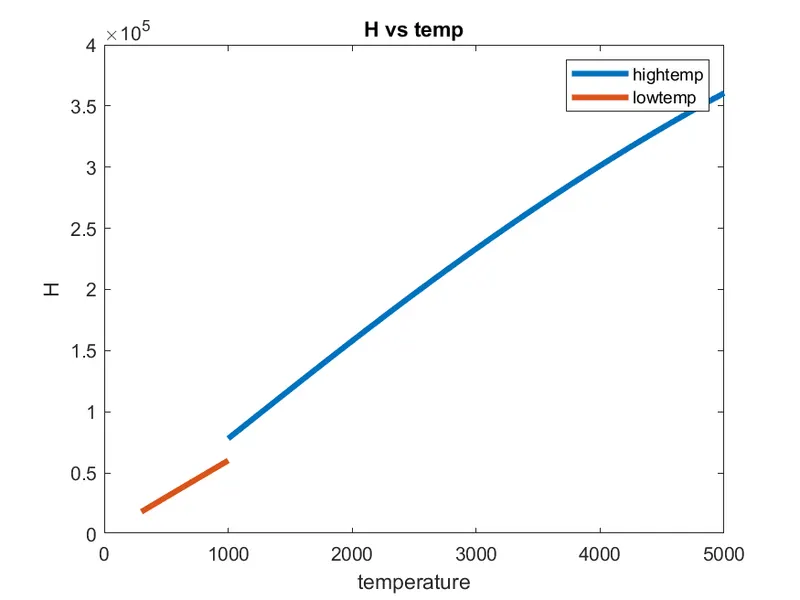
the files are saved in my working directly as follows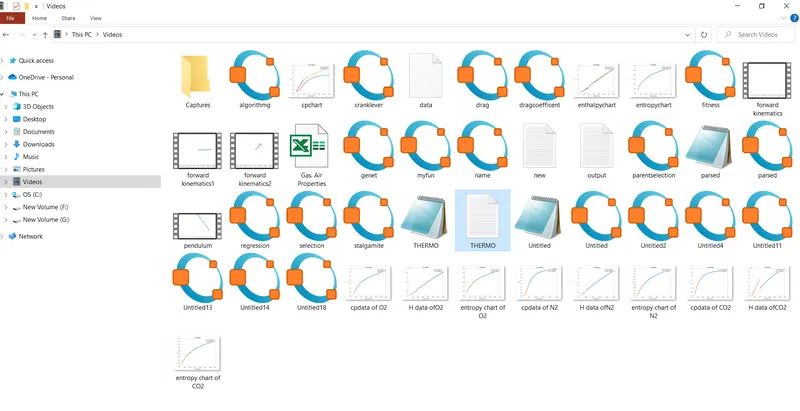
ERRORS:
Following error was faced in fetching the local temperature range.I had given specific cell numbers after splitting the string in the line containing the species.
Used following code:
ranges=[str2num(temploc{5}) str2num(temploc{6}) str2num(temploc{7})]
but this was not working for all the species:
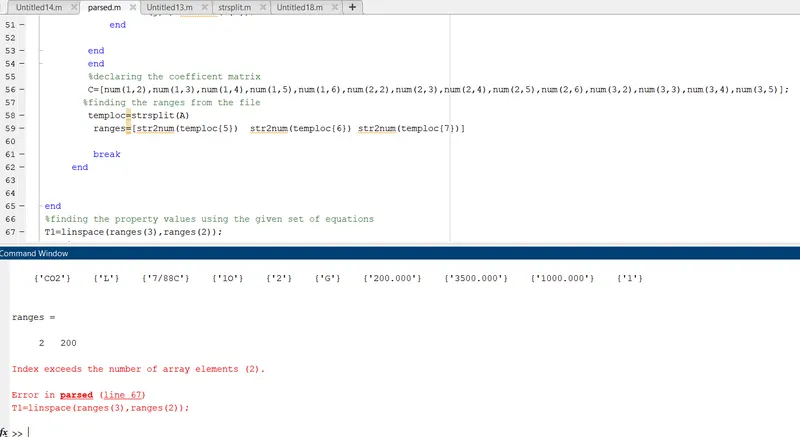
chnaged the code with
ranges=[str2num(temploc{length(temploc)-3}) str2num(temploc{length(temploc)-2}) str2num(temploc{length(temploc)-1})]
to obtain correct result. The code is self understood.That is last three strings are local temeprature ranges.