Week 3 Sheet metal Bending challenge
Sheet metal Bending challenge
OBJECTIVE: The main objective of this challenge is to perform a static structural Analysis on sheet metal bending for 3 Different materials mentioned below. And to run the analysis for the following material:
Case 1:Aluminium Alloy 1199,Copper Alloy NL and Magnesium Alloy NL. To find out the Equivalent stress, Equivalent elastic strain and Total Deformation in Y direction and compare the results for the three materials.
Case 2:With the material as Aluminium Alloy, change the friction coefficient to 0.19 and run the analysis as mentioned in Case 1.To compare the results with that in case 1.
Case 3: Refine the mesh on the plate such that it doesn't cross the academic limit. With Aluminium alloy as material, run the analysis as in Case 1 and compare the results.
SOFTWARE USED: ANSYS Workbench 2021 R1 and ANSYS Mechanical for Analysis.
INTRODUCTION:
Sheet metal Forming
Sheet metal forming processes are those in which force is applied to a piece of sheet metal to modify its geometry rather than remove any material. The applied force stresses the metal beyond its yield strength, causing the material to plastically deform, but not to fail. By doing so, the sheet can be bent or stretched into a variety of complex shapes. Sheet metal forming processes include the following:
- Bending
- Roll forming
- Spinning
- Deep Drawing
- Stretch Forming
Bending:
Bending is a metal forming process in which a force is applied to a piece of sheet metal, causing it to bend at an angle and form the desired shape. A bending operation causes deformation along one axis, but a sequence of several different operations can be performed to create a complex part. Bent parts can be quite small, such as a bracket, or up to 20 feet in length, such as a large enclosure or chassis. A bend can be characterized by several different parameters, shown in the image below.
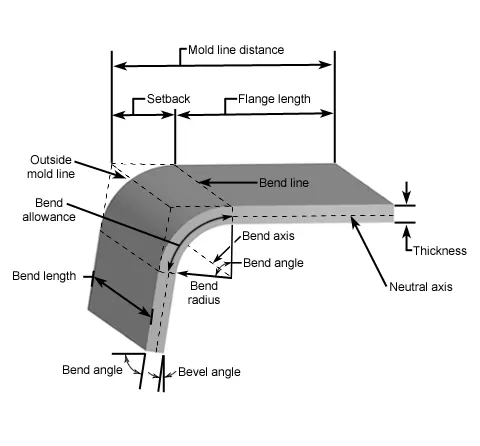
FIG.1: BENDING DIAGRAM
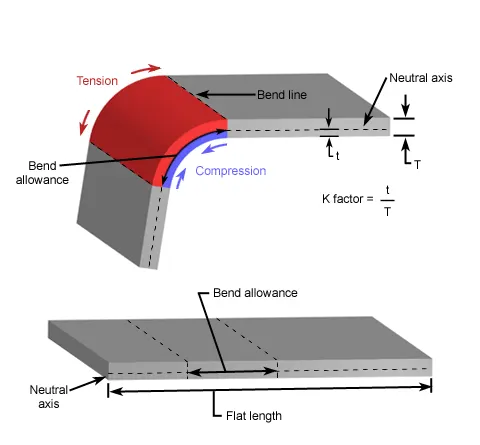
FIG.2: NEUTRAL AXIS
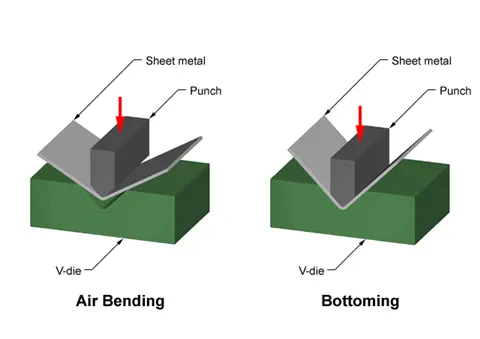
FIG.3: BENDING OPERATION
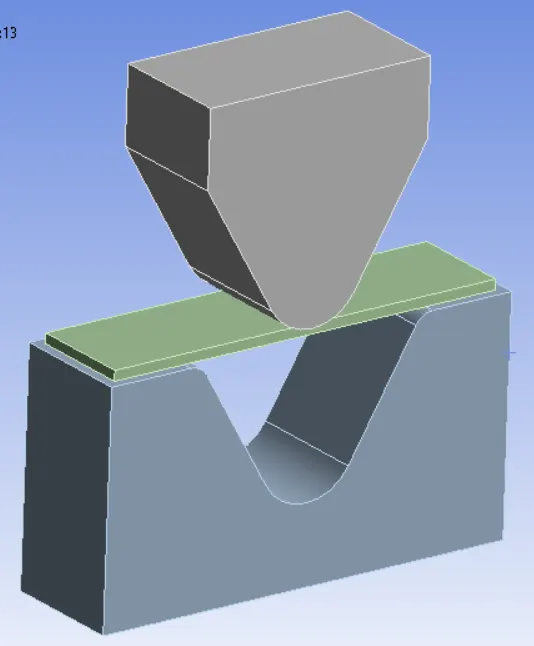
FIG.4: CAD MODEL
PROCEDURE:
1. Open the ANSYS Workbench software. Under the Analysis system select the Static structural and wait for few seconds to pop up the window, which contains Engineering data, Geometry, Model, setup, Solution and Results.
2. Rename the static structural as Sheet Bending.
3. Under geometry import the Sheet Metal Bending model.
4. Update the model by right click and edit the Model for Preprocessing.
5. Wait for few seconds and ANSYS Mechanical will open as shown below.
FIG.5: CAD MODEL OF SHEET METAL BENDING
6. Assign the material to the model, By classifying the required needs into three cases, And assign material to the model based on the cases.
SHEET Material used:
Case 1:Aluminium Alloy 1199,Copper Alloy NL and Magnesium Alloy NL. To find out the Equivalent stress, Equivalent elastic strain and Total Deformation in Y direction and compare the results for the three materials.
Case 2:With the material as Aluminium Alloy, change the friction coefficient to 0.19 and run the analysis as mentioned in Case 1.To compare the results with that in case 1.
Case 3: Refine the mesh on the plate such that it doesn't cross the academic limit. With Aluminium alloy as material, run the analysis as in Case 1 and compare the results.
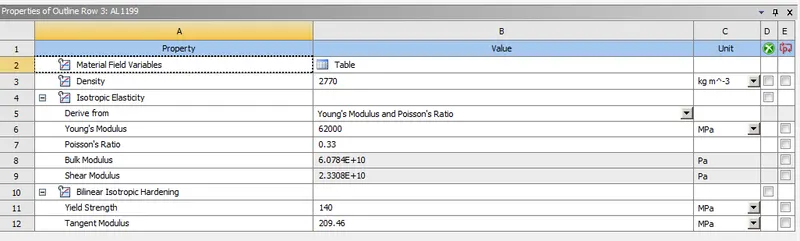
FIG 6: Material properties of a AL 1199
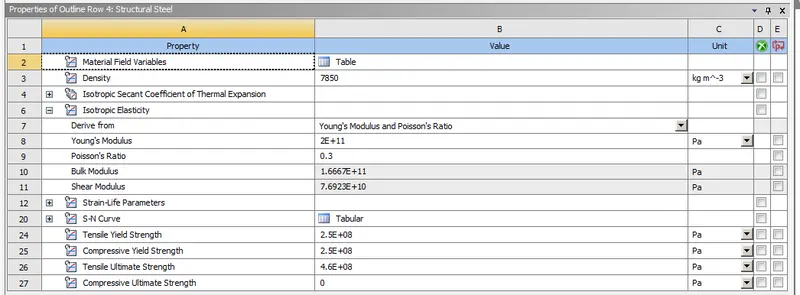
FIG 7: Material properties of a Structural Steel
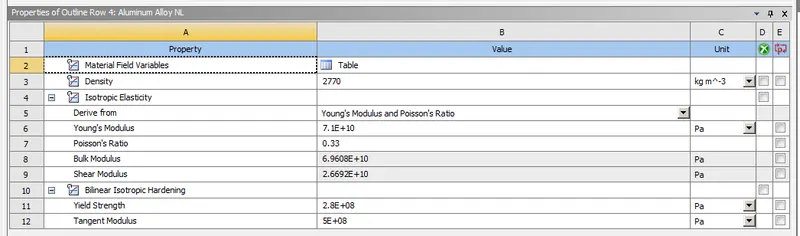
FIG 8: Material properties of a Aluminum Alloy
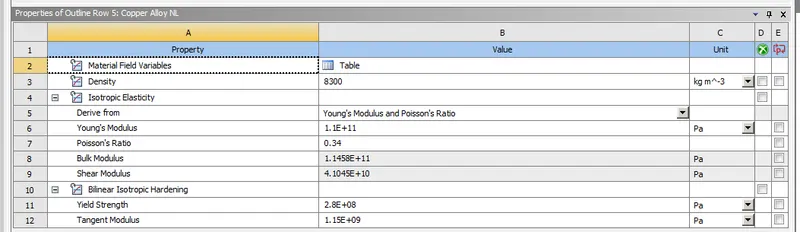
FIG 9: Material properties of a Copper Alloy
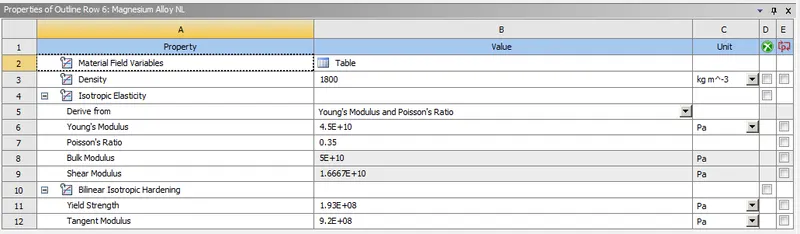
FIG 10: Material properties of a Magnesium Alloy
7. Frictional contact between the Punch to Sheet and the Sheet to Die are Defined with a frictional coefficient of 0.1.
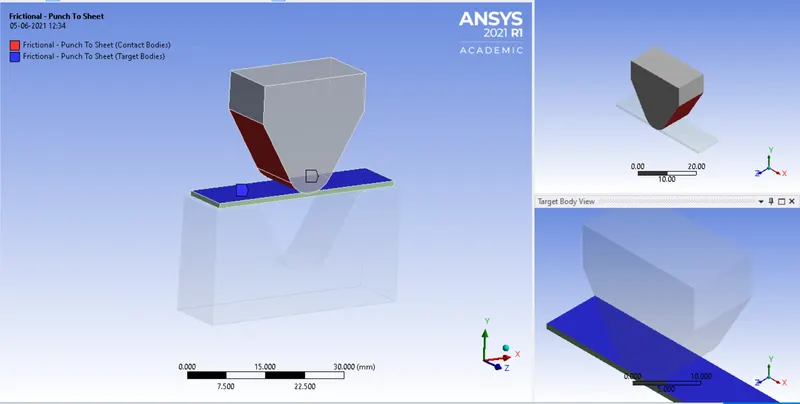
Fig 11: Frictional contact between the Punch to Sheet
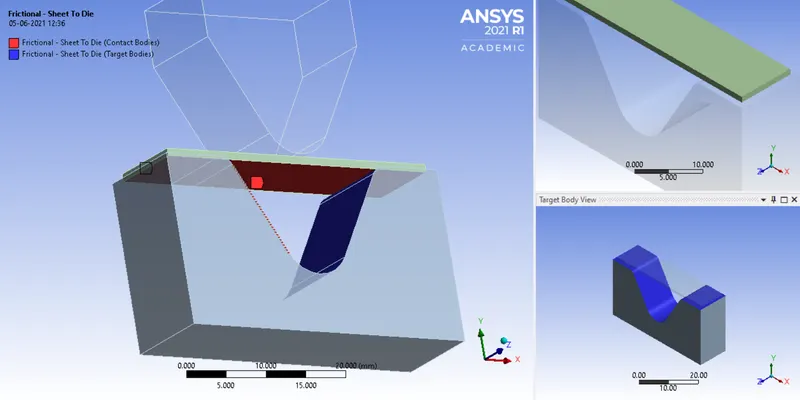
Fig 12: Frictional contact between the Sheet to Die
8. Insert a Displacement to the punch to move downward,by assigning the necessary values in Y-direction. So click on static structural go to insert and select Displacement . Then select the upper faces of the punch.
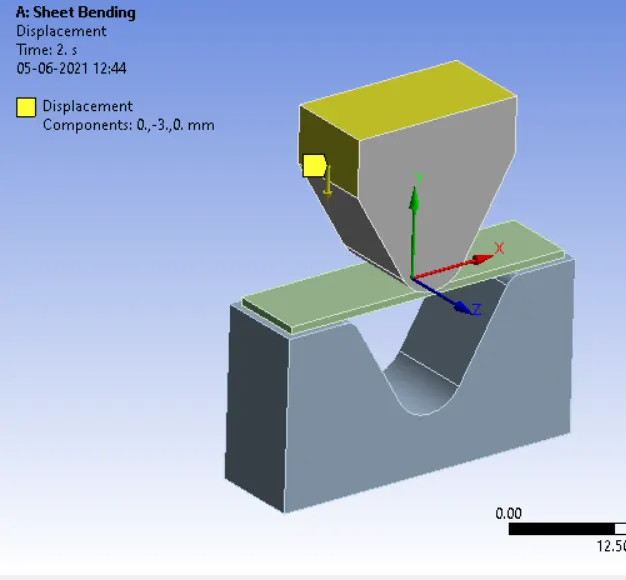
Fig.13: Displacement

Fig.14: Graph with Tabular value
Insert a Second Displacement to the sheet in order to make it fixed in Z-Direction, by assigning the ZERO in Z-direction. So click on static structural go to insert and select Displacement . Then select the faces of the Sheet as shown below.
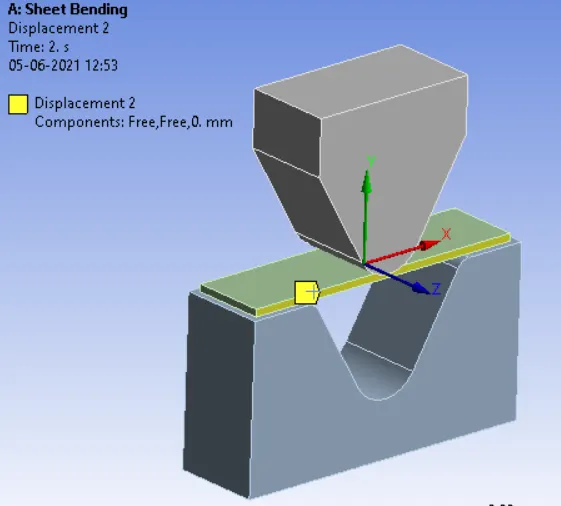
Fig.15: Displacement

Fig.16: Graph with Tabular value
Insert a Third Displacement to the Die in order to make it to move backward after the bending operation is performed. By assigning the Vlaues in Last two step of Y-direction. So click on static structural go to insert and select Displacement . Then select the faces of the Die as shown below.
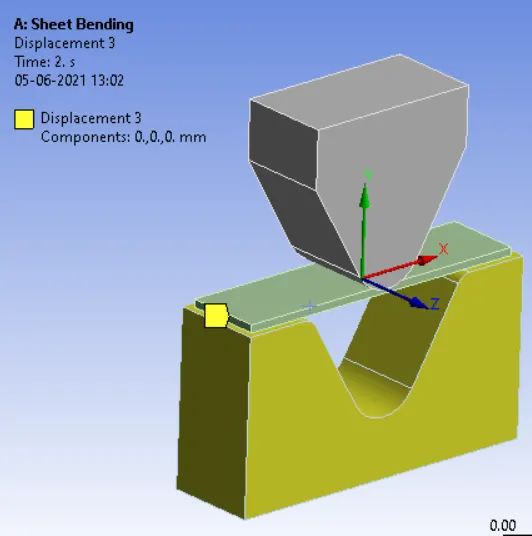
Fig.17: Displacement

Fig.18: Graph with Tabular value
9. In ANSYS automatic mesh will be performed with Default mesh size and select the sizing option and select the punch and die, assign the element size as 4mm. Similarly select the plate and assign the value of 1mm and similarly select the contact face of punch and die with the plate and assign a value of 2mm. (i.e Ansys student version will have a limted number of elements and nodes.)
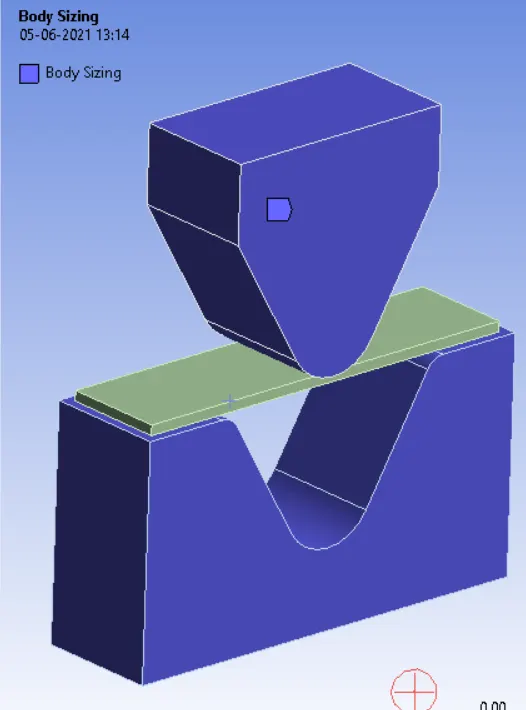
Fig19: Selecting body for 2D Meshing
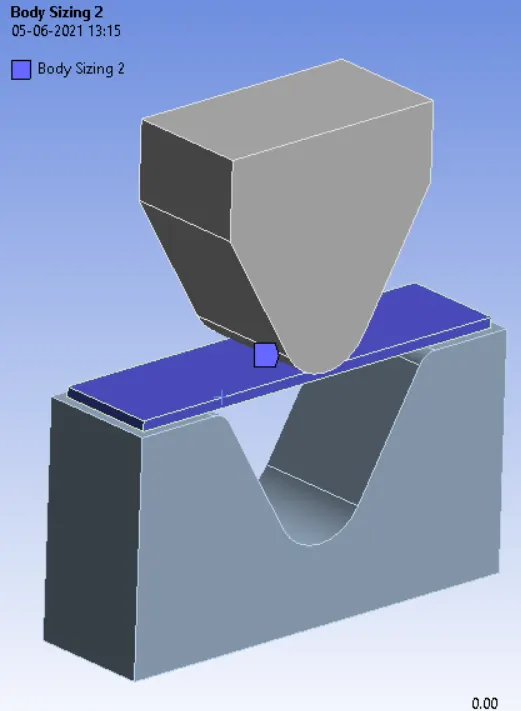
Fig20: Selecting the Sheet for 2D Meshing
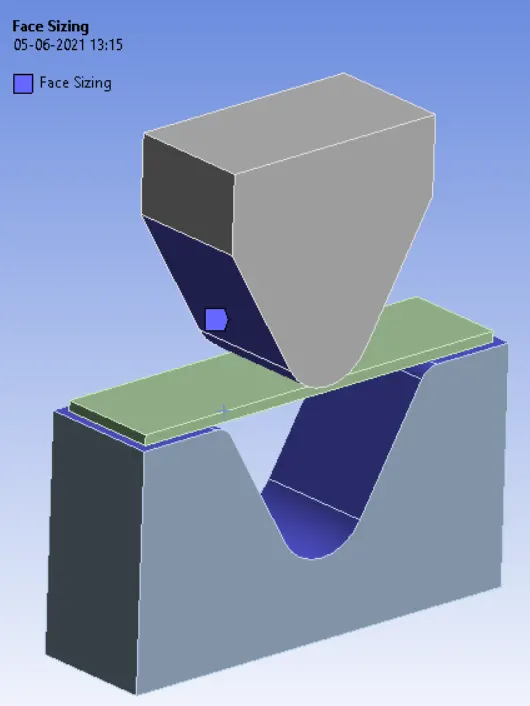
Fig21: Selecting faces for 2D Meshing
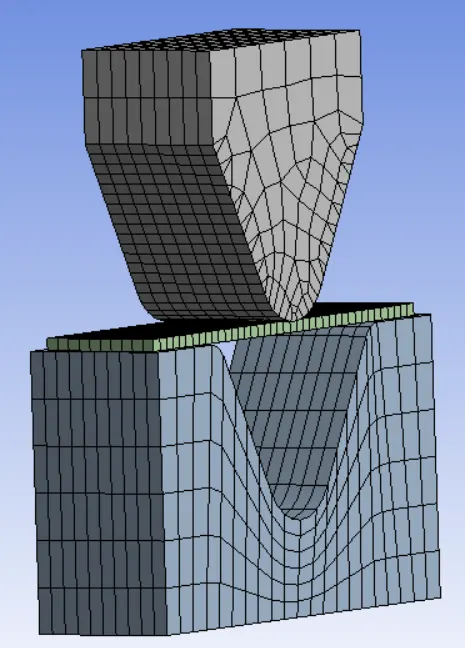
Fig22: 2D Meshing of Sheet, Punch and Die
10. As it is a solid structure we have to change the 2D Element to 3D Element. So click on mesh and select the insert option. Under insert option select the method and slect the gemetry as well as under the method, select the tetrahedrons.
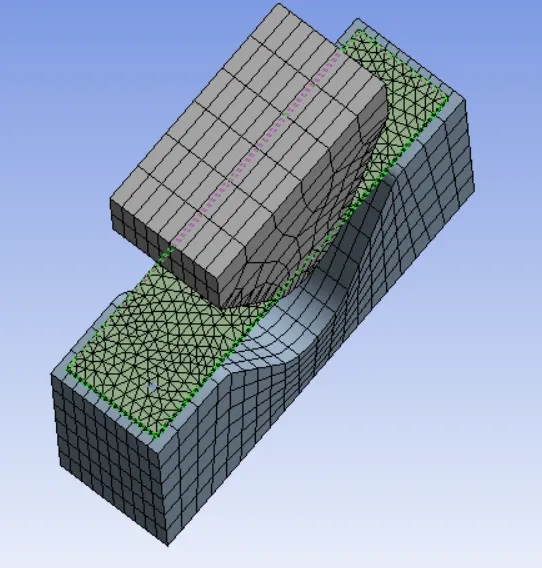
Fig.23: 3D Meshing of Sheet Metal
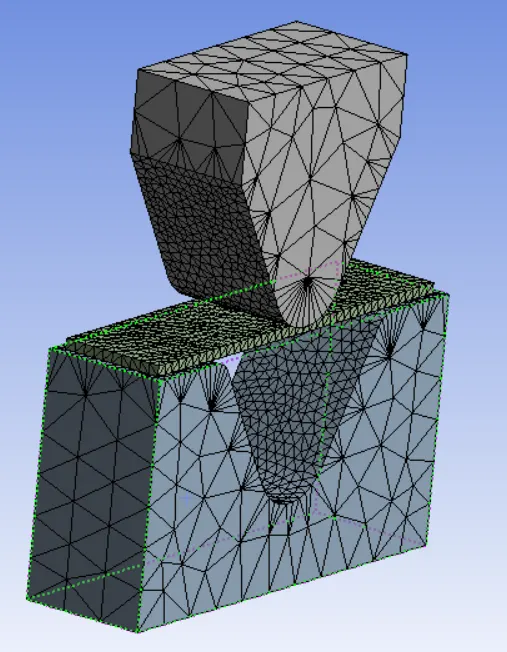
Fig.24: 3DMeshing of punch and Die
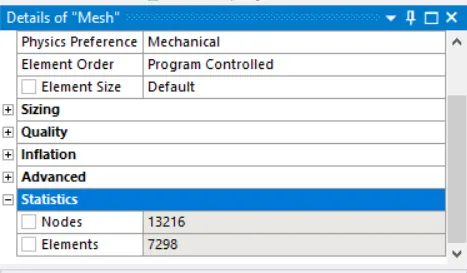
Fig.25: statistics of meshing
11. Analysis settings Change no. of steps as 10, auto time as program control, large deflection on, solver type as Direct, Non linear control-Stabilization as Constant,energy dissipation 0.1.
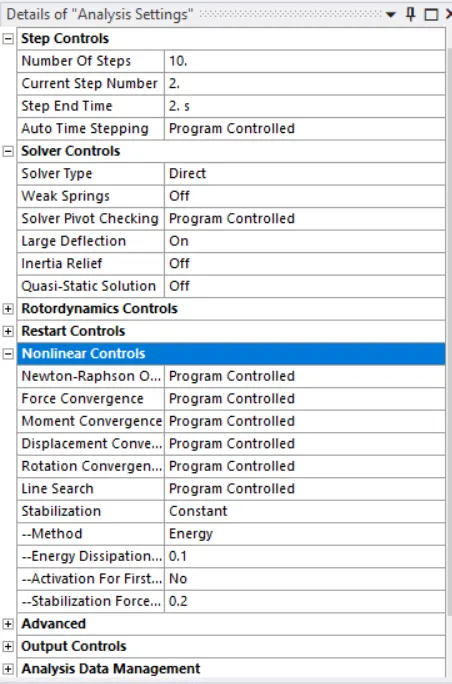
FIG 26: Analysis settings
12. Now request for the outputs such as equivalent stress, equivalent elastic strain, directional deformation in Y-Direction.
14. SOLVE the solution and we can see the simulation run under soluion information.
FIG 27: Solver output
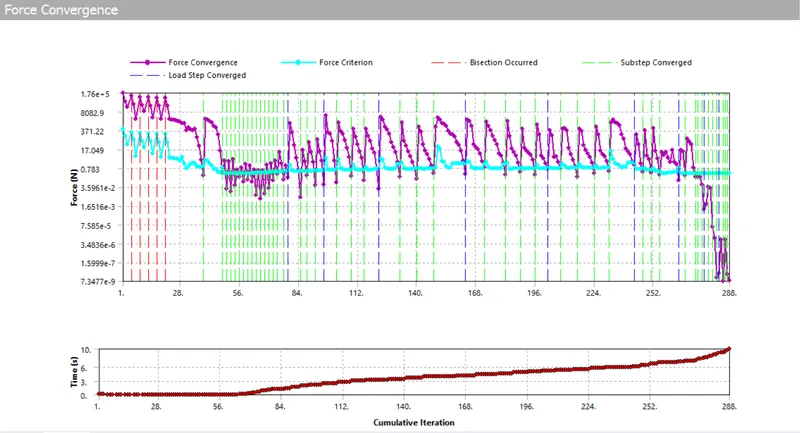
FIG.28 Force convergence
SIMULATION RESULT:
Simulation results for case-1 the material used for the model are Aluminium Alloy 1199, Copper Alloy NL and Magnesium Alloy NL. To find out the Equivalent stress, Equivalent elastic strain and Total Deformation in Y direction and compare the results for the three materials.
1.Aluminium Alloy 1199:
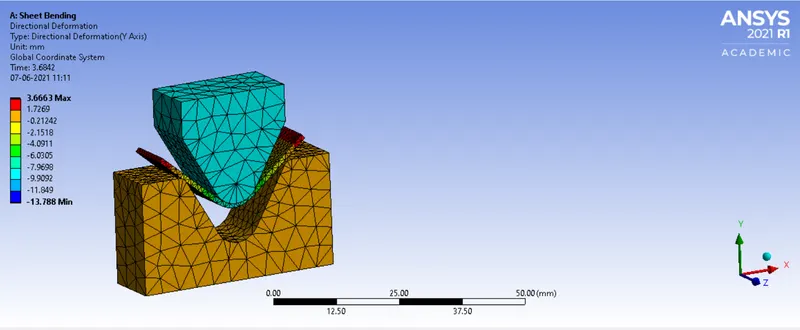
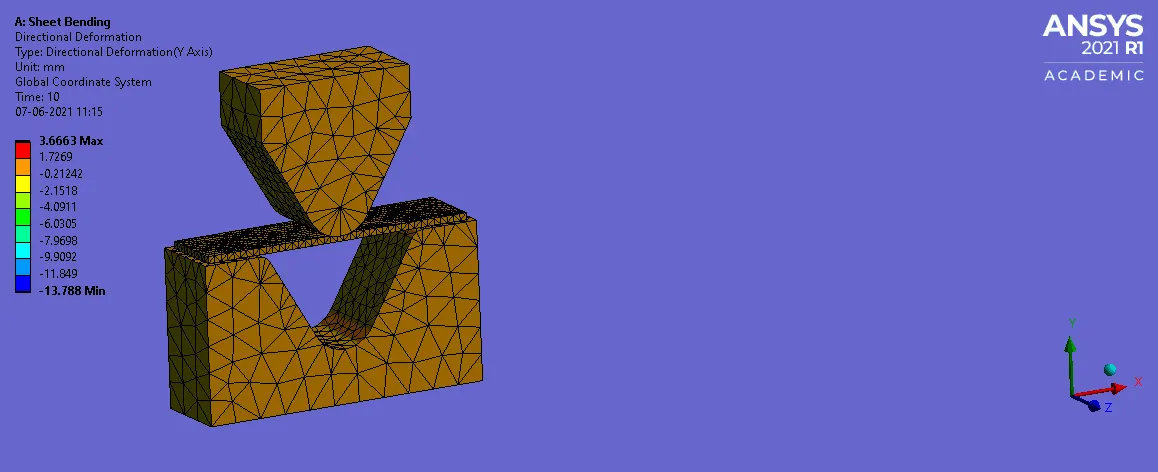
FIG: 29 DIRECTIONAL DEFORMATION (Y-Axis)
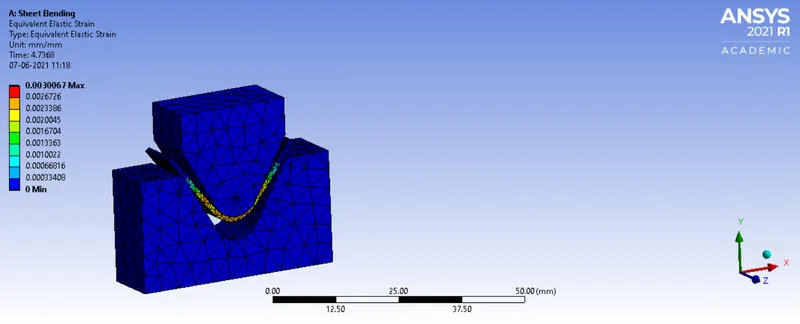
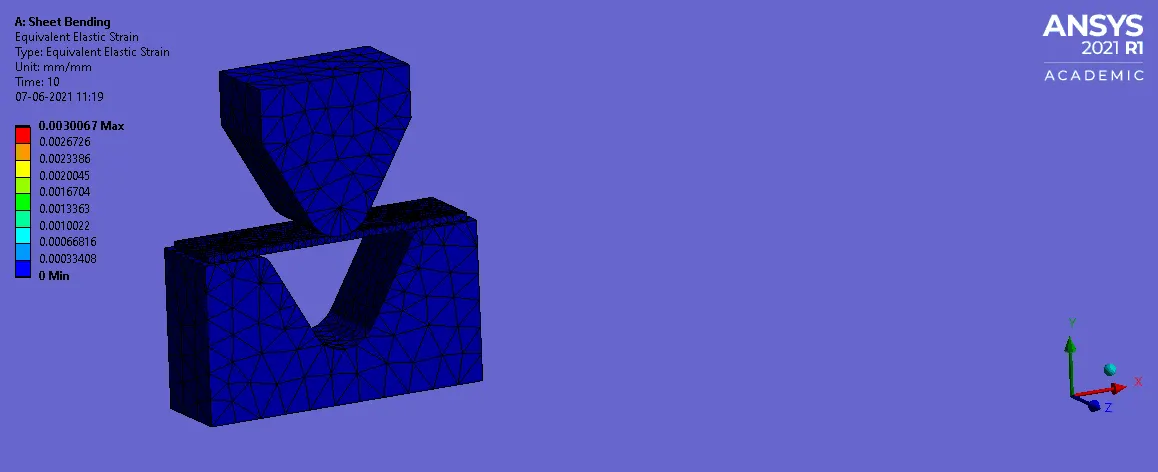
Fig 30: Equivalent Elastic Strain
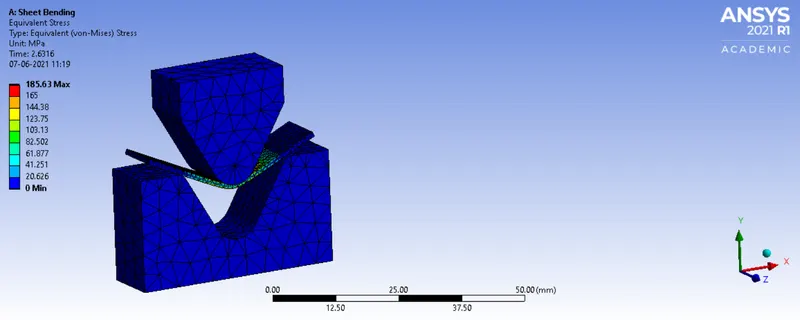
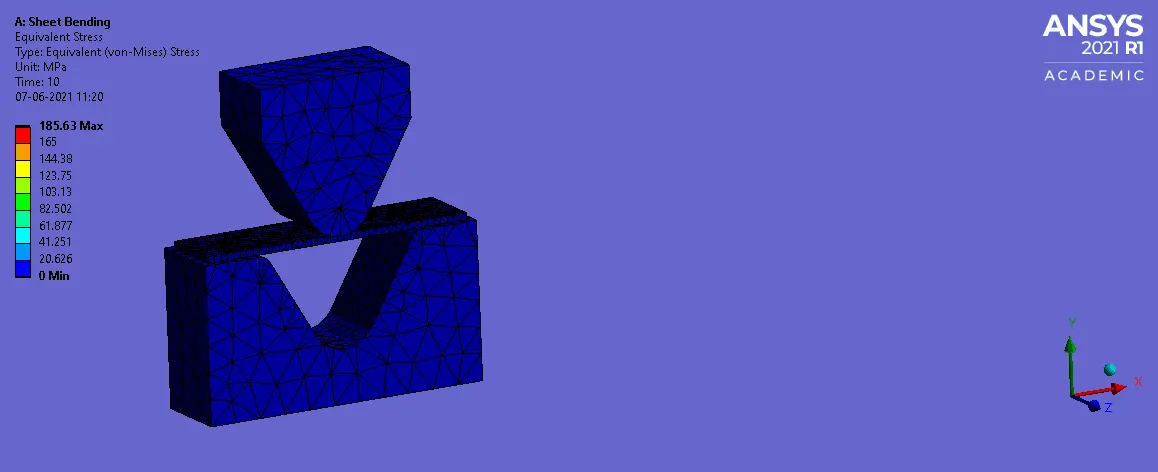
Fig 31: Equivalent Stress
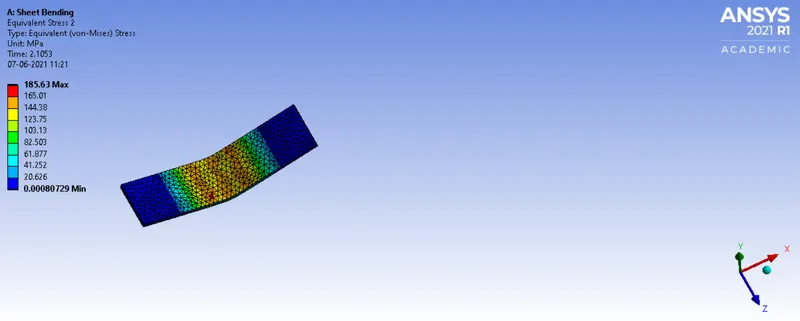
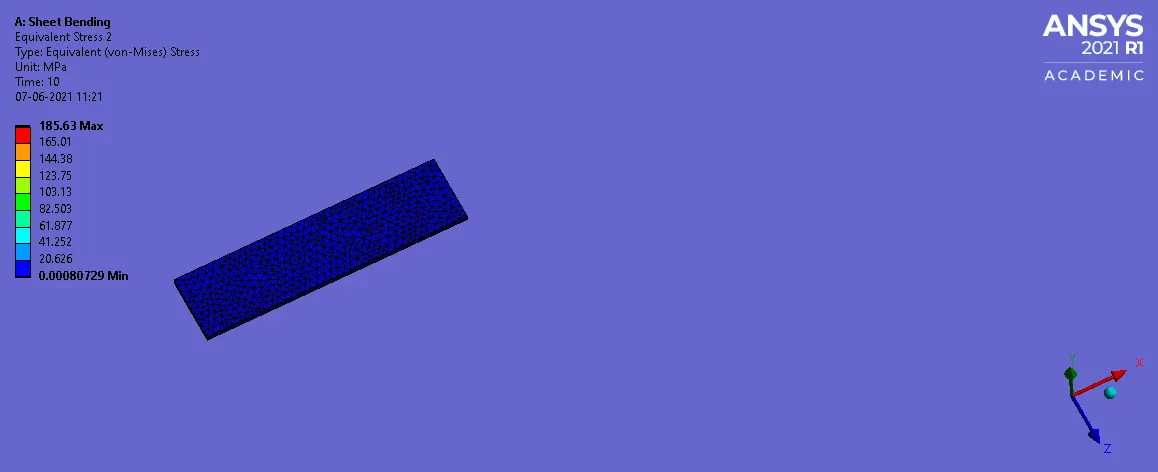
Fig 32: Equivalent Stress of sheet metal
2.Copper Alloy NL
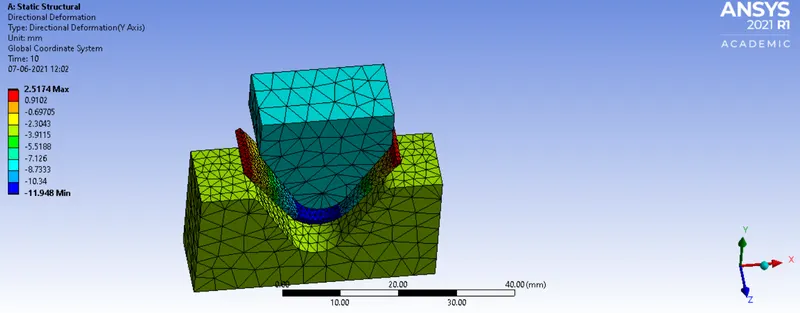
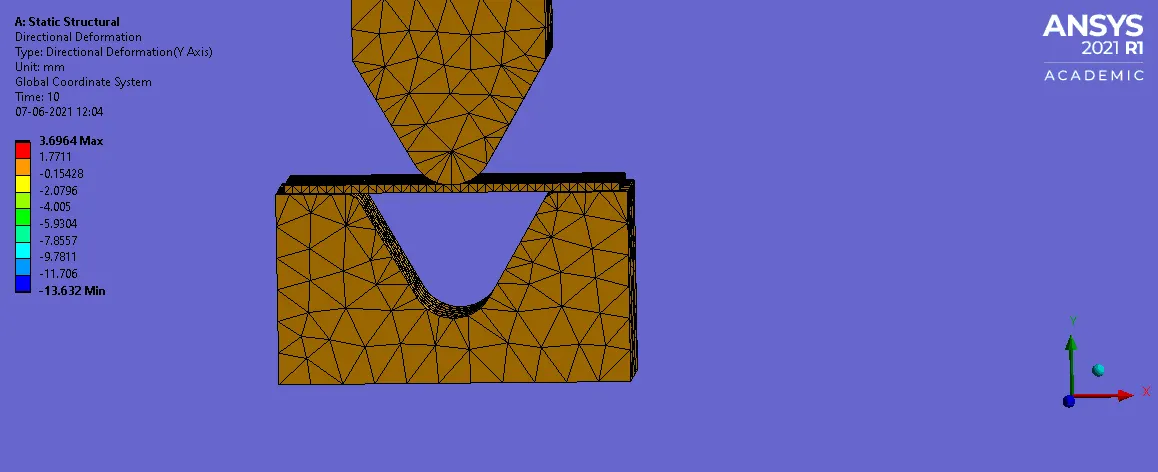
FIG: 33 DIRECTIONAL DEFORMATION (Y-Axis)
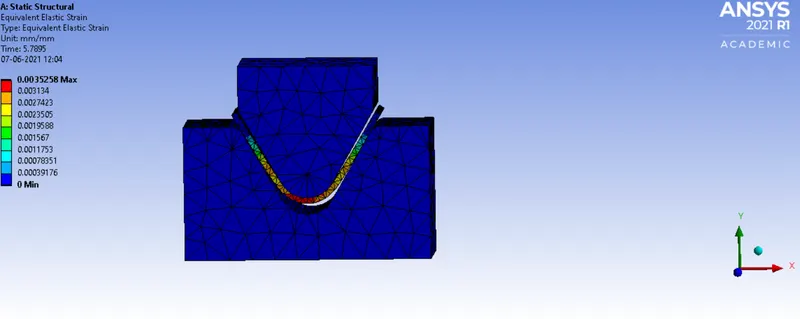
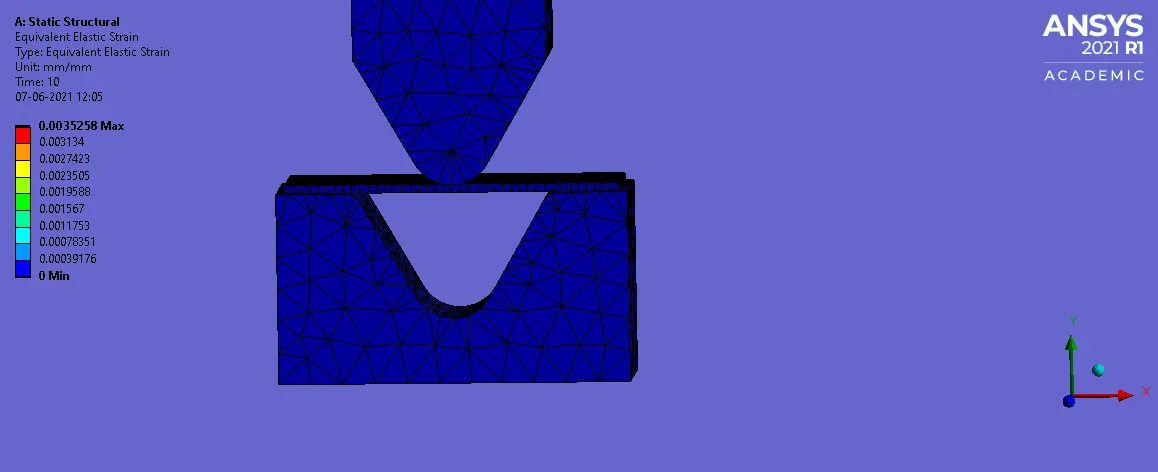
Fig 34: Equivalent Elastic Strain
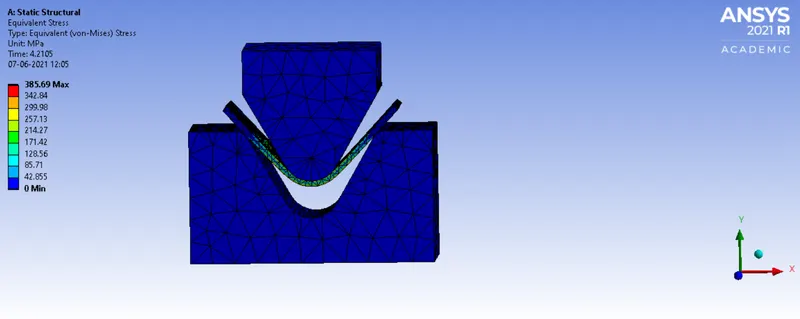
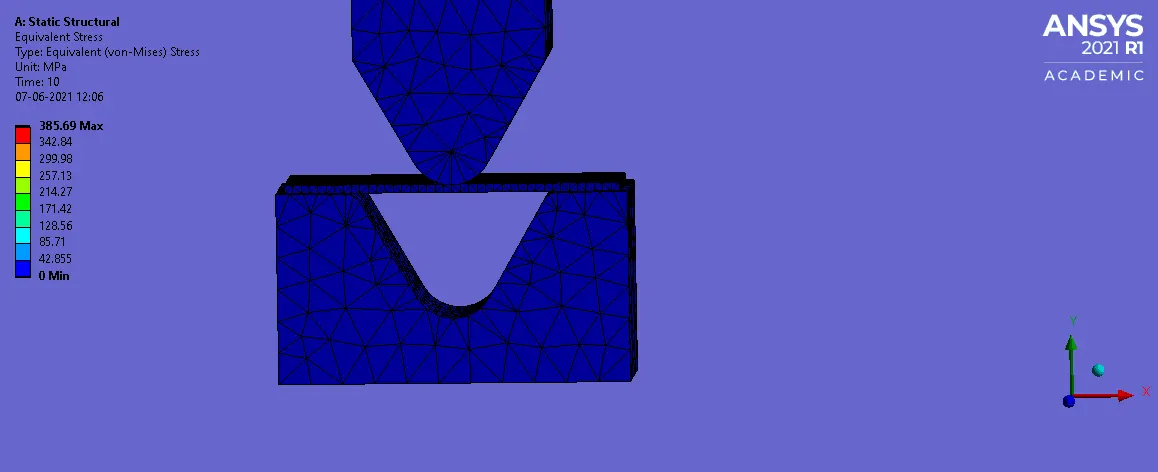
Fig 35: Equivalent Stress
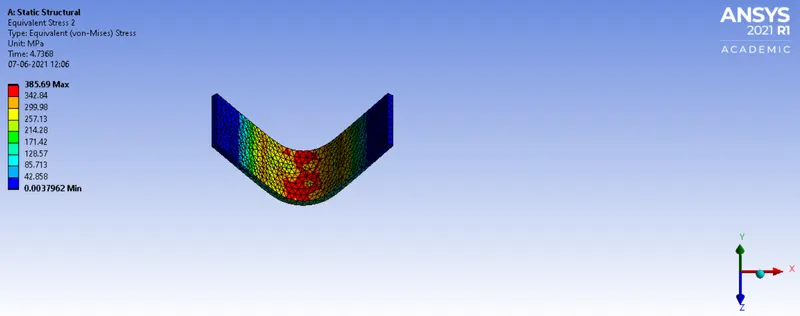
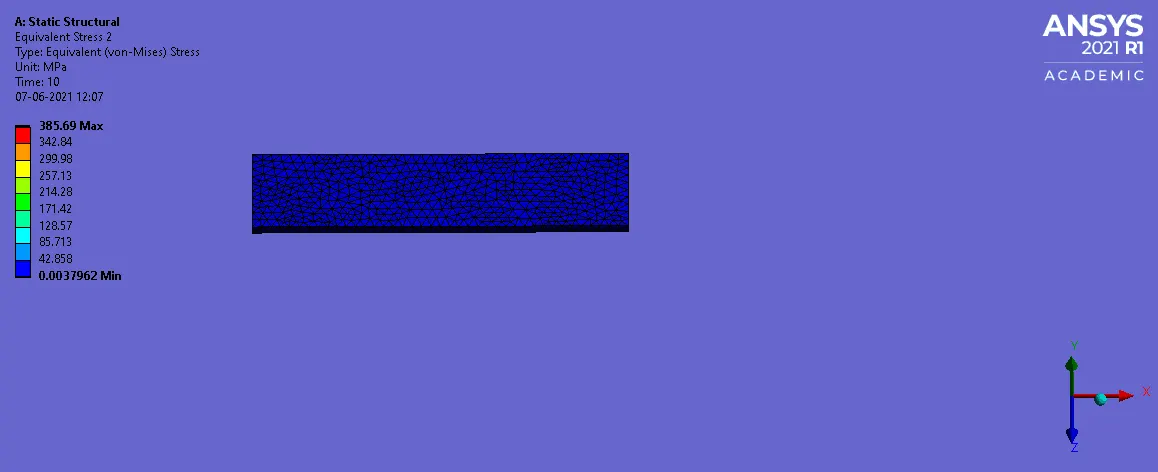
Fig 36: Equivalent Stress of sheet metal
Magnesium Alloy NL
Case 2:With the material as Aluminium Alloy, change the friction coefficient to 0.19 and run the analysis as mentioned in Case 1. Compare the results with that in case 1.
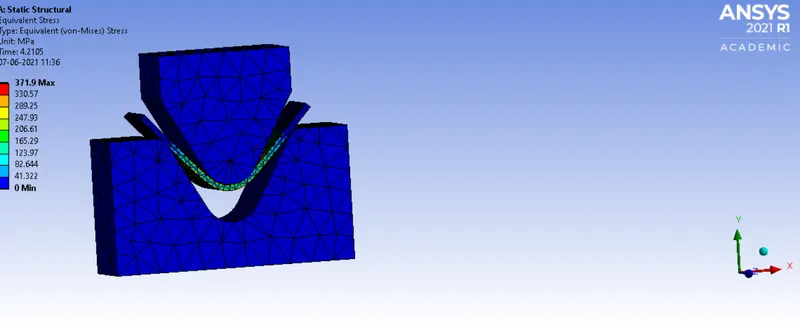
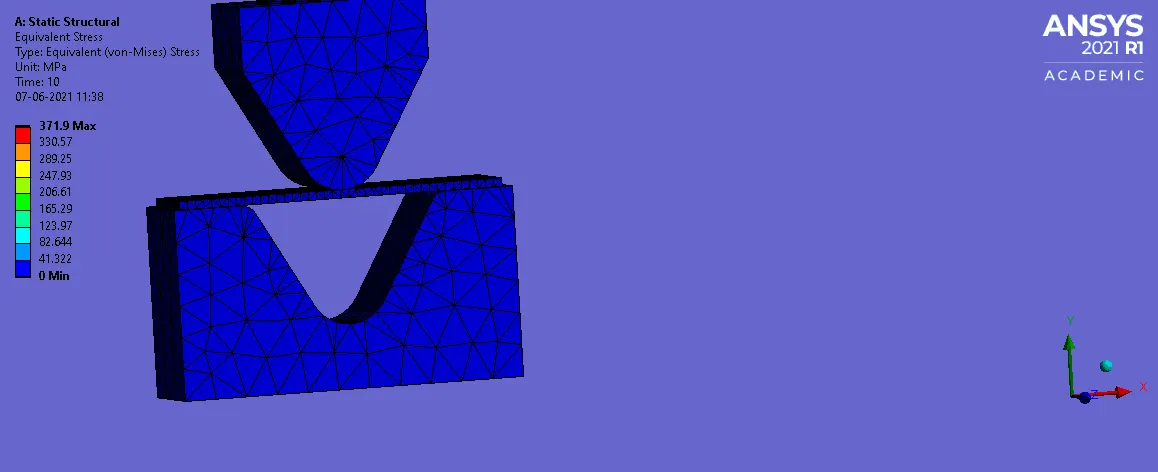
Fig 37: Equivalent Stress
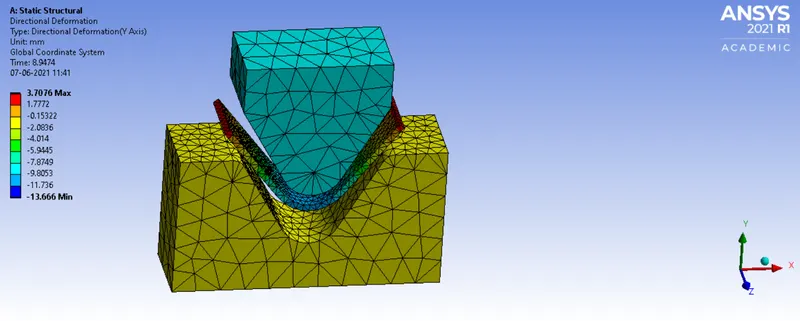
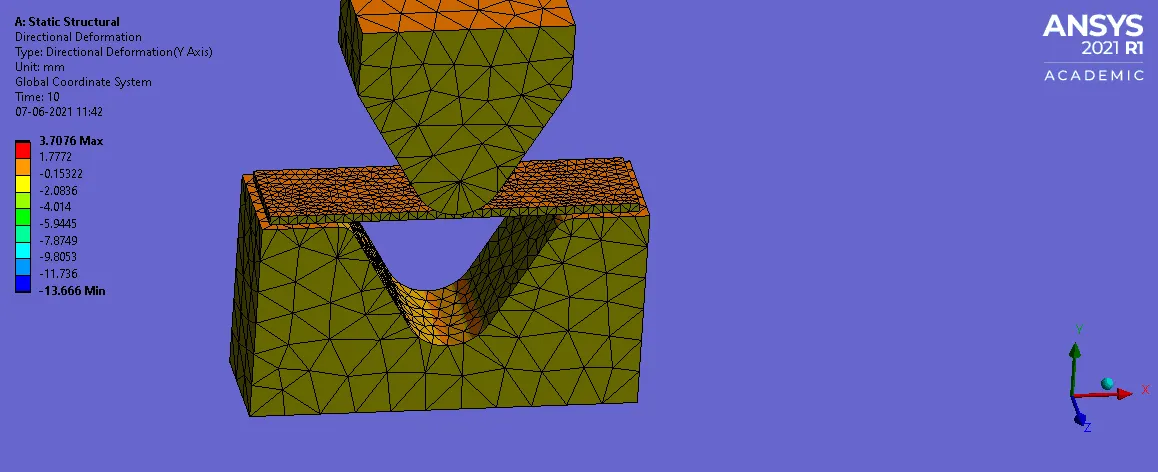
FIG: 38 DIRECTIONAL DEFORMATION (Y-Axis)
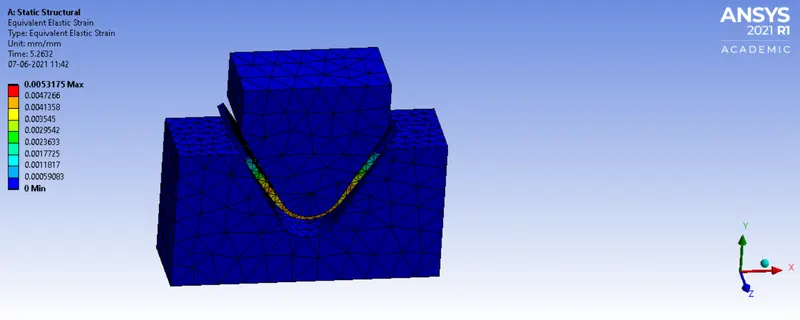
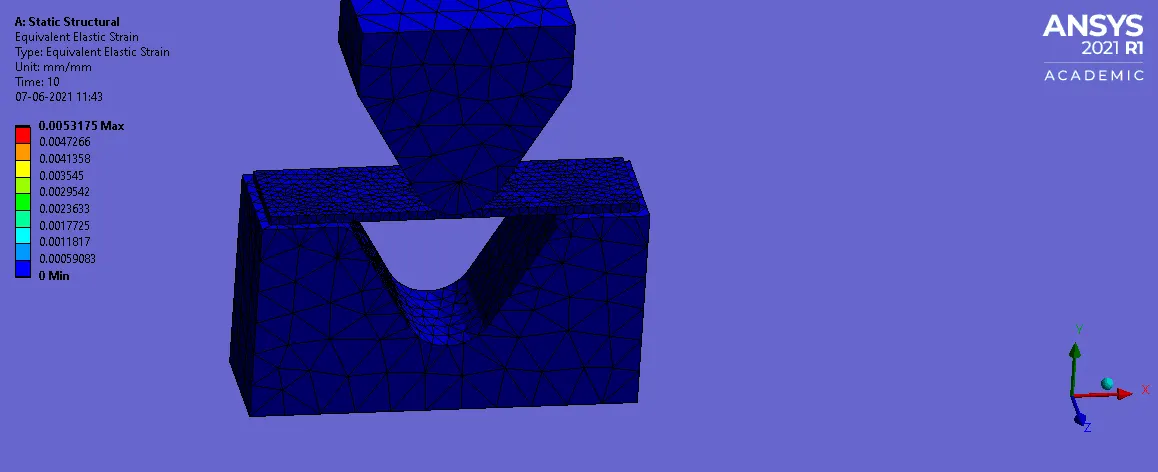
Fig 39: Equivalent Elastic Strain
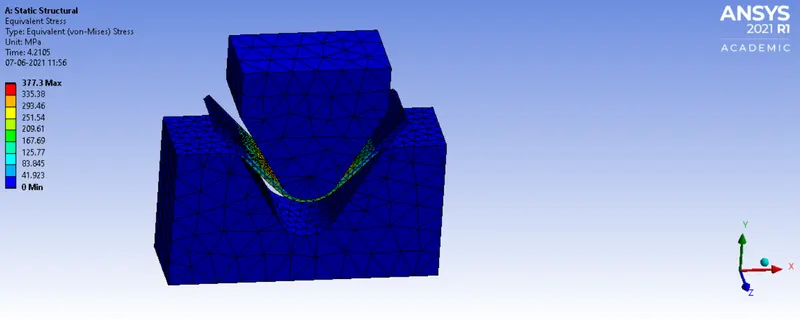
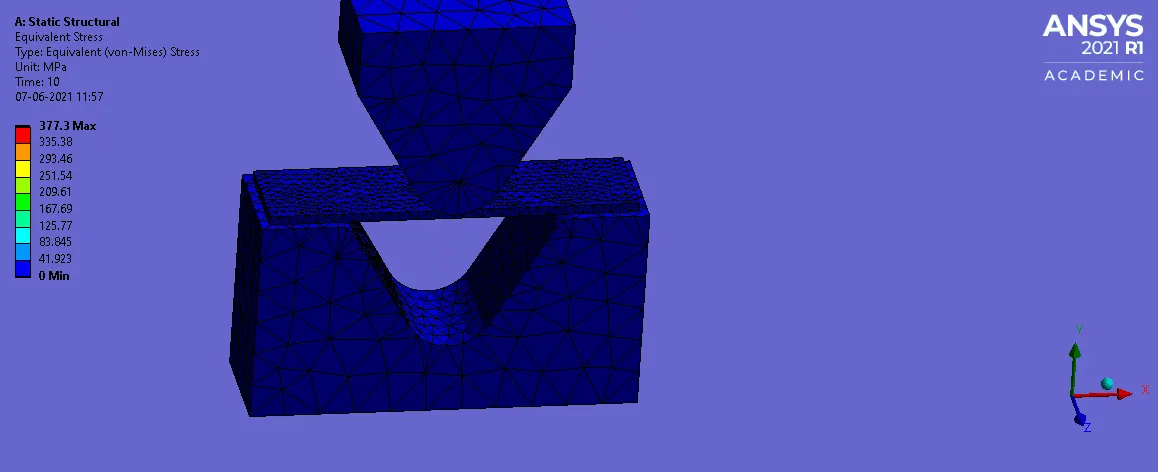
Fig 40: Equivalent Stress
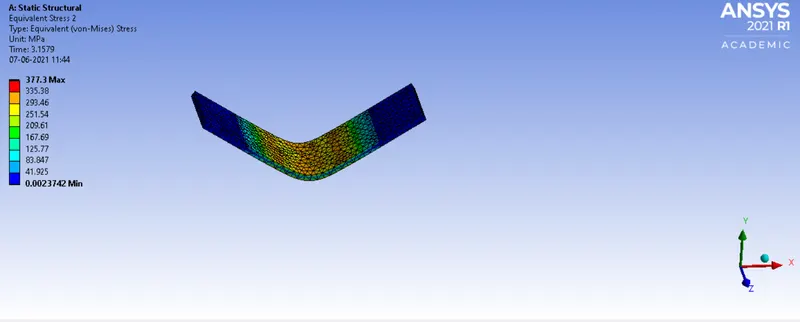
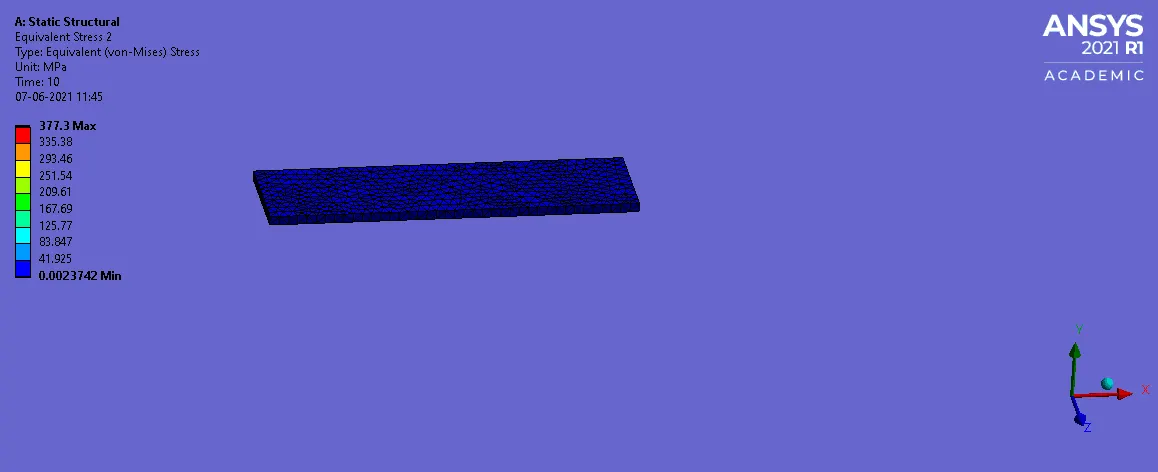
Fig 41: Equivalent Stress of sheet metal
Case 3: Refine the mesh on the plate such that it doesn't cross the academic limit. With Aluminium alloy as material, run the analysis as in Case 1 and compare the results.
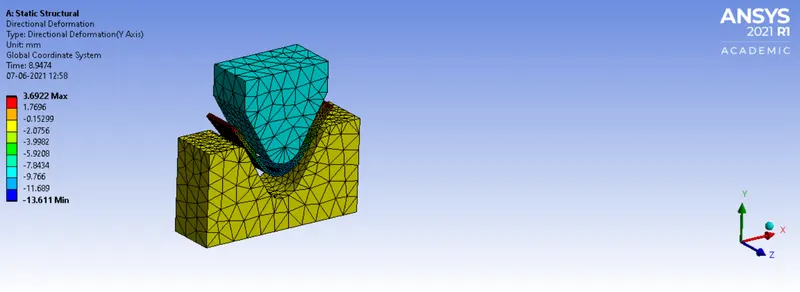
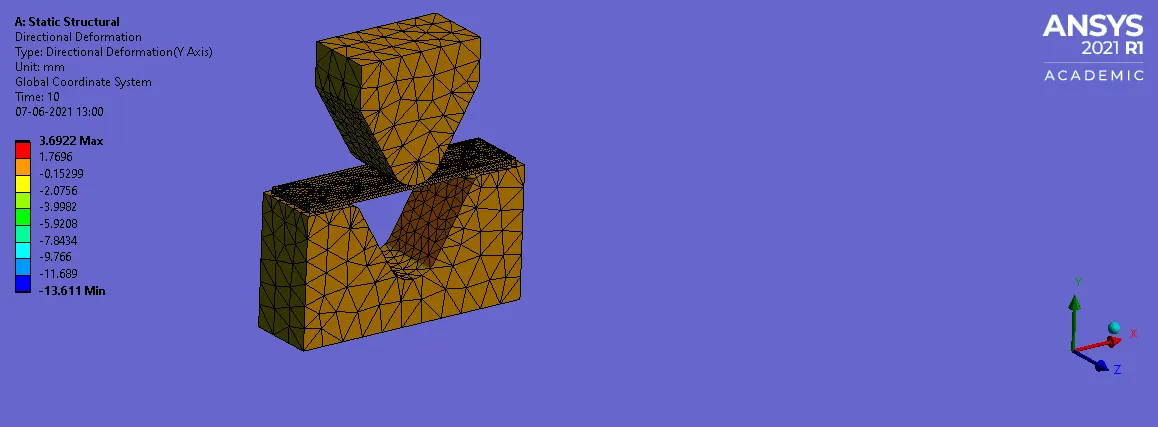
FIG: 42 DIRECTIONAL DEFORMATION (Y-Axis)
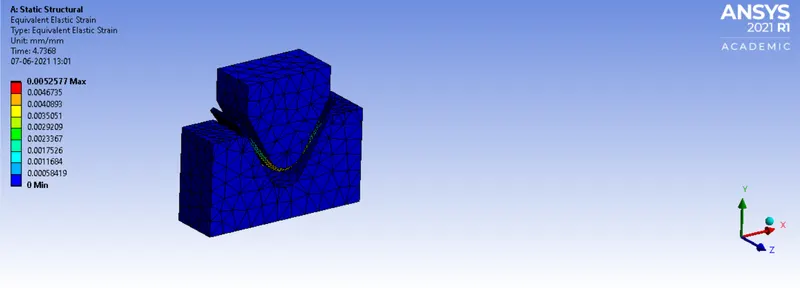
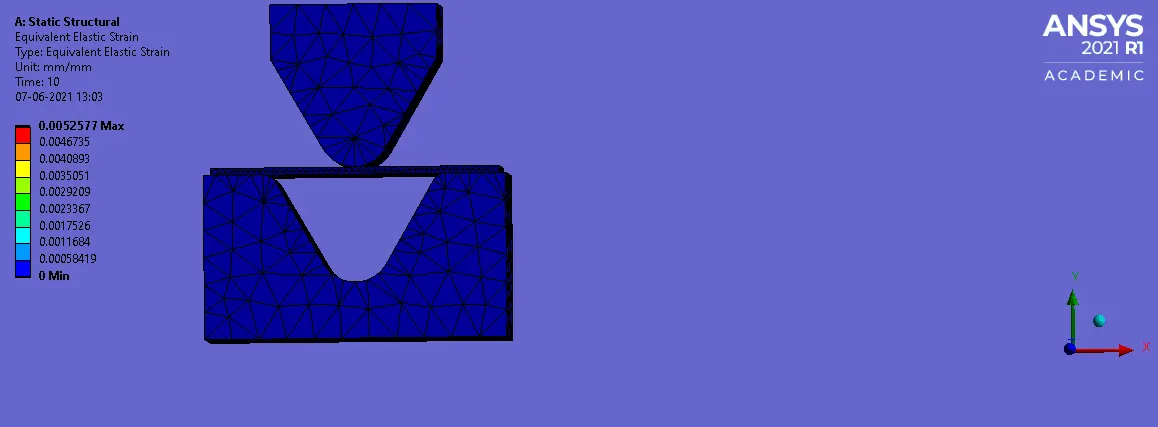
Fig 43: Equivalent Elastic Strain
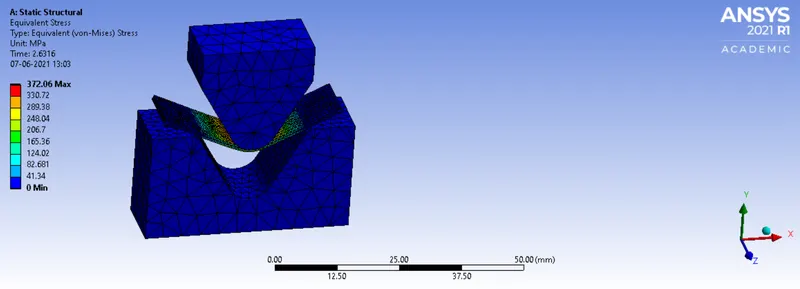
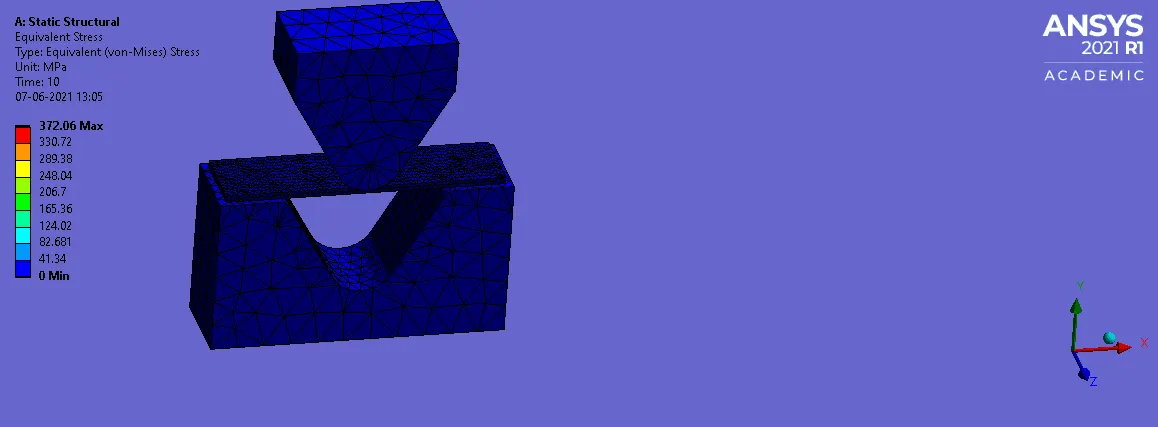
Fig 44: Equivalent Stress
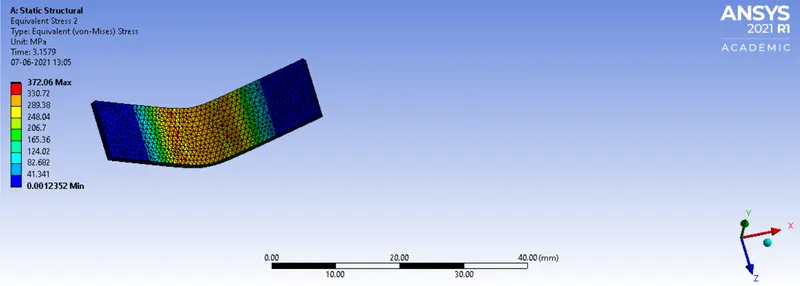
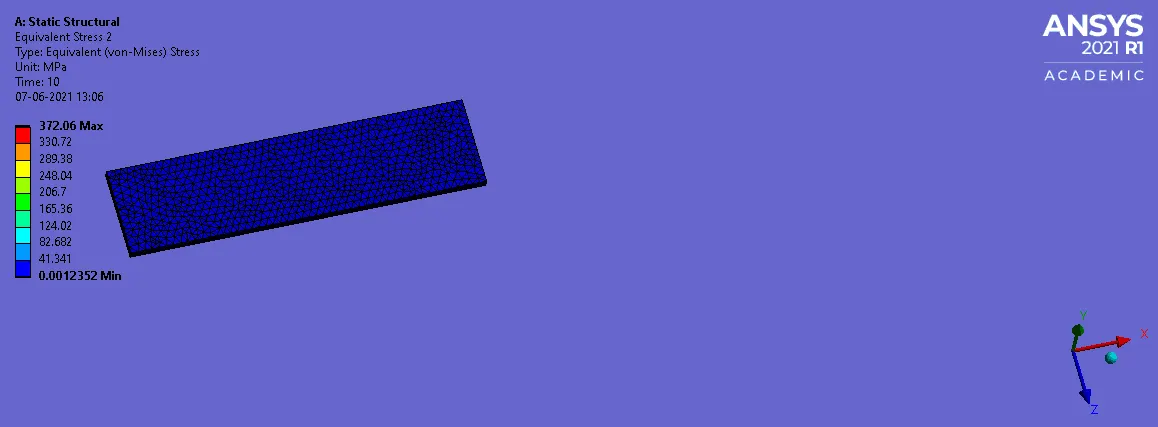
Fig 45: Equivalent Stress of sheet metal
Camparism of results:
CASE-1
| MATERIAL | DIRECTIONAL DEFORMATION (Y-AXIS) (mm) | EQUIVALENT ELASTIC STRAIN | EQUIVALENT STRESS (MPa) | STRESS IN PLATE(MPa) |
| ALUMINUM 1199 |
MAX: 3.6663 MIN: -13.788 |
MAX: 0.00300067 MIN: 0 |
MAX: 185.63 MIN: 0 |
MAX: 185.63 MIN: 0.00080729 |
| COPPER |
MAX: 3.6964 MIN: -13.632 |
MAX: 0.0035258 MIN: 0 |
MAX: 385.69 MIN: 0 |
MAX: 385.69 MIN: 0.0037962 |
| MAGNESIUM |
MAX: 3.7467 MIN: -13.608 |
MAX: 0.0061118 MIN: 0 |
MAX: 273.77 MIN: 0 |
MAX: 273.77 MIN: 0.002106 |
The above tabular data shows the variations in the equivalent stress, equivalent elastic strain and directional deformation of various material such as Aluminium 1199, Copper and Magnesium. Copper material experiences more stress, aluminum 1199 material experiences less stress and magnesium experiences more directional deformation, aluminum 1199 experiences less directional deformation. And magnesium experiences more equivalent elastic strain, aluminum 1199 experiences less more equivalent elastic strain.
CASE-2 With the material as Aluminium Alloy, change the friction coefficient to 0.19 and run the analysis as mentioned in Case 1. Compare the results with that in case 1.
| MATERIAL | DIRECTIONAL DEFORMATION (Y-AXIS) (mm) | EQUIVALENT ELASTIC STRAIN | EQUIVALENT STRESS (MPa) | STRESS IN PLATE(MPa) |
| ALUMINUM with coefficient of Friction as 0.1 |
MAX: 3.7085 MIN: -13.727 |
MAX: 0.0052557 MIN: 0 |
MAX: 371.9 MIN: 0 |
MAX: 371.9 MIN: 0.0029899 |
| ALUMINUM with coefficient of Friction as 0.19 |
MAX: 3.7076 MIN: -13.666 |
MAX: 0.0053175 MIN: 0 |
MAX: 377.3 MIN: 0 |
MAX: 377.3 MIN: 0.0023742 |
| MATERIAL | DIRECTIONAL DEFORMATION (Y-AXIS) (mm) | EQUIVALENT ELASTIC STRAIN | EQUIVALENT STRESS (MPa) | STRESS IN PLATE(MPa) |
| ALUMINUM 1199 |
MAX: 3.6663 MIN: -13.788 |
MAX: 0.00300067 MIN: 0 |
MAX: 185.63 MIN: 0 |
MAX: 185.63 MIN: 0.00080729 |
| COPPER |
MAX: 3.6964 MIN: -13.632 |
MAX: 0.0035258 MIN: 0 |
MAX: 385.69 MIN: 0 |
MAX: 385.69 MIN: 0.0037962 |
| MAGNESIUM |
MAX: 3.7467 MIN: -13.608 |
MAX: 0.0061118 MIN: 0 |
MAX: 273.77 MIN: 0 |
MAX: 273.77 MIN: 0.002106 |
Case 3: Refine the mesh on the plate such that it doesn't cross the academic limit. With Aluminium alloy as material, run the analysis as in Case 1 and compare the results.
| MATERIAL | DIRECTIONAL DEFORMATION (Y-AXIS) (mm) | EQUIVALENT ELASTIC STRAIN | EQUIVALENT STRESS (MPa) | STRESS IN PLATE(MPa) |
| ALUMINUM |
MAX: 3.6922 MIN: -13.611 |
MAX: 0.0052577 MIN: 0 |
MAX: 372.06 MIN: 0 |
MAX: 372.06 MIN: 0.0012352 |
CONCLUSION:
From the above result copper material experiences more stress when compared with other two material. In case 2 with coefficient of friction as 0.19 experiences more stress, so the higher value of coefficient of friction will results with higher value of output, where as in case 3 refining the element size as 0.8, keeping tthe academic version limit, by performing grid dependency test there will be a better aprroximation in the result. Using the optimized element size is better than that of further reducing the element size will consumes more time and high cost.
LINK: https://drive.google.com/drive/folders/14lstfiDi0cy_eBVd5SkH-2xrnWYRg5yb?usp=sharing