Week 3 - External flow simulation over an Ahmed body.
1) Ahmed Body :
The Ahmed body is a simplified geometric model of a car that is often used as a standard test case for studying the aerodynamics of bluff bodies. The Ahmed body is characterized by a specific shape, including a slanted rear end, and it serves as a benchmark for assessing the accuracy and reliability of numerical simulation methods like CFD. Simulating the flow around the Ahmed body helps researchers and engineers understand the complex aerodynamic phenomena, such as separation, vortex shedding, and wake formation. The insights gained from CFD simulations of the Ahmed body contribute to the development of more aerodynamically efficient vehicles.
2) Negative pressure in Wake region :
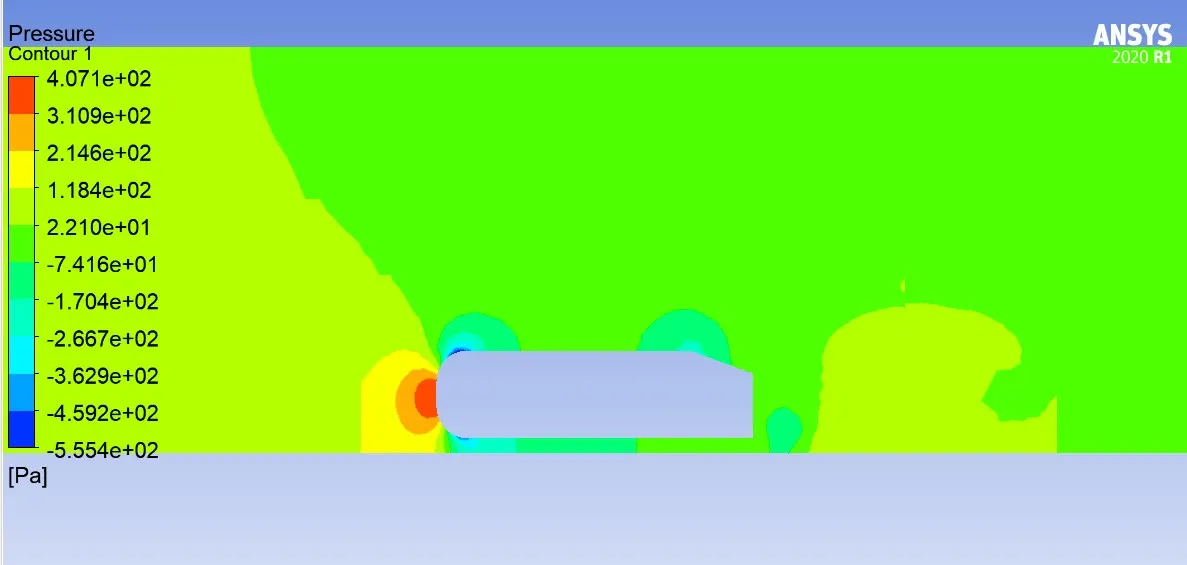
The negative pressure in the wake region is a result of the numerical solution of the Navier-Stokes equations, which govern fluid flow. As a fluid flows around an object in CFD, the velocity of the fluid changes, and according to Bernoulli's principle, changes in velocity are associated with changes in pressure. When the fluid accelerates over the surface of the object and then decelerates in the wake region, the pressure decreases. This pressure difference creates a low-pressure zone in the wake, often referred to as a negative pressure area. Understanding and predicting this negative pressure in CFD simulations are crucial for assessing the aerodynamic performance of a given geometry.
3) Significance of Wake region :
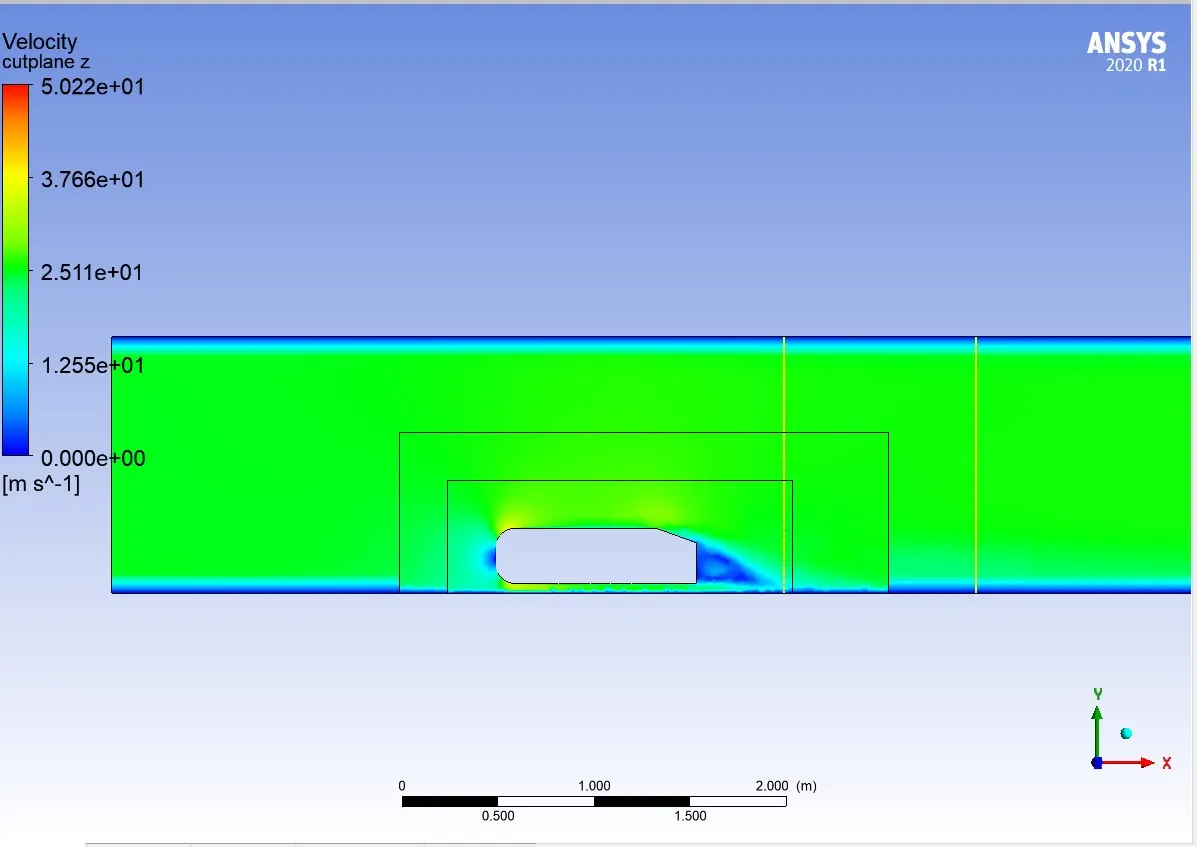
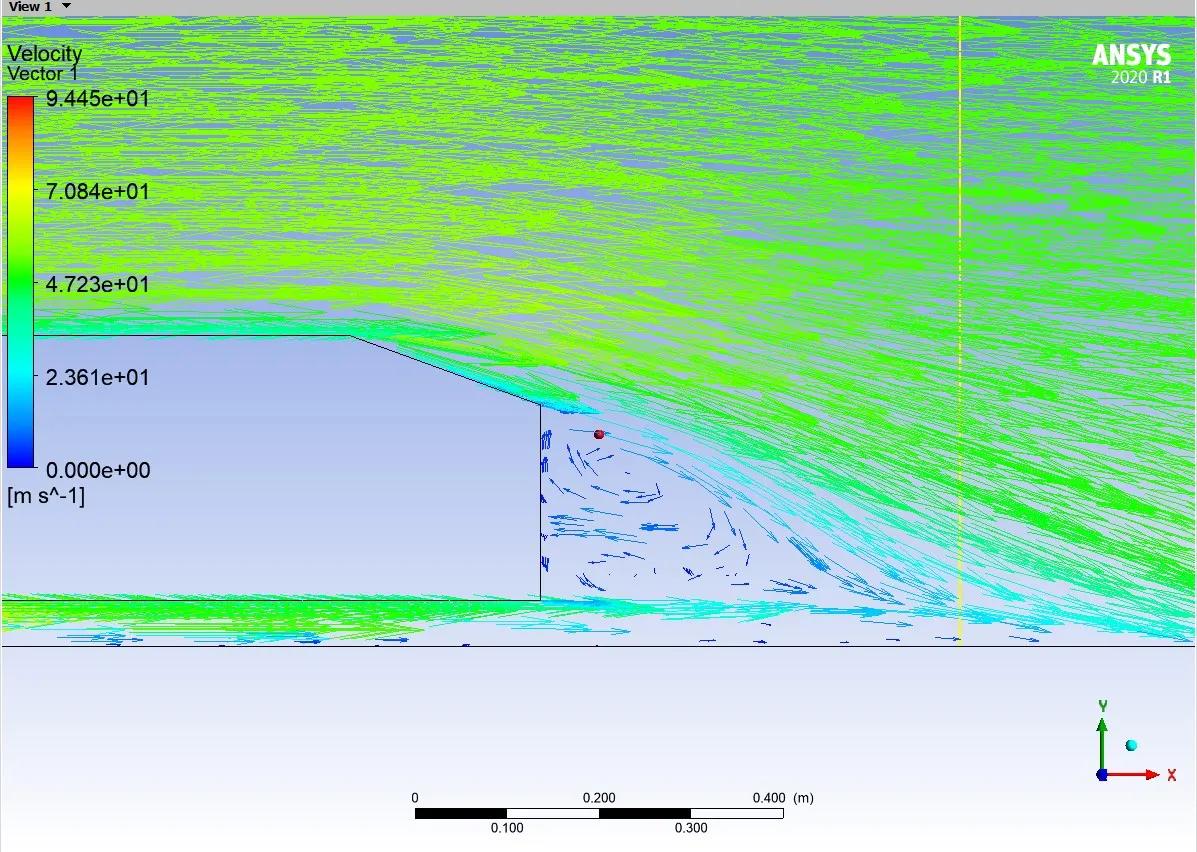
Point of separation is a critical parameter that indicates where the fluid flow transitions from attached to detached on the surface of an object. The accurate prediction of the point of separation is essential for capturing the separation-induced phenomena, such as the formation of vortices and the development of turbulent wake regions. The point of separation directly influences the pressure distribution and drag force on the object. In CFD studies, optimizing the prediction of the separation point helps engineers and researchers design more aerodynamically efficient shapes by controlling and minimizing separation, reducing drag, and improving overall performance
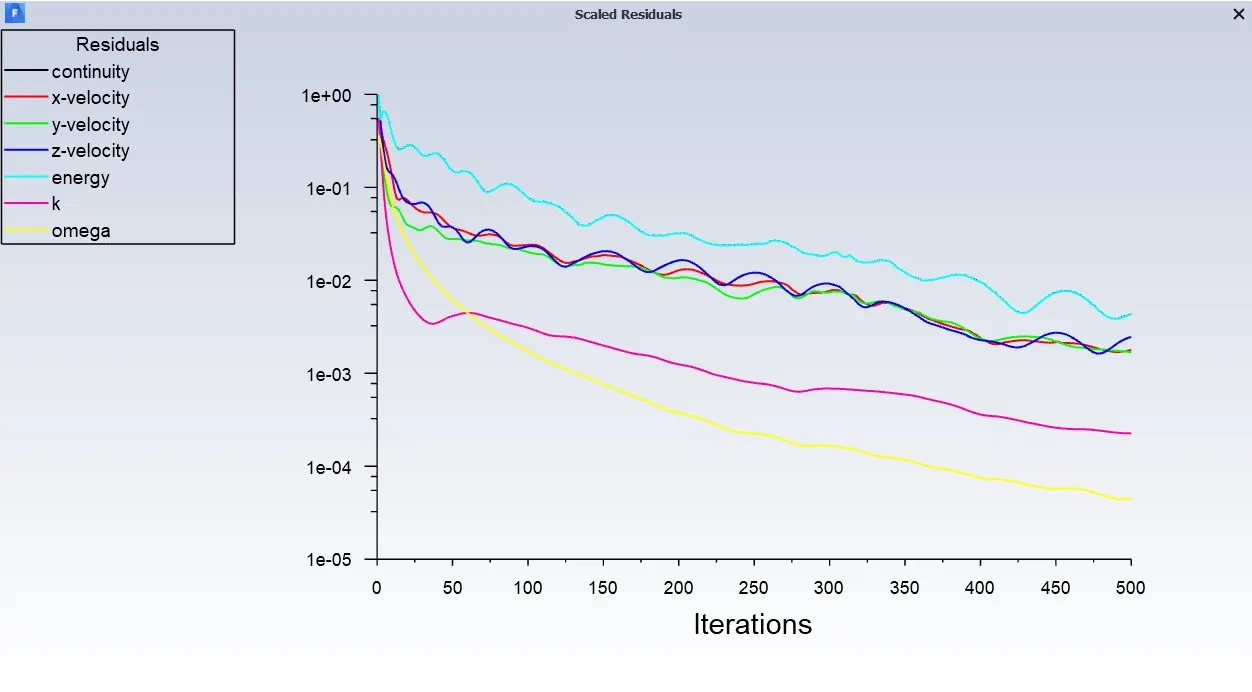
Residual Plot :
Velocity Contour :
Pressure Contour :
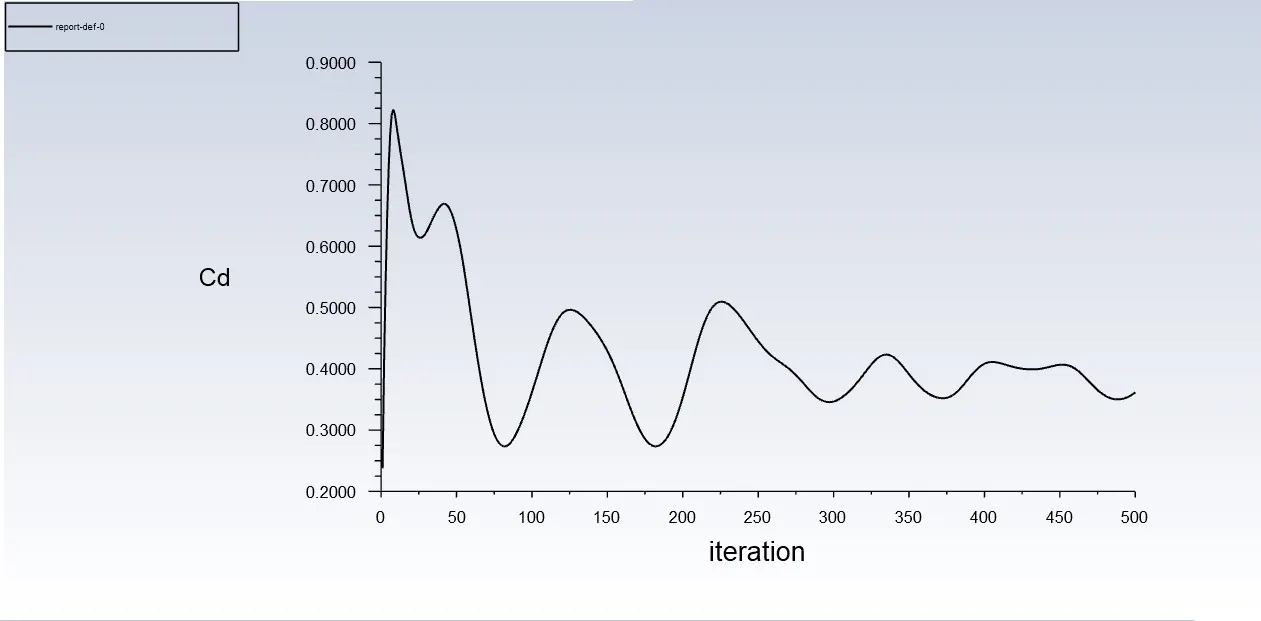
Plot for Drag coefficient :
Vector Plot :
Grid Independency test :
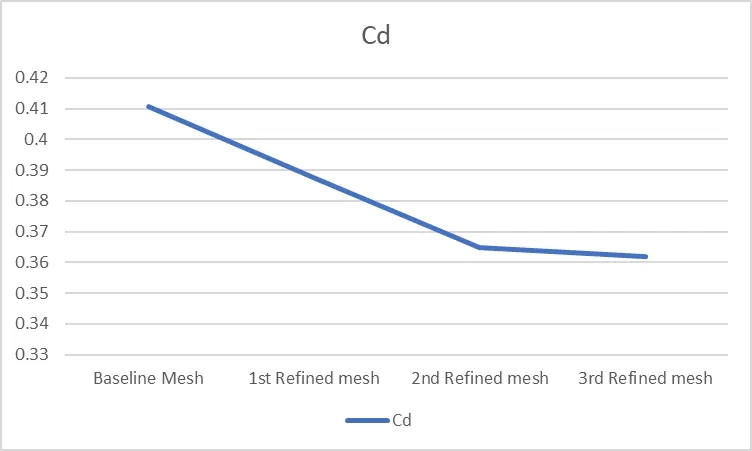
Baseline Mesh:
Number of Elements: 83,781
Drag Coefficient (Cd): 0.4107
This represents the initial or baseline simulation with a relatively coarse mesh.
1st Refined Mesh:
Number of Elements: 193,975
Drag Coefficient (Cd): 0.3877
Upon refining the mesh (increasing the mesh resolution), there is a decrease in the drag coefficient. This suggests that the simulation results are sensitive to the mesh resolution, and refining the mesh has a noticeable impact on the drag force prediction.
2nd Refined Mesh:
Number of Elements: 220,592
Drag Coefficient (Cd): 0.36472
Further refinement of the mesh leads to a continued decrease in the drag coefficient. The trend indicates that the simulation results are still changing with increased mesh resolution.
3rd Refined Mesh:
Number of Elements: 376,418
Drag Coefficient (Cd): 0.361783
The third level of mesh refinement results in a slightly lower drag coefficient. At this point, it's essential to assess whether the change in the drag coefficient is within an acceptable range, indicating that further mesh refinement may not significantly impact the results.
Conclusion :
- The trend of decreasing drag coefficient with mesh refinement suggests that the simulation results are sensitive to the level of mesh resolution.
- The choice of mesh resolution is a trade-off between accuracy and computational cost. It's crucial to determine whether the level of refinement is sufficient for achieving accurate results without unnecessary computational expense.
- Conducting a grid independence study helps establish confidence in the simulation results by demonstrating that the key aerodynamic parameters have stabilized with respect to mesh resolution.
- Analyzing additional factors such as flow patterns, pressure distributions, and other aerodynamic coefficients (lift, side force) can provide a more comprehensive understanding of the simulation's sensitivity to mesh resolution.
- The presented results indicate a descreasing trend in drag coefficient with increasing mesh refinement. The descision on the appropriate mesh resolution should consider both the observed trends and computational efficiency.