Week 3 - External flow simulation over an Ahmed body.
Objective:
1. To perform grid dependency test
2. T plot Velocity and pressure contours.
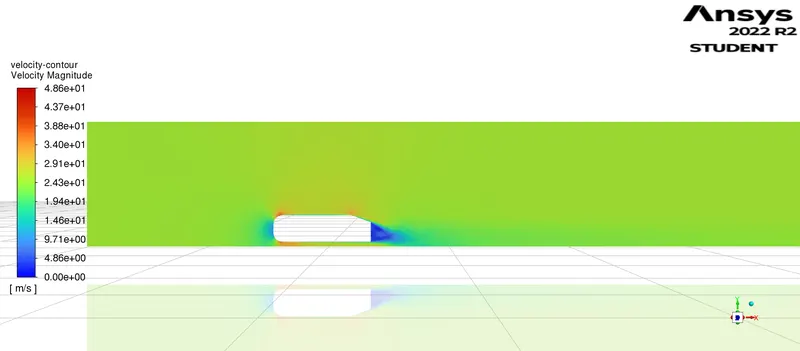
3. The plot velocity vector plot clearly showing the wake region.
4. To obtain coefficient Drag & Lift
Ahmed body
Ahmed Body was one such generic bluff body proposed to study the external aerodynamics of the vehicles. The flow over the geometrically simple Ahmed reference body is used for the validation case for numerical simulations and it still continues a challenge numerical algorithms and turbulence modeling due to its complex three dimensional wake vortex interaction. The Ahmed body is a simplified car-shaped made-up of a parallelepiped with rounded edges at the front and a slanted face at the rear. The slant at the rear side of the vehicle causes the separation of flow and also a significant factor for drag forces of Ahmed body.The Ahmed Body was first created by S.R. Ahmed in his research “Some Salient Features of the Time-Averaged Ground Vehicle Wake” in 1984. Since then, it has become a benchmark for aerodynamic simulation tools. The simple geometrical shape has a length of 1.044 meters, height of 0.288 meters, and a width of 0.389 meters. It also has 0.5-meter cylindrical legs attached to the bottom of the body and the rear surface has a slant that falls off at 40 degrees.
The flow for this model is turbulent, which is based on the Reynolds number determined by the body length and inlet velocity. The simulation solves for the turbulent kinetic energy in addition to the velocity field. For this simulation, we need a larger mesh size than what is usually common to resolve the turbulent flow. More specifically, we use a finer mesh downstream of the model to capture the wake zone.The simulation solves for the turbulent kinetic energy and dissipation in addition to the velocity and pressure fields.
Importance of Ahmed body
The three-dimensional flow around a vehicle has become a subject of significant importance in the automotive industry. One apparent technique of improving the fuel efficiency of a vehicles is to reduce aerodynamic drag force by optimizing the body shape. Execution of fine aerodynamic design under stylistic constraints requires an immense understanding of the flow pattern phenomena and, especially, how the aerodynamics are impacted by changes in body shape. The flow area which is presents the major contribution to a cars drag is the wake flow backing the vehicle. The point at which the flow separates directs the size of the separation zone, and as a result the drag force. Clearly, a more accurate simulation of the wake flowand of the separation process is required for the accuracy of drag forecast
Negative pressure in Wake Region
When the air moving over the vehicle is separated at the rear end, it leaves a large low pressure turbulent region behind the vehicle known as the wake. This wake contributes to the formation of pressure drag, which is eventually reduces the vehicle performance.
The region of recirculating flow immediately behind a moving or stationary blunt body, caused by viscosity, which may be accompanied by flow sepration and turbulence flow, or the wave pattern on the water surface downstream of an object in a flow, or produced by a moving object (e.g. a ship), caused by density differences of the fluids above and below the free surface and gravity.
When the vehicle is moving at a certain velocity, the viscous effects in the fluid are restricted to a thin layer called boundary layer. Outside the boundary layer is the inviscid flow. This fluid flow imposes pressure force on the boundary layer. When the air reaches
the rear part of the vehicle, the fluid gets detached. Within the boundary layer, the movement of the fluid is totally governed by the viscous effects of the fluid.The Reynolds number is dependent on the characteristic length of the vehicle, the kinematic viscosity and the speed of the vehicle. The fluid moving around the vehicle is dependent on the shape of the vehicle and the Reynolds number. There is another important phenomenon, which affects the flow of the car and the performance of the vehicle. This phenomenon is commonly known as ‘Wake’ of the vehicle. When the air moving over the vehicle is separated at the rear end, it leaves a large low-pressure turbulent region behind the vehicle known as the wake. This wake contributes to the formation of pressure drag, which is eventually reduces the vehicle performance.
Singnificance of the point of Sepration
Separation of flow is said to occur when the direction of the flow velocity near the surface is opposed to the direction of the free stream velocity, which means (du/dy) ≤ 0. Such a situation arises when there is a negative pressure gradient near the wall.
In the direction of flow the pressure increases which causes decreases in velocity and creates condition for separation to occur. It is important to note that, the skin-friction coefficient reaches the value zero. At this point the wall shear stress vanishes is called the separation point. Reverse flow takes place beyond point of separation. Due to reverse flow, irregular eddies are formed and lot of energy is dissipated. This region is called „Wake‟. The pressure distribution in the wake is quite different from that on the remaining boundary and this gives rise to an additional drag force on the body. Wake also leads to lateral vibration to the object which may be harmful. Also large amount of K.E. is lost.
In the turbulent boundary layer, some of the energy is dissipated in friction, slowing airflow velocity, resulting in a pressure increase. If the increase in pressure is gradual, the process of turbulent mixing will cause a transfer of energy from the fast moving eddies to slower ones in the turbulent boundary layer. If the rate of change in pressure is too great, for example in sharp corners, the mixing process will be too slow to push the slower air molecules moving. When this happens, the boundary layer flow stops following the contours of the surface, resulting in separation. Air particles downstream of the separation region will then move towards the lower pressure region in the reverse direction to the main
flow, the separation region will reattach. In the region between separation and reattachment points, air flow is circulating and this is called the „separation bubble Separation will normally occur if the resultant flow encounters a sharp edge and that is why it is always important for ground vehicles to have smoothly rounded edges everywhere.
Steps to run the simuation
1. Model is importated in to spaceclaim window
1. Drawn the bigger & smaller enclosure for better simulation on ahmed body
2. Check the interferance region
3. Use of option share topology for transfer information to each other
2. Open the Mesh window, name given to domain like(Inlet, outlet, symmtery, bottom wall,car wall )
1. Give element size & body sizing to bigger, small enclosure, car wall, car stand for coarse to finer mesh
2. Addition of inflatio layer to get accurate the solution near wall.
3. Open the Setup & solution window
1. Choose the Turbulence model like K-epsilon & k-omega model
2. Give the boudry condition like inlet velocity 25m/s, outlet zero guage pressure.
3. Prepare report Coefficient Drag, lift. Check the Y+ criteria
4. Open Result window
1. Plot the velocity & Pressure contour
2. Plot the velocity vector plot
5. Analysis of Coefficient Drag & lift , Wake region , Pressure distribution
OUTER ENCLOSER :
1. Right face is located at a distance of 5m from the right side face of Ahmed body along the X axis.
2. Left face is located at a distance of 2m from the left side face of Ahmed body along the X axis.
3. Top face of the encloser is at a distance of 1 m from the top side face of the Ahmed body along the Y axis.
4. The bottom face of the encloser is attached to the bottom face of the Ahmed body along the YZ plane.
5. The front and back face of the encloser is at a distance of 0.5 m along the Z axis.
INNER ENCLOSURE
- Right face is located at a distance of 1 m from the right side face of Ahmed body along the X axis.
- Left face is located at a distance of 0.5 m from the left side face of Ahmed body along the X axis.
- Top face of the encloser is at a distance of 0.5m from the top side face of the Ahmed body along the Y axis.
- The bottom face of the encloser is attached to the bottom face of the Ahmed body along the YZ plane.
- The front and back face of the encloser is at a distance of 0.26 m along the Z axis.
SOLVER SETUP:
We are using K-E model as viscous property and taking the initial Velocity as 25m/s. Pressure based solver and steady state simulation is to be generated ,We are going to observe the Velocity & Pressure contours to estimate the results and which can be useful in further future modefication
INTERFERENCE REGION :-
Initially there was a huge interference between the Outer and Inner encloser so that the mesh gets overlapped which gets not acceptable so to avoid this we made share topology and get deleted the Interference region that by using the interference command after this we get a good interaction between the Inner and Outer enclosers so that we can get the mesh properly and also share the boundaries.
MESHING :
In this meshing we can assign the named selection for Inlet,Outlet,Symmetry wall and Car Wall,We can use the different type of meshing process for this model.
In this we follow three stages,
1. Meshing will be done for the outer enclouser choosen as a method of the Multizone and this will create the Hexa mesh,The element size used for this is 100 mm.
2.Next for inner enclouser we choose body sizing method to make more refinement,the element size we use for this is 10 mm.
3.Next we select the face sizing method to select the legs of the body to capture them with better refinement,we take the element length as 5 mm.
4.Next to capture the flow over the body we make the inflation layer which helps us in caputuring the flow very finer way and the mesh will also be capture along the body perfectly.We take the number of inflation layers as 10, First layer thickness thickness value as 0.4 mm.
5. The total number of cell count in this setup is going to be around 4lakh approximately which is our first case for the mesh independence study . (Exact number of elements after doing all the refinement is - 396714.)
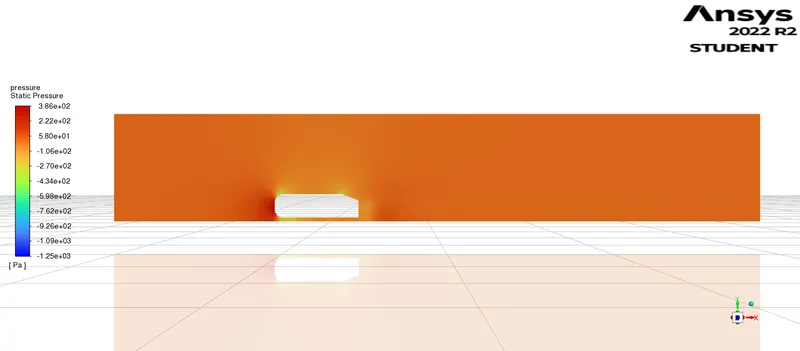
Results generated from this mesh setup are as follows.
1. Velocity Contour
2. Pressure contour
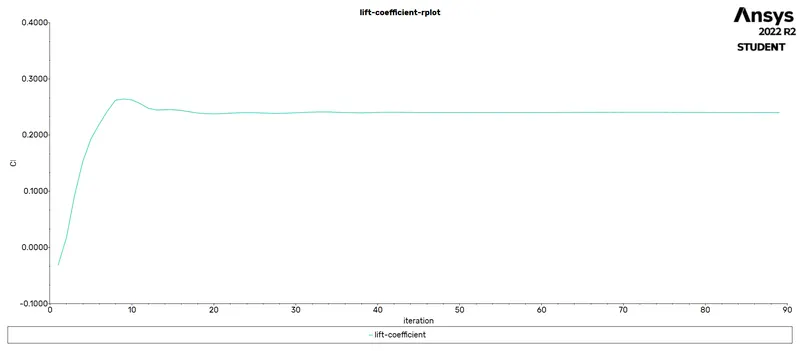
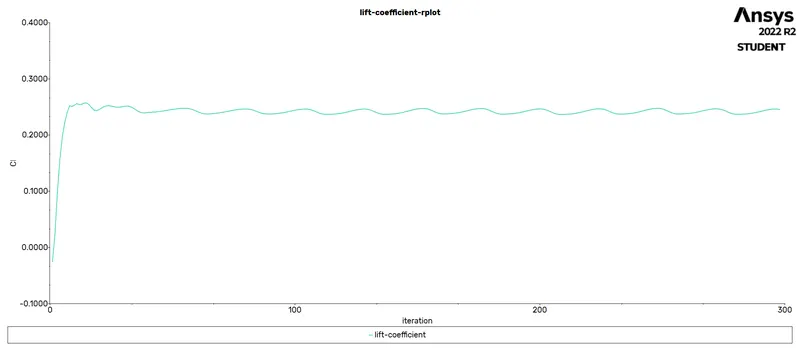
3. Lift coefficient
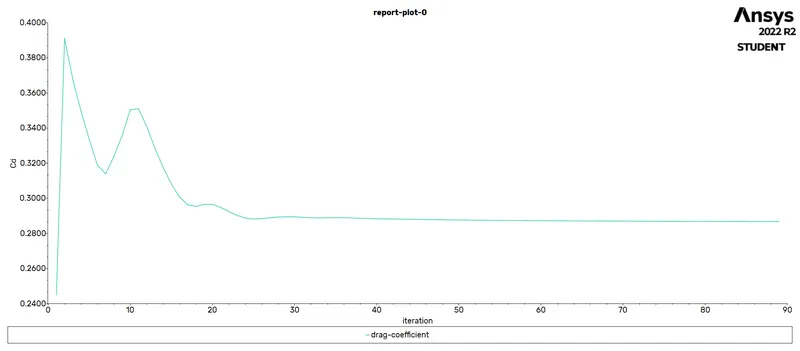
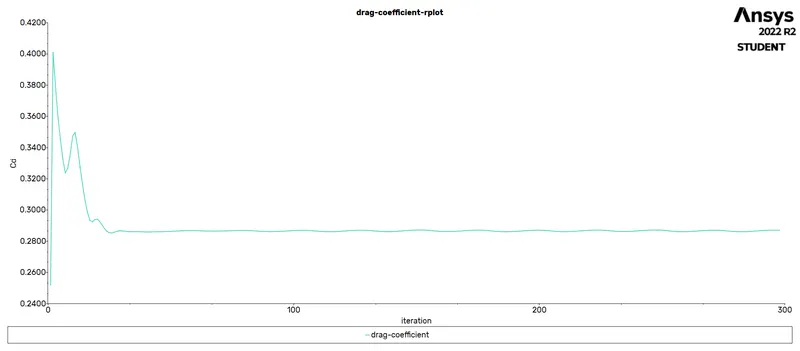
4. Drag coefficient
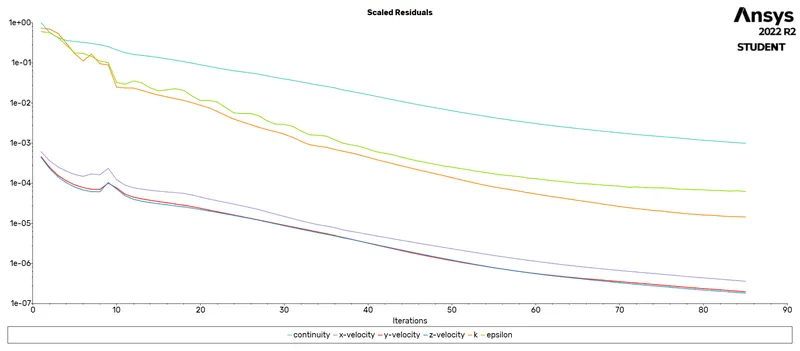
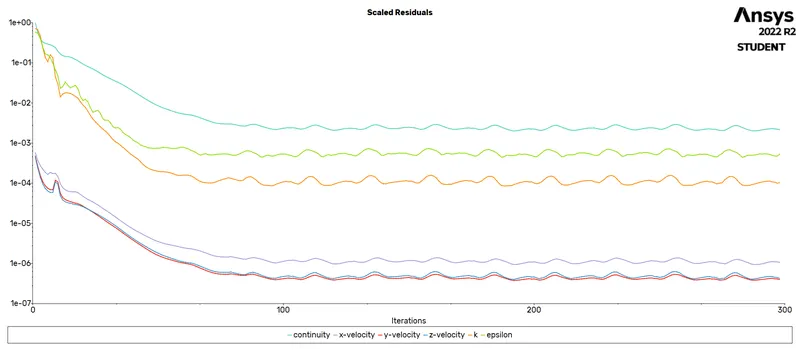
5. Scaled residuals
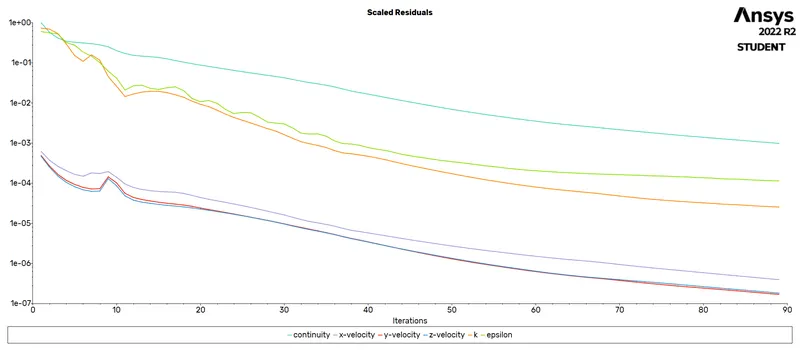
After Doing this simulation we have got the values of lift and drag coefficients as follows :-
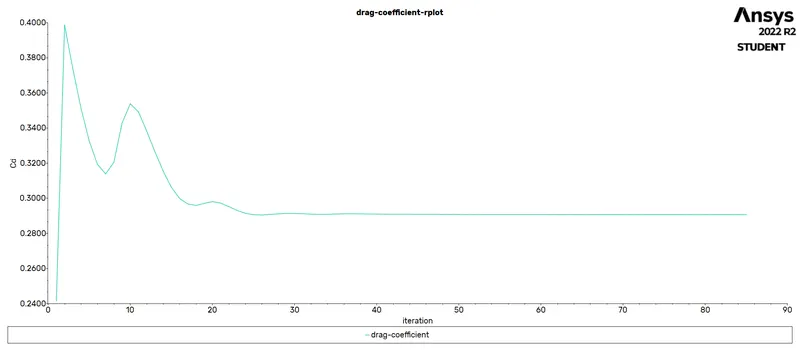
Drag coefficient = in b/w 0.28 - 0.29
lift coeffiecient = 0.24 approx
CASE 2 - elements COUNT = 2.8 lakh approx
We followed the same procedure in this case also but we have made some changes in the values of sizing which is 12 mm and rest everything will be same , also we have induced 15 inflation layers for observing the properties more clear near the wall surfaces.
Plots and contours
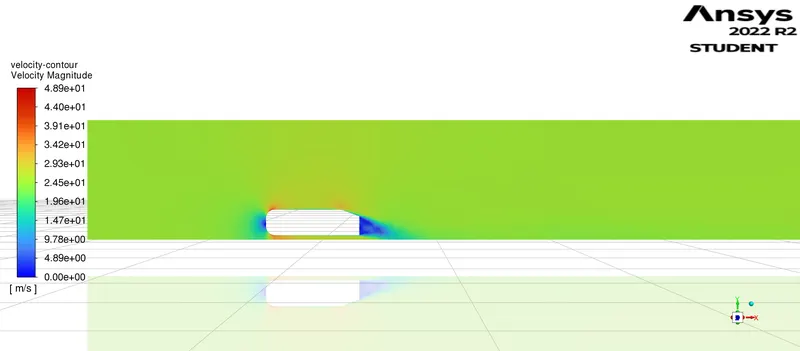
1. Velocity contour
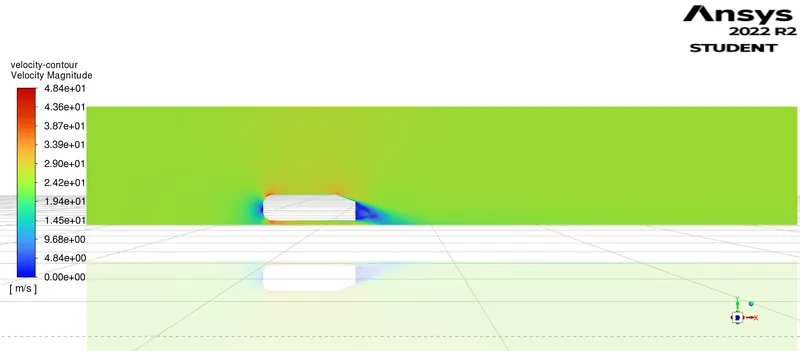
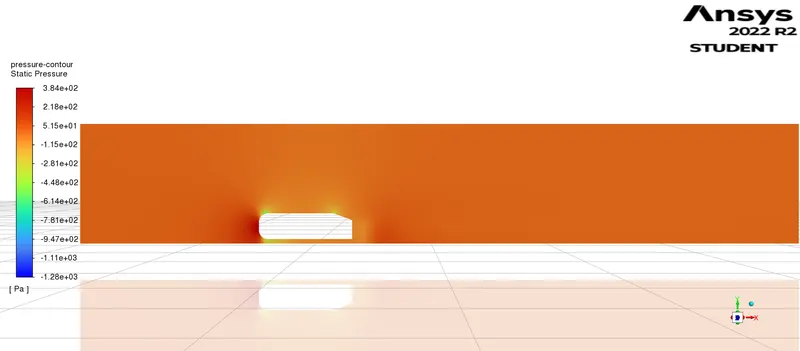
2. Pressure contour
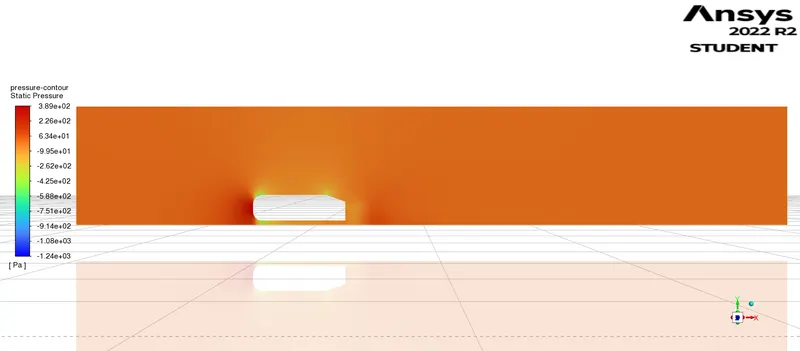
3. Lift coefficient
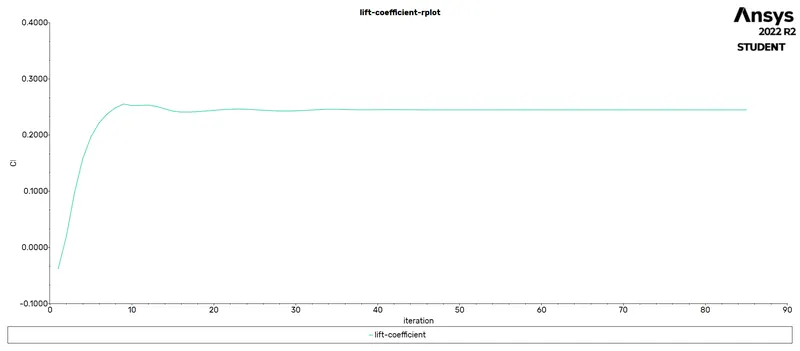
4. drag coefficient
5. scaled residuals
Value of drag coeffiecient = 0.28 approx
Lift coefficient = 0.24
CASE 3 = elements COUNT = 4.68 lakhs
In this case we have change the value of sizing to 8 mm and increased the inflation layers to 17 to study the lift and drag effect more clearly.
Plots and Contours
1. velocity contour
2. Pressure contour
3. Lift Coeffiecient
4. Drag coefficient
5. scaled residuals
Grid Dependence Test
A Grid Dependence Test is used to ascertain whether the final values of the solution are dependent on the mesh or not. This is an important test to ensure the simulation results are correct.
In this test, the test will involve 2 different simulations - one where the mesh becomes more finer and other where the mesh becomes more coarser.
Summary of Grid Dependence Test
| Lift Coefficient | Drag Coefficient | Nodes | Elements | |
| Coarser Mesh | 0.23892755 | 0.28537949 | 37033 | 286743 |
| Base Mesh | 0.24969179 | 0.29310978 | 83137 | 396714 |
| Finer Mesh | 0.24718563 | 0.28130557 | 110583 | 468527 |
The important takeaway is that drag coeffcient does not vary significantly when the mesh is made more finer. While the drag coefficient does vary when the mesh is made more coarse. This means that the grid dependence test has passed.
Conclusion and Observations
- The simulation of the Ahmed Body runs well and is in some agreement with experimental and empirical data on the body.
- There are regions behind the body where wakes are formed, circling regions of low velocity which induce a considerable amount of velocity drag on the body. This is seen in the simulation and experimental data by Gilliéron et al.[3]
- The values of drag coefficient agree with almost all publications although there is limited data for a slant angle of 20 degrees for the Ahmed Body.
- The values of lift coefficient agree with some sources and disagree with others, this discrepancy is due to coarser mesh around the botton region of the ahmed body.
- Grid Depedence Test was conducted and the test was succesful, an additional observation was also made - the drag coefficient decreases as number of elements increases. This decrease is very small and may be considered insignificant.