Week 3 - External flow simulation over an Ahmed body.
Q1. Describe Ahmed's body and its importance.
Brief Description
The Ahmed body is a generic car body (a simplified vehicle model). The airflow around the Ahmed body captures the essential flow features around an automobile and was first defined and characterized in the experimental work of Ahmed [1]. Although it has a very simple shape, Ahmed body allows us to capture characteristic features that are relevant to bodies in the automobile industry.
This model is also used to describe the turbulent flow field around a car-like geometry. Once the numerical model in validated, it is used to design new models of the car.

Ahmed model. Dimensions are in mm
The Ahmed body was described originally by S. R. Ahmed in 1984 [1]. Three main features were seen in the wake:
1. The A recirculation region that is formed as the flow separates at the top of the vertical back surface of the model
2. The B recirculation region that is formed due to the separation at the base of the model.
3. The c-pillar vortices that form as the vorticity in the side boundary layers roll up over the slant edges.
The wake was shown to be highly dependent on slant angle. For slant angles less than 12°, the flow remains attached over the the slant. The flow is essentially two-dimensional and has low drag. Between 12° and 30° the flow becomes much more three-dimensional as the c-pillar vortices form. These reach maximum strength at 30°. The drag increases significantly as the low pressure cores act on the rear surfaces. Past 30° the flow separates fully off the slant. This results in a sudden decrease in drag and weaker c-pillar vortices.
Why Study the Drag Coefficient in Cars?
The drag coefficient quantifies the resistance of an object in a fluid environment. It is not an absolute constant for a body’s shape because it varies with the speed and direction of flow, object shape and size, and the density and viscosity of the fluid. The lower the drag coefficient of an object, the less aerodynamic or hydrodynamic drag occurs. In terms of a car, the lower the drag coefficient, the more efficient the car is. As well as affecting the top speed of a vehicle, the drag coefficient also affects the handling. Cars with a low drag coefficient are sought after, but decreasing the drag drastically can reduce the downforce and lead to loss in road traction and a higher chance of car accidents.
Most cars have an average drag coefficient of between .30 and .35. Boxy cars have a higher number, like the HUMMER® H2 vehicle at .57, while more streamlined and agile cars have a lower number, like the Mercedes-Benz® C-Class® vehicle at .24. Again, this is just an average measurement. The exact drag coefficient of a car varies with the Reynolds number and various other factors.
There are certain ways to modify a car to optimize its aerodynamics and decrease the drag coefficient. To streamline the exterior, you can remove certain aftermarket items such as the roof rack, mud flaps, spoilers, and radio antenna. Professional car racers also take off their windshield wipers and side mirrors, but this isn’t recommended for the average driver! You can also add wheel covers, a partial grille block, an under tray, fender skirts, and a modified front bumper to improve the drag coefficient and make your car stand out in the process.
Q2. Explain the reason for the negative pressure in the wake region.
The flow behind an object separates from the surface and creates a highly turbulent region behind the object, called the wake. The pressure inside the wake region remains low as the flow separates and a net pressure force (pressure drag) is produced. In other words, due to the production of pressure drag being produced from flow separation, the pressure in the wake region is low. This is what is causing the vacuum.
Q3. Explain the significance of the point of separation.
The separation point is the point where the air stops "sticking" to an object that is moving through the air. When an object is moving through the air, the air molecules push back on it and resist the object's movement - this resistance is called pressure drag. As the air flows around the object, it "sticks" to the object, forming what is known as the boundary layer. This "attached flow" is flowing very smoothly. The point on the body where the boundary layer lifts off the surface is called the separation point. When the air flow separates off the surface, the pressure drag usually increases.
Separation occurs in flow that is slowing down, with pressure increasing, after passing the thickest part of a streamline body or passing through a widening passage,When the boundary layer separates, its remnants form a shear layer and the presence of a separated flow region between the shear layer and surface modifies the outside potential flow and pressure field. In the case of airfoils, the pressure field modification results in an increase in pressure drag, and if severe enough will also result in stall and loss of lift, all of which are undesirable. For internal flows, flow separation produces an increase in the flow losses, and stall-type phenomena such as compressor surge, both undesirable phenomena.
Another effect of boundary layer separation is regular shedding vortices, known as a Kármán vortex street. Vortices shed from the bluff downstream surface of a structure at a frequency depending on the speed of the flow. Vortex shedding produces an alternating force which can lead to vibrations in the structure. If the shedding frequency coincides with a resonance frequency of the structure, it can cause structural failure. These vibrations could be established and reflected at different frequencies based on their origin in adjacent solid or fluid bodies and could either damp or amplify the resonance.
This results in the flow separation of fluid flow on the airfoil structure with the formation of eddies and vortices. The two major consequences of the flow separation are, The drastic reduction in lift or stall.
Simulation
Geometry
Open ansys and drag fluent to the work bench.
Download the cad file of the ahmed body from the link provided and right click on geometry to open spaceclaim and load the geometry in sapce claim.
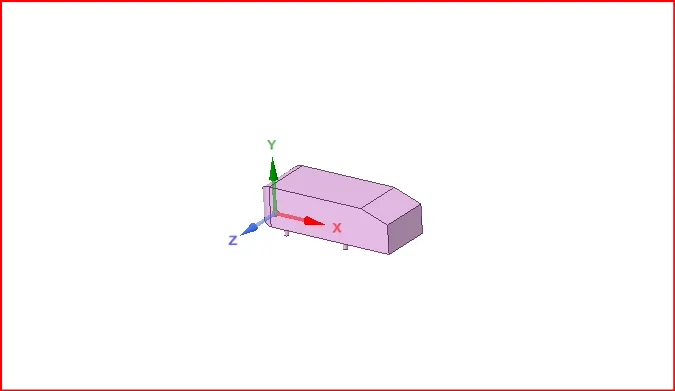
Set the units as metres in spaceclaim.(File > space claim options>units>metres)
We have to create an enclosure for the ahmed body.
Go to prepare>select enclosure>
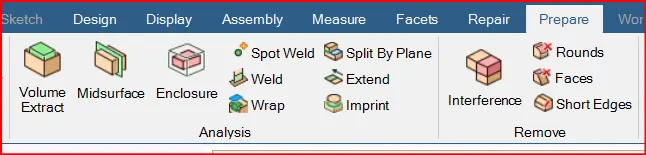
Uncheck symmetry dimensions and Give the following dimensions to the enclosure.5m to the right, 2m to the left, 1m on top and 0m at bottom.
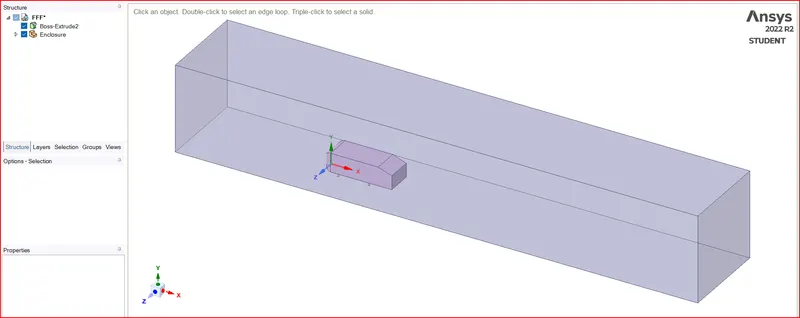
Now we can close the space claim and open meshing tool.
Meshing:
Go to face selection tool>create named selection appropriately.
Fluent Solver settings:
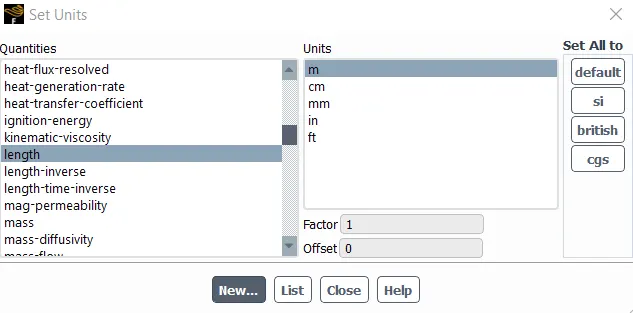
Units:Set units to meters.
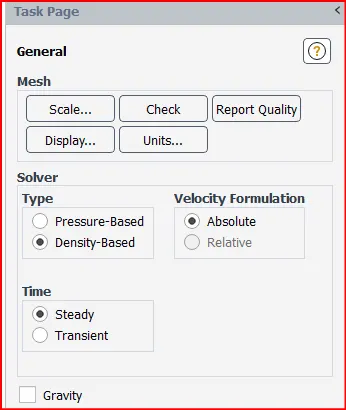
Use density based solver and follow the below settings
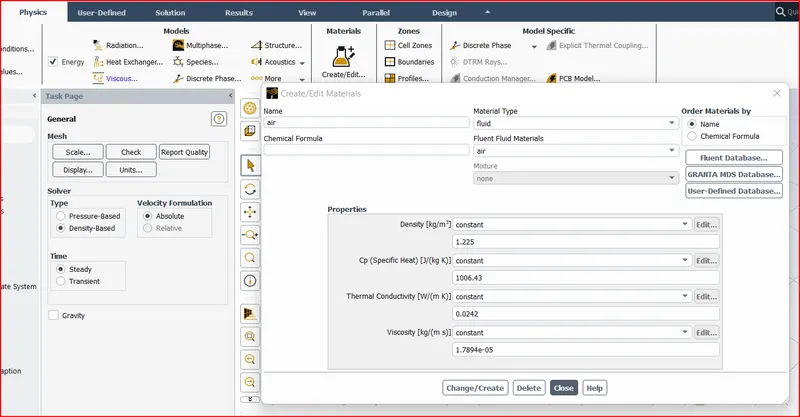
Use the material as air.
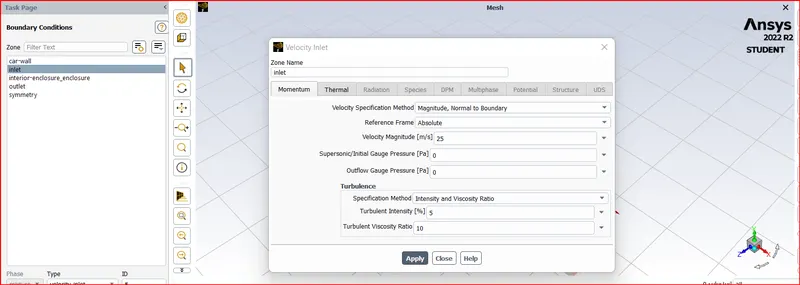
Boundary condition:
Set the inlet velocity as 25m/s and temperature as 300K.
For outlet set the guage pressure as zero.
In solution Tab select hybrid method.
Creat a Plane:
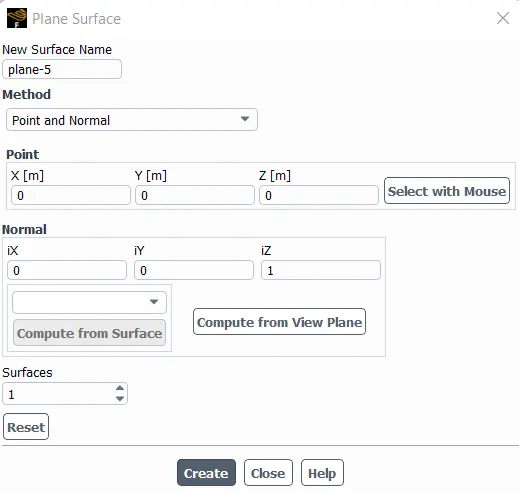
We have to create a plane in the xy plane and whose normal is alon the z-axis.
Go to Results>create>plane>Name of Plane>method-Point and Normal>Point(0,0,0) & Normal(0,0,1).
Contours:
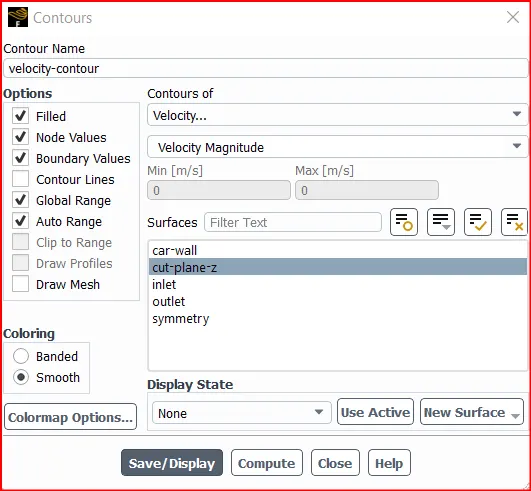
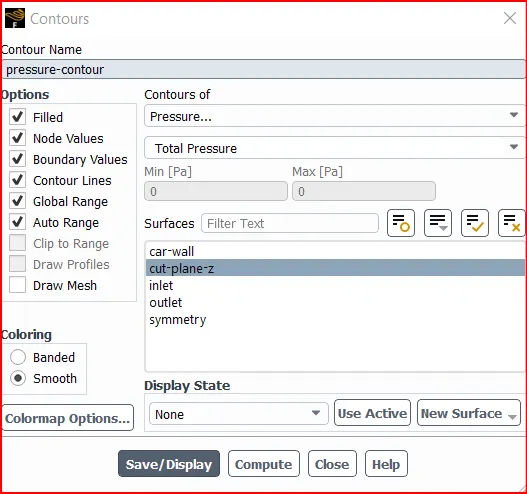
Results>contours>New>velocity contour >Select velocity magnitude> along cutplane-z.
Pressur contour:
Create animation:
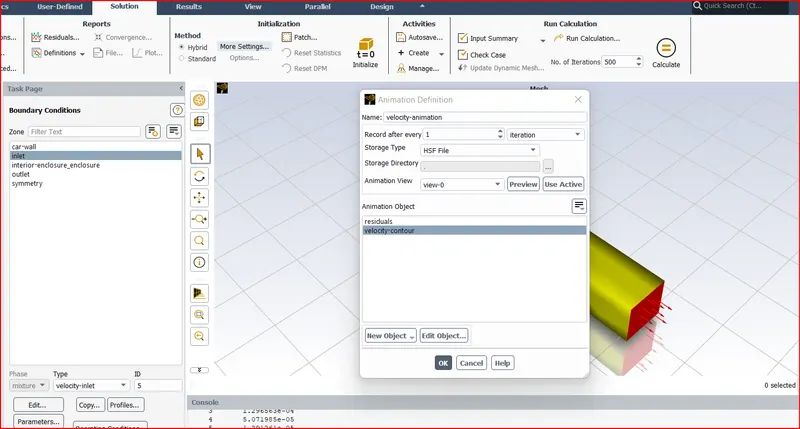
Solution>Create>Solution animation>below settings.
Now Initialize and run the simulation for 1000 iterations.
Results:
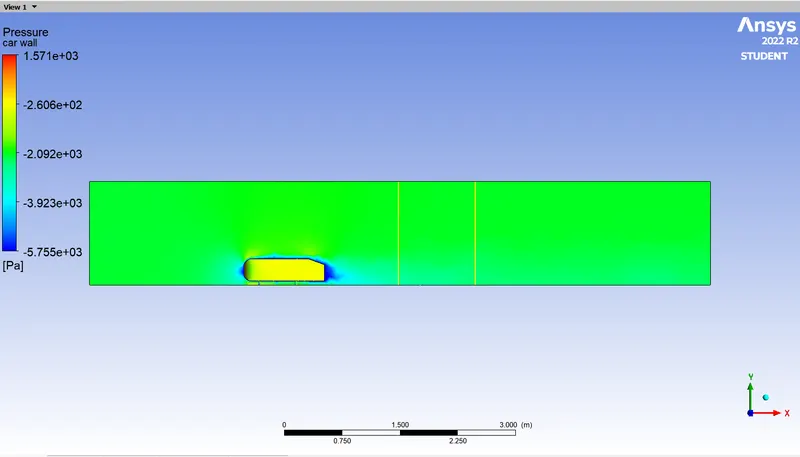
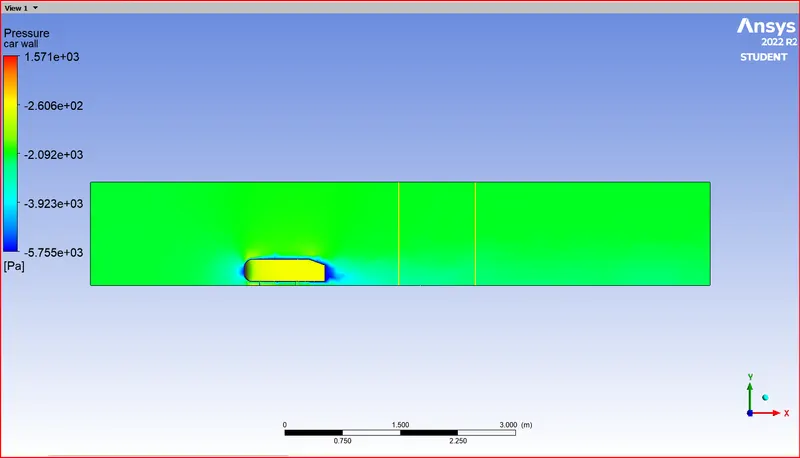
1. Velocity and pressure contours.
Pressure contour:
Velocity contour:
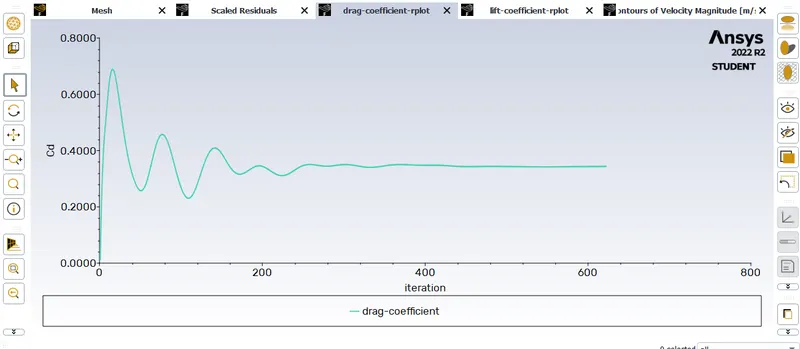
2. The drag coefficient plot for a refined case.
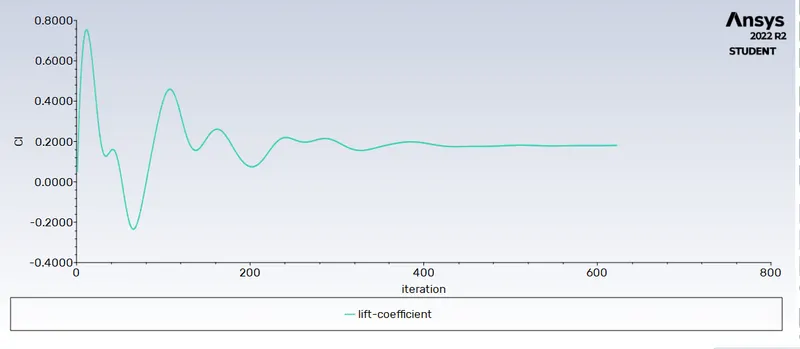
Lift coefficient
3. The vector plot clearly showing the wake region.
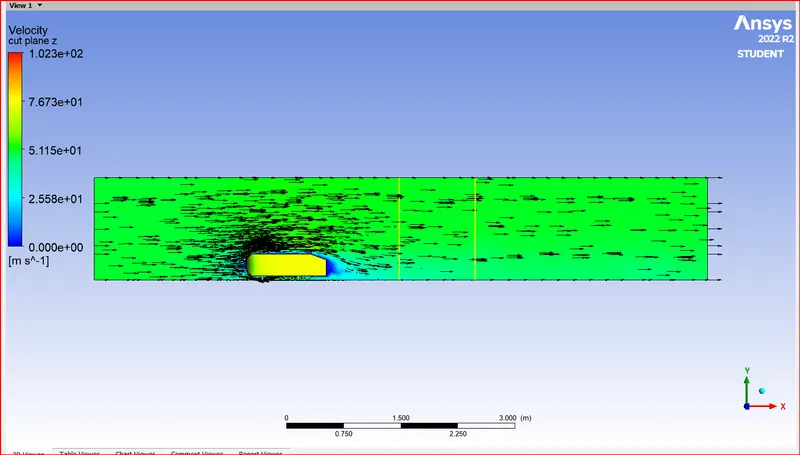
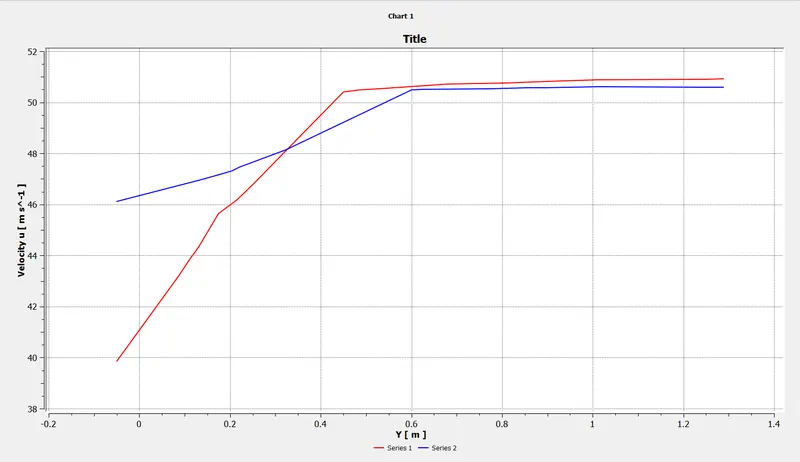
Chart View
Case 2:
Change the velocity of inlet as 25 m/s.
Go for Mesh refinement:
Geometry Modifications
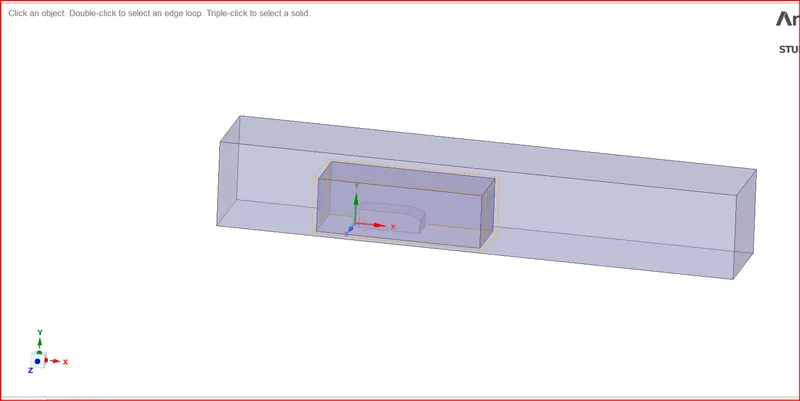
We have to create another enclosure for the ahmed body.
Go to prepare>select enclosure>
Uncheck symmetry dimensions and Give the following dimensions to the enclosure.1m to the right, 0.5m to the left, 0.5m on top and 0m at bottom.
Remove interface:
Go to prepare>click on interference>click green tick box.
Meshing
To obtain accurate results we have to refine the mesh.
Mesh refining procedure:
First of all generate the basic mesh.
Right click on mesh and select method.
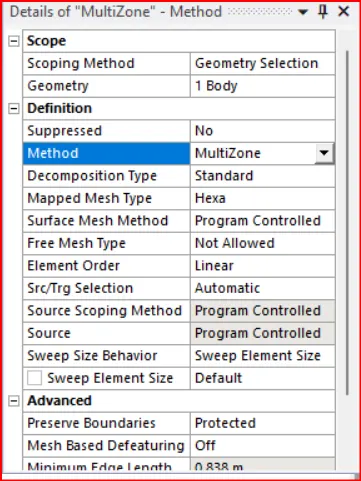
Select the entire enclosure body,select the method as multizone.
here multizone helps in creating the hex mesh which gives more accurate results.
Click on mesh and click on element size and enter 0.1m.
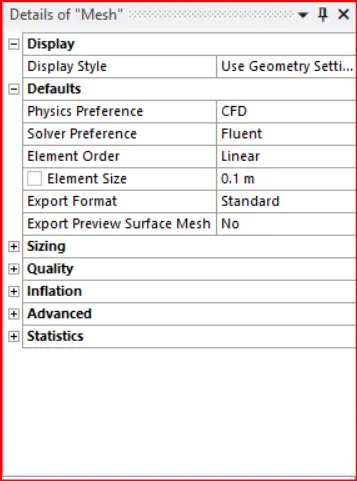
Click on generate mesh.
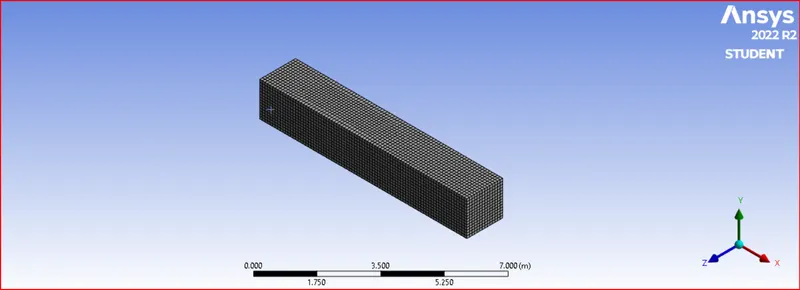
Step-2
Click on mesh>right click and select sizing.
Select the small enclosure to the ahmed body and give the element size as 0.5 mm to make the mesh more refined near the ahmed body and hit generate.
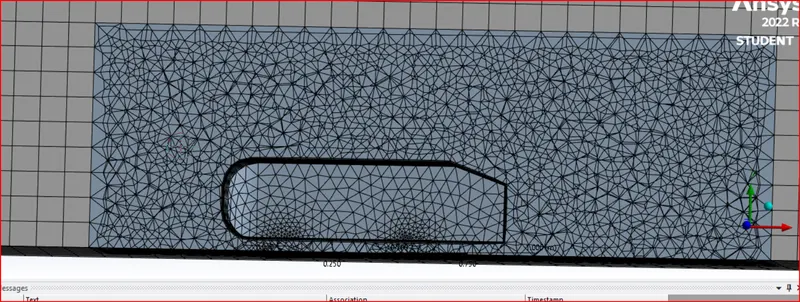
Step-3
To refine the cylindrical stands which support the ahmed body.
Right click on the mesh>select sizing>selct entire ahmed body>shows 15 faces selected>enter elemnt size as 0.01 m.
To select the entire ahmed body click on the outer enclosure faces and press f8 (shortcut to hide faces.) now using the box select tool select the ahmed body.
click Generate mesh
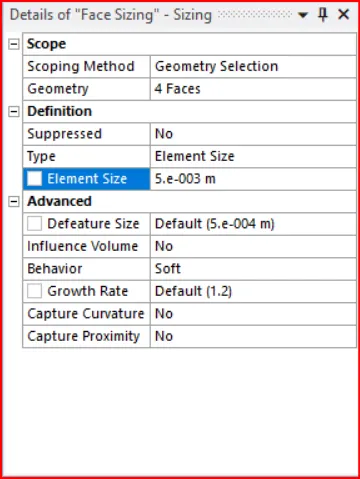
Still the mesh around the cylindrical does not get refined so to refine that select face sizing>single select tool> select the individual cylindrical faces> element size as 0.005m nad click on generate mesh.
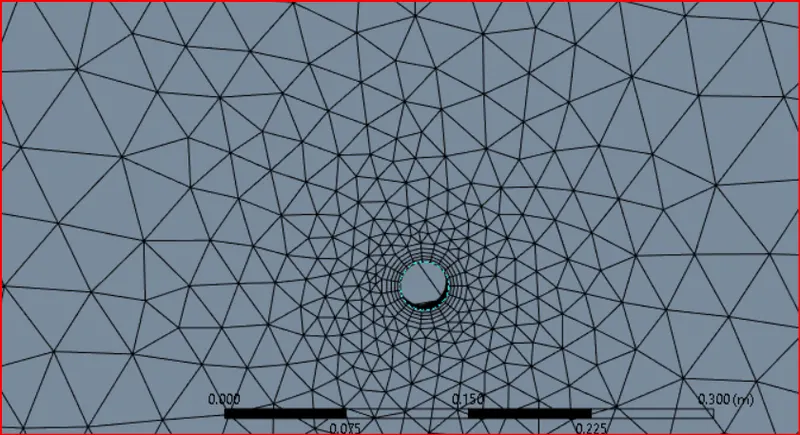
Inflation layer :
To add inflation layer around the car wall.
As each cell has cell centers at different locations it is not idela to apply wall boundary conditions, so in such cases we apply inflation layers which replicate the wall surface.
Click on mesh>go to inflation>Select car wall as named selection>Inflation option>First layer thickness>first layer height 5mm
To calculate first layer thickness, it is based on reynolds no and y+ values.
Insted of first layer thick ness if we give total thick ness this will contrain the problem more.
So if the first layer thick ness is 5 mm and grows by 20% in thickness so total thickness=5*1.2^5=12.4416 mm
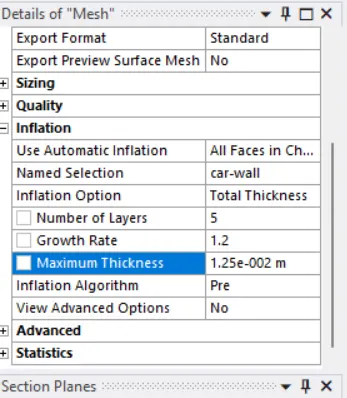
Enter the data and click generate.
As we can see the Inflation layer in the below mesh.
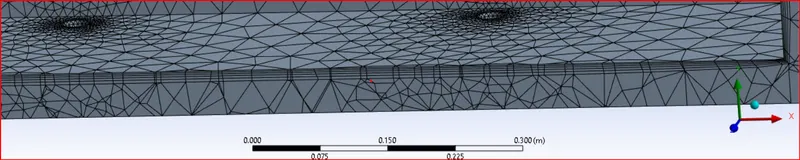
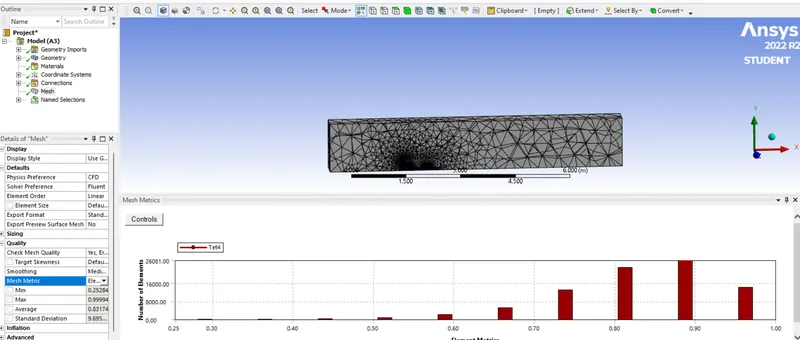
Mesh quality
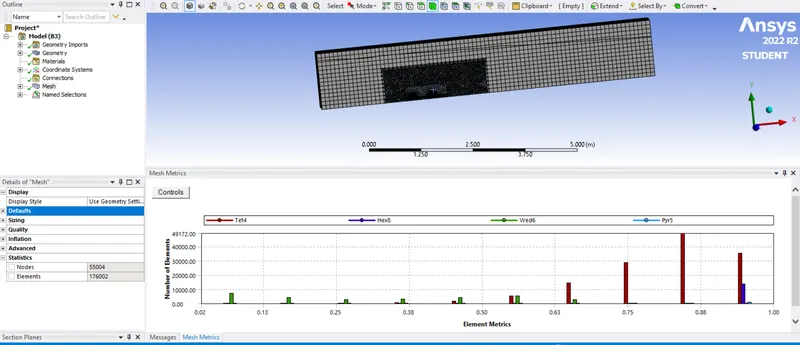
Simulation:
Simulation is carried out by keeping all the parameters same.
Results:
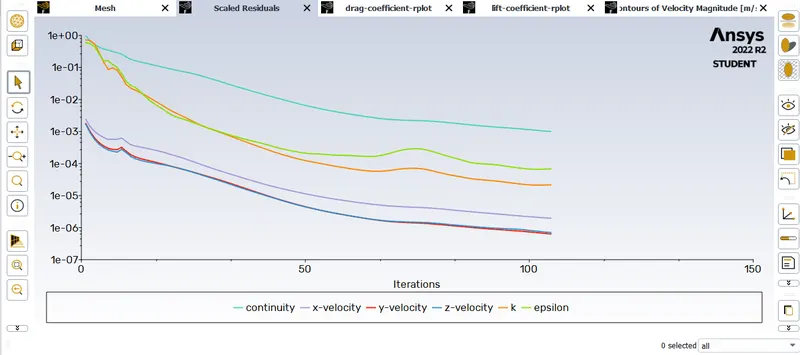
Scaled Residuals
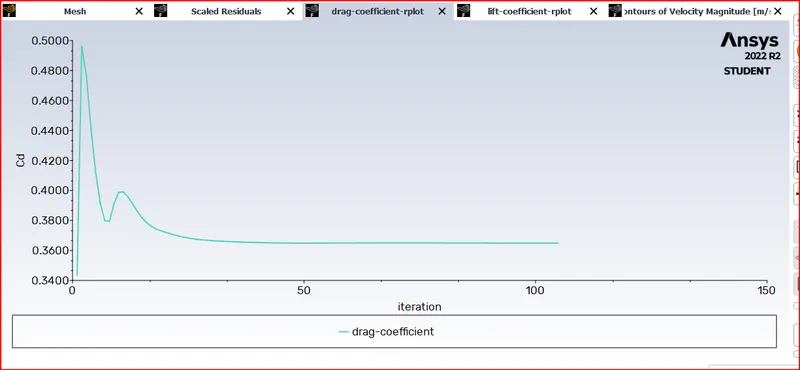
Drag coefficient
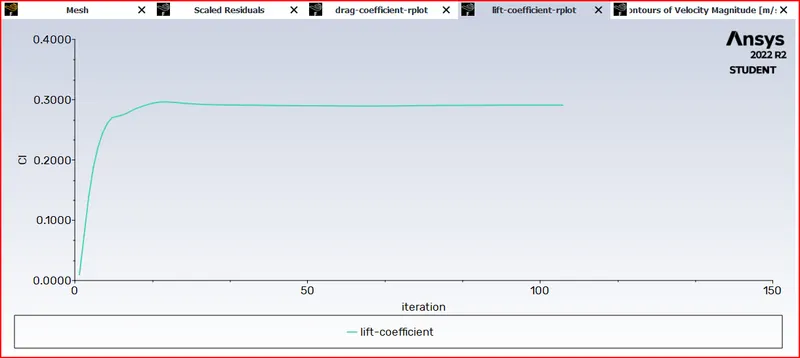
Lift coefficient
Contour Plots:
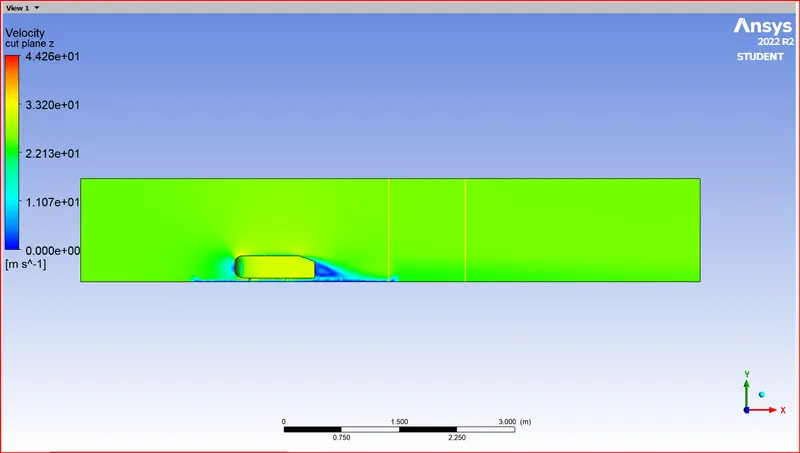
Velocity contour
Pressure contour
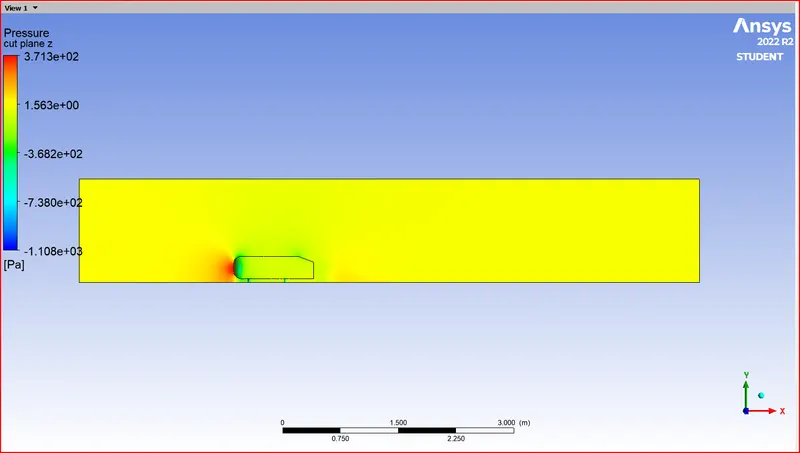
As seen in the below plot, pressure in front pf the ahmed body is high and at the rear low pressure region is formed where the pressure drops below the atmosphereic pressure and hence the pressure is negative.
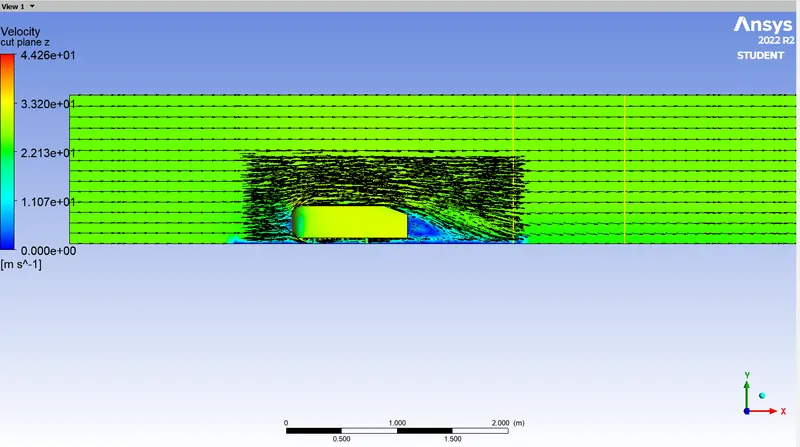
Vector plots
After zooming in
In the below plot we can see the wake region formation.
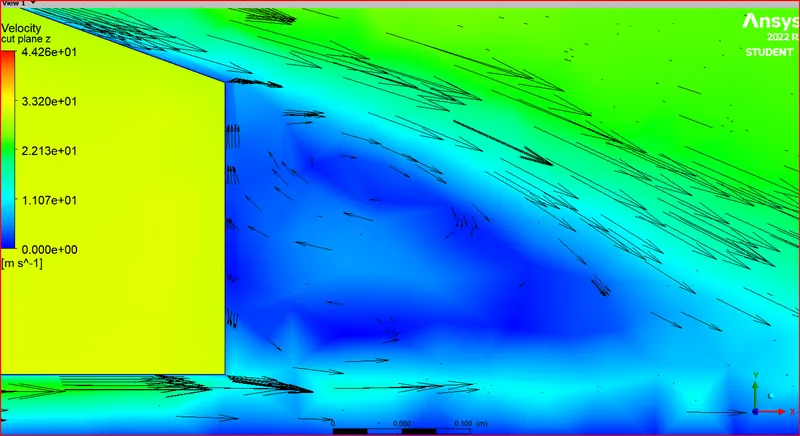
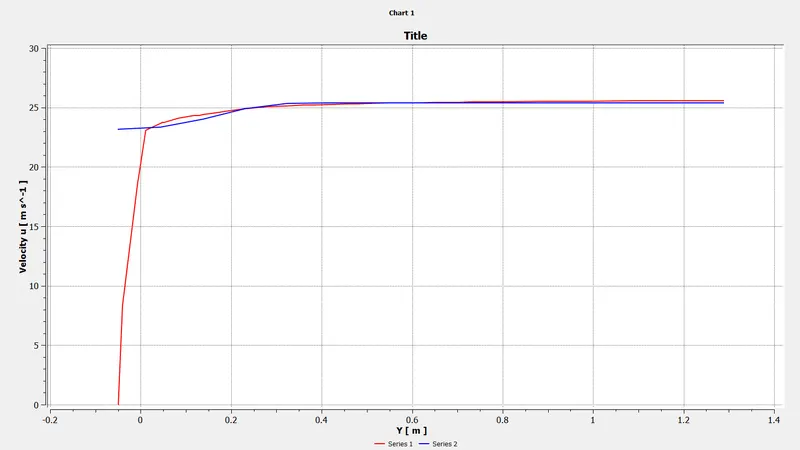
Chart Plot
4. Perform the grid independency test and provide the values of drag and lift with each case.
This test is carried out to ascertain if the final simulation results are dependent on the mesh or not.
| Mesh Type | Drag coefficient | Coefficient of Lift | No of Elements |
| Coarse | 0.38 | 0.3 | 84073 |
| Fine | 0.36 | 0.29 | 176002 |
Conclusions:
The simulation of the ahmed body is carried out.
Formation of wake region is observed behind the ahmed body, circling regions of low velocity which induces extra drag on the body.
The values of drag and lift coefficient are compute and plotted for each cases.
Grid dependence test was carried out and found that as the number of cells increases an insignificant drop in drag coefficient is observed.