Week-3 Challenge: ADVISOR Tool
Week-3 Challenge: ADVISOR Tool
AIM OF THE CHALLENGE:
- To have hands-on experience on the ADVISOR Tool for the Vehicle simulation.
OBJECTIVE:
- Observation on results for the vehicle can travel for 45 km for the FTP drive cycle if the cargo mass is 500 kg.
- Changing the battery capacity and repeating the simulation to achieve 45 km.
- To perform the gradability for the PRIUS_Jpn_defaults_in file.
ADVISOR TOOL:
ADvanced VehIcle SimulatOR - ADVISOR, is a set of model, data, and script text files for use with Matlab and Simulink. It is designed for rapid and real analysis of the performance and fuel economy of conventional, electric, and hybrid vehicles.
It is used to
- estimate the fuel economy of vehicles that have not yet been built
- learn about how conventional, hybrid or electric vehicles use (and lose) energy throughout their drivetrains
- compare relative tailpipe emissions produced on a number of cycles
- evaluate an energy management strategy for your hybrid vehicle’s fuel converter
- optimize the gear ratios in your transmission to minimize fuel use or maximize performance, etc
1. For the EV_defaults_in file, if cargo mass is 500 kg with all other default conditions, can the vehicle travel for 45 km with an FTP drive cycle? Conclude your observations.
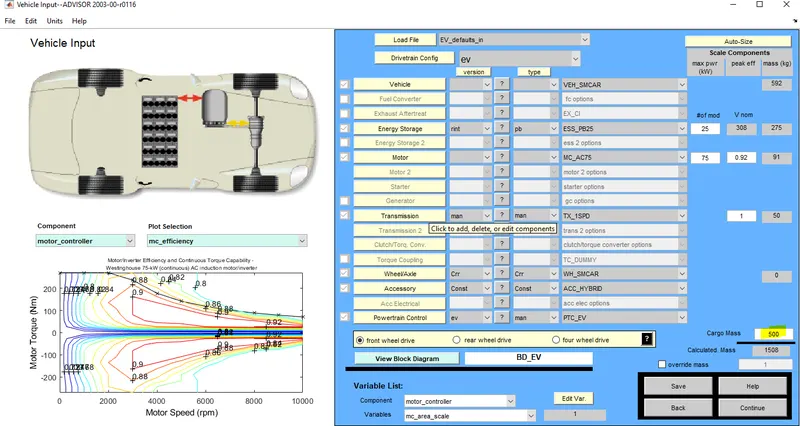
As per the given information, the cargo mass is given as 500 as shown below to check for the vehicle travel speed of 45km
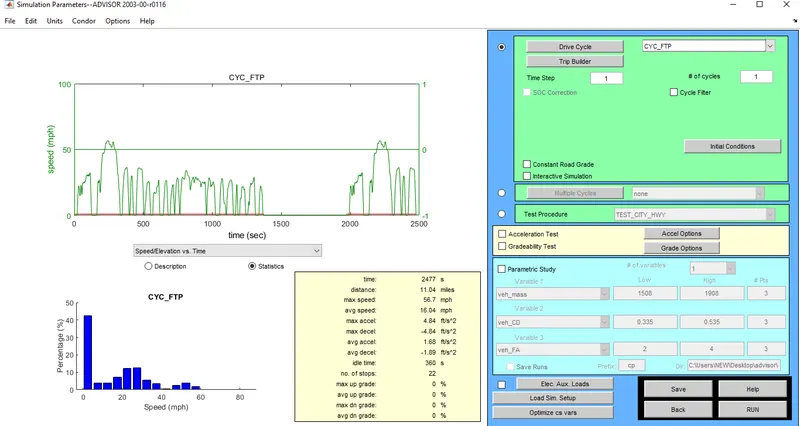
By the Drive cycle: CYC_FTP and # of cycles:1 the output results will be monitored to check for the distance in km.
As you see the below image the distance is 11m (17.7km) for one driver cycle of FTP
11mile=1.609km = 11*1.609 = 17.7km
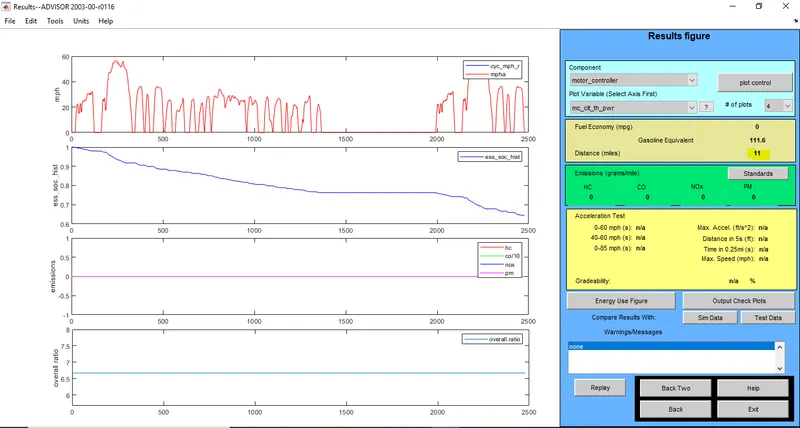
From the above image following parameters are observed :
| Cargo | 500 |
| Driving cycle - FTP | 1 |
| SOC consumed | Around 60% |
| Distance covered | 11m-->17.7km |
The goal is to achieve 45km with the available SOC range of the cargo mass 500 and by increasing the Drive cycle, if not have to increase energy storage to achieve the same.
Let us increase the drive cycle by 2 and check for the distance:
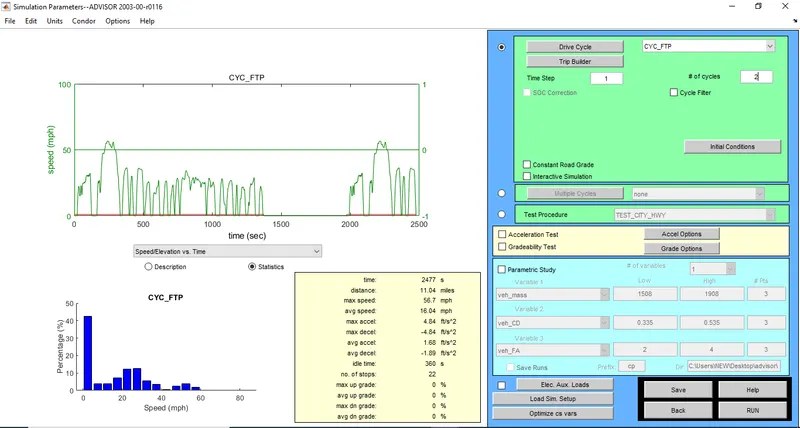
Once the drive cycle is set for 2 the output is shown below:
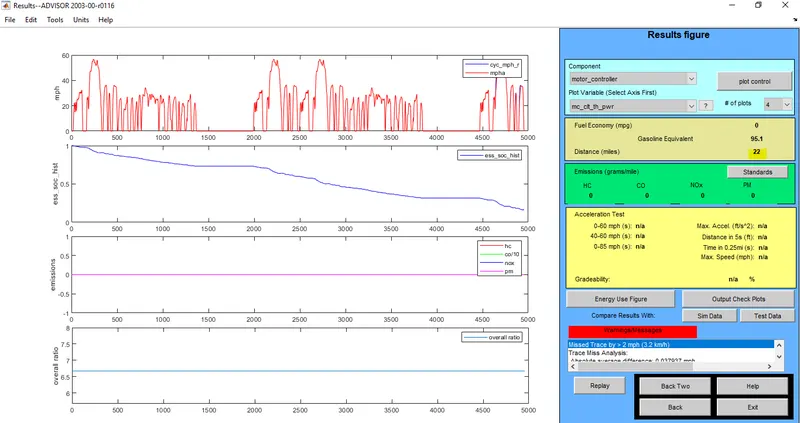
From the above image following parameters are observed :
| Cargo | 500 |
| Driving cycle - FTP | 2 |
| SOC consmed | Around 70% |
| Distance covered | 22m --> 35.4km |
Let us increase the drive cycle by 3 and check for the distance:
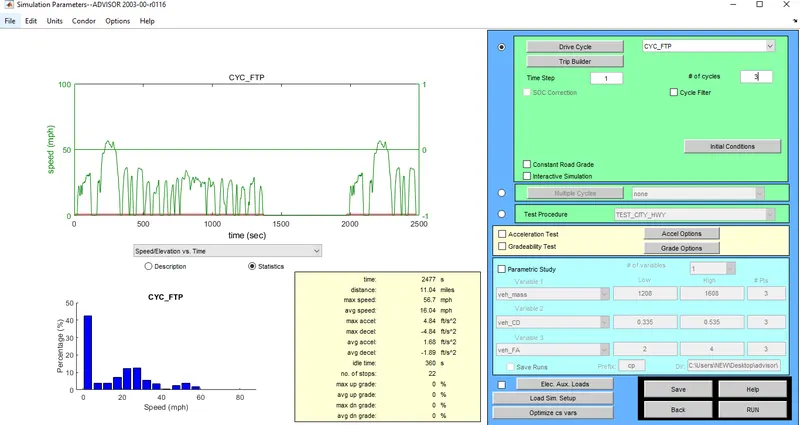
Once the drive cycle is set for 3 the output is shown below:
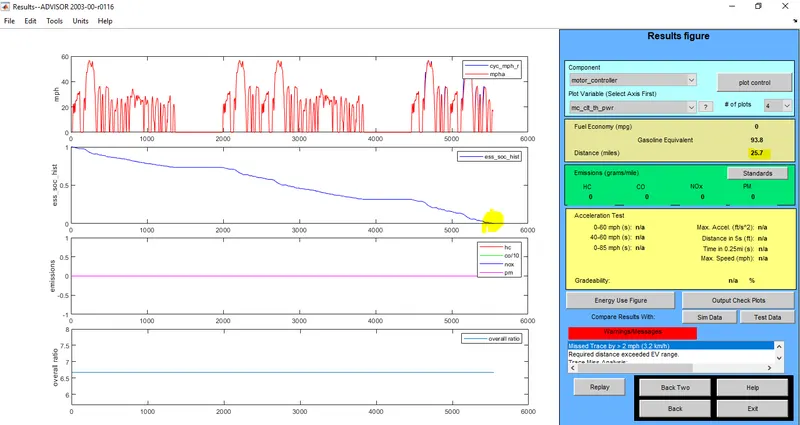
From the above image following parameters are observed :
| Cargo | 500 |
| Driving cycle - FTP | 3 |
| SOC consmed | 100% |
| Distance covered | 25.7m -->41.3km |
Observation:
As SOC is drained to 0 during 3 driving cycles where the vehicle distance travel is achieved only 41.3km, so by increasing the energy storage SOC it is possible to achieve 45km of vehicle travel.
2. In the above case, try changing the battery capacity and repeat the simulation.
Keeping all the parameters the same till the last condition, I have increased the energy storage to 30 to check for the vehicle travel to achieve 45km.
Continue and run the simulation.
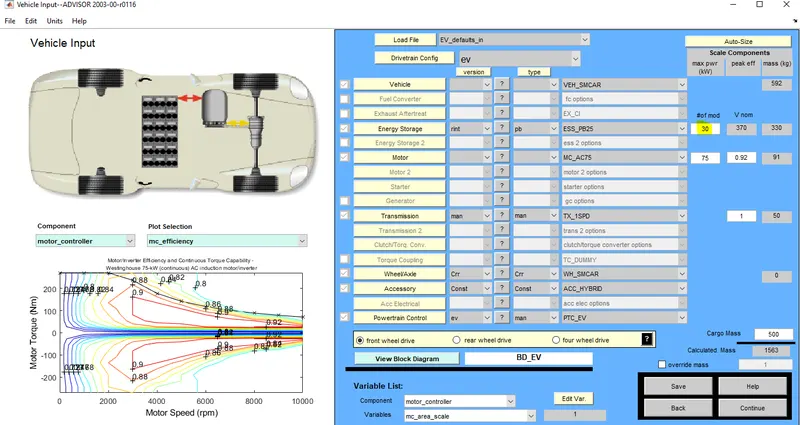
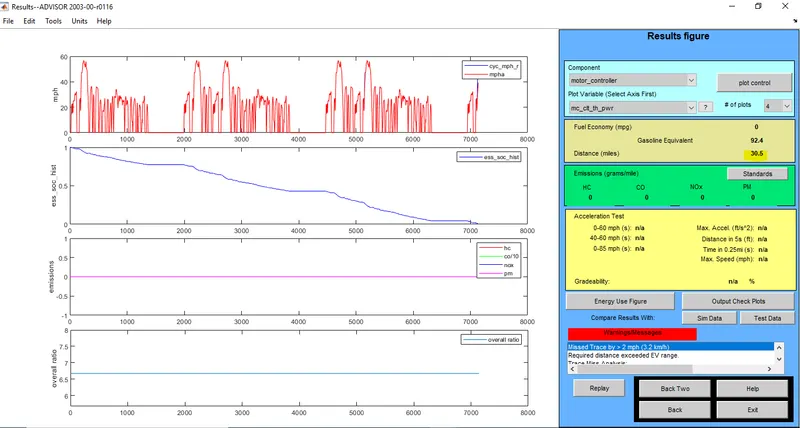
From the above image following parameters are observed :
| Cargo | 500 |
| Driving cycle - FTP | 3 |
| SOC consmed | 100% |
| Energy storage(# of mode) | 30 |
| Distance covered | 30.5m -->49.0km |
Observation and conclusion:
TO achieve the 45km with 500 cargo we need to increase the energy storage for more than or equal to 30 with 3 driving cycles - FTP.
3. Perform gradability test with PRIUS_Jpn_defaults_in file Compare your results in the table and conclude.
Gradeability:
A gradability in the vehicle is its ability to climb slopes. Gradability is measured either in degrees or percentages. A 45 degrees gradient is equivalent to 100 percent. Gradability is dependent on engine power, drivetrain type, gear ratio, weight, weight distribution, car's center of gravity, and traction.
AIM:
To perform the gradability test for model PRIUS_Jpn_defaults and analyze and compare the results of speed and gradability.
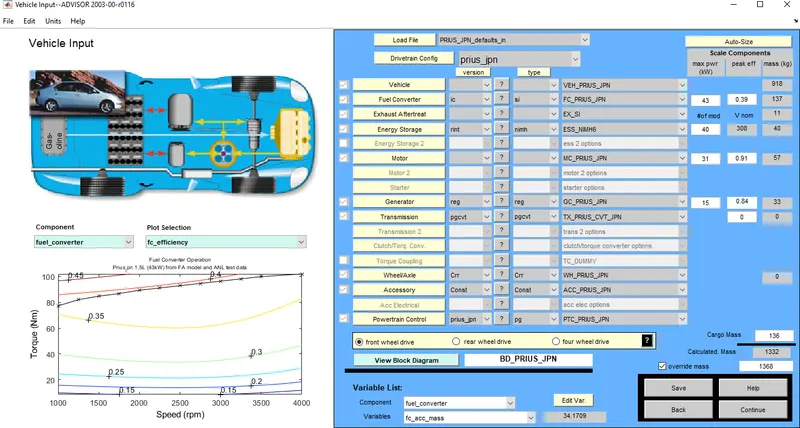
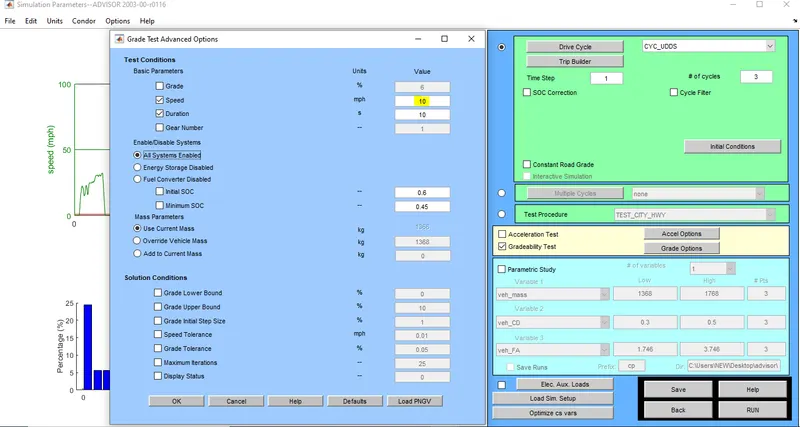
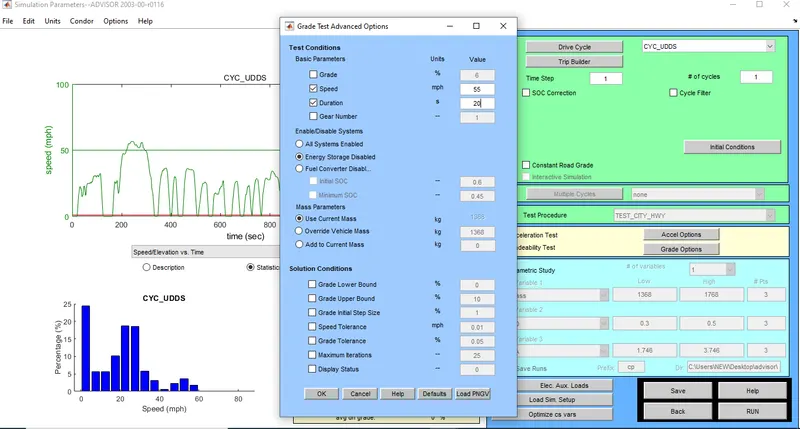
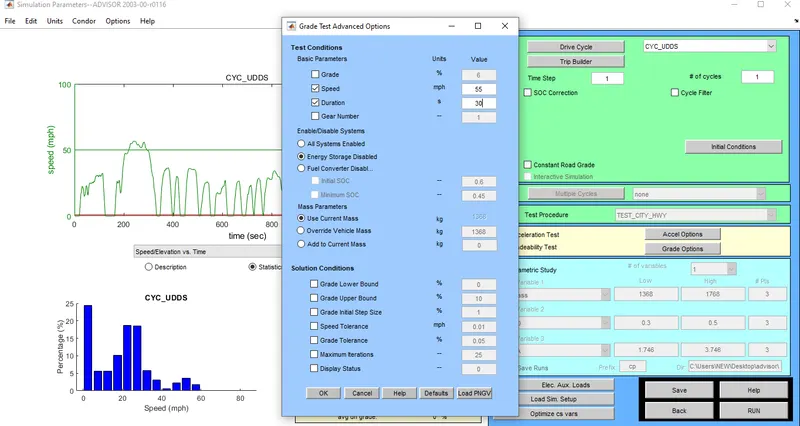
Check the Gradability Test check box and click Grade options to change the Speed values.
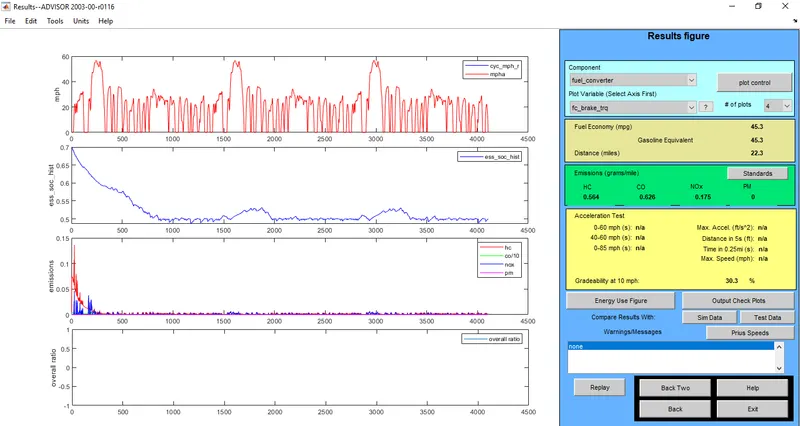
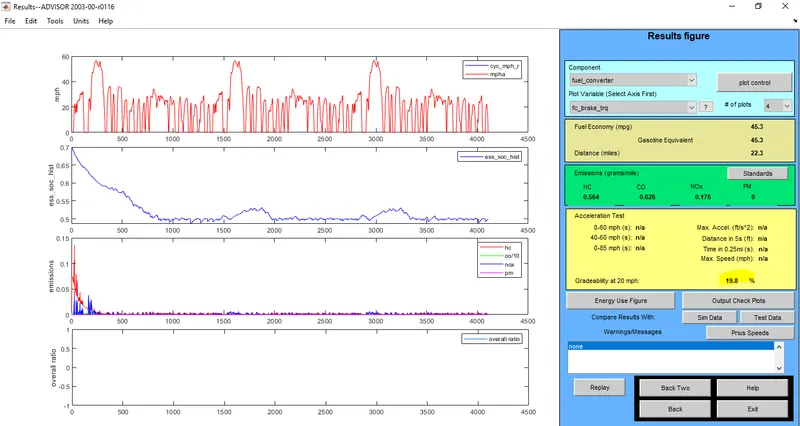
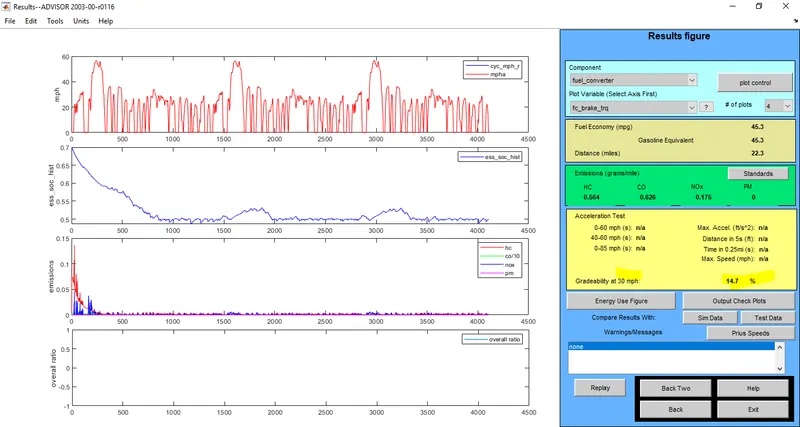
Performed with the following values for speed and the corresponding gradability is obtained.
| Speed (m/s) | Gradeability |
| 10 | 30.3% |
| 20 | 19.8% |
| 30 | 14.7% |
| 40 | 11.7% |
| 50 | 9.7% |
The following screenshots are attached for the above table :
| Speed (m/s) | Gradeability |
| 10 | 30.3% |
| Speed (m/s) | Gradeability |
| 20 | 19.8% |
| Speed (m/s) | Gradeability |
| 30 | 14.7% |
| Speed (m/s) | Gradeability |
| 40 | 11.7% |
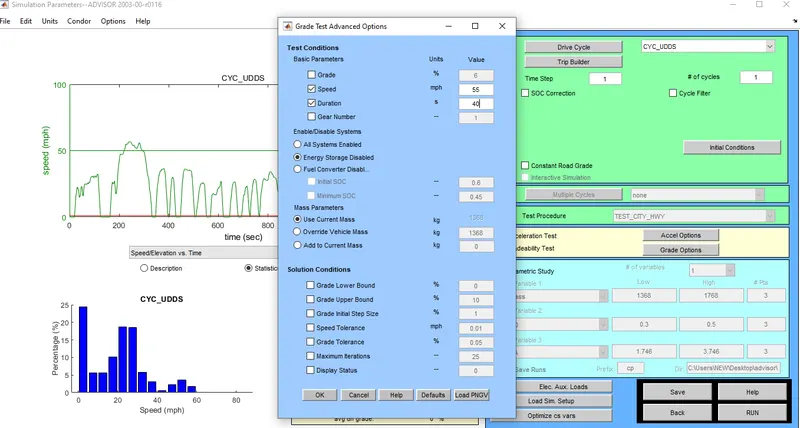
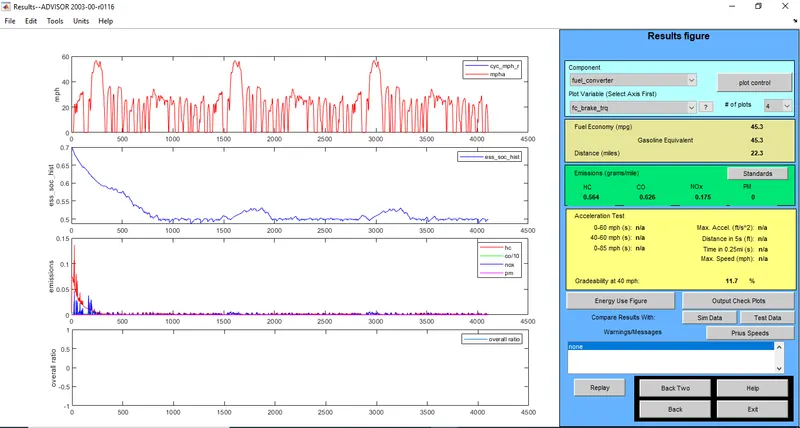
| Speed (m/s) | Gradeability |
| 50 | 9.7% |
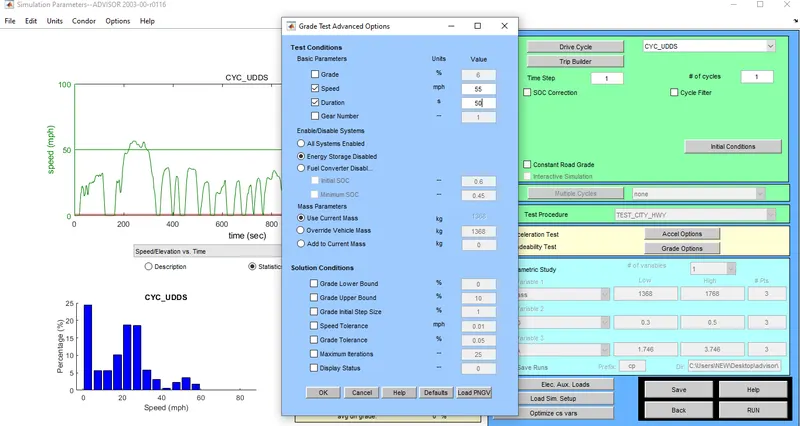
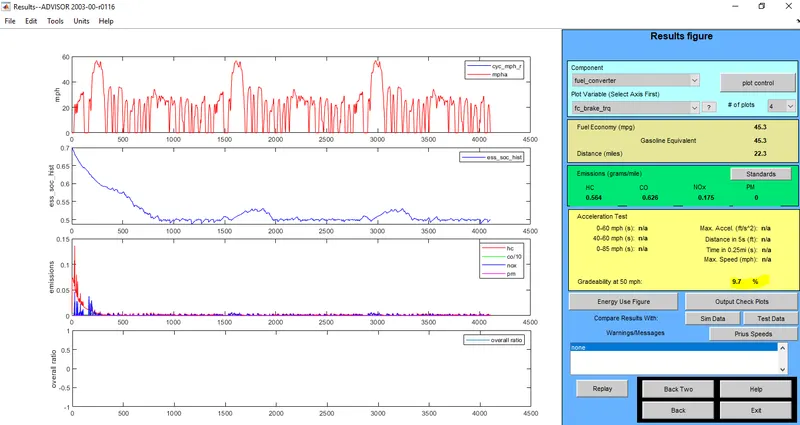
Observation and Conclusion:
So as a result, gradability increases with a decrease in speed.
Reference example is WEEK 1 - Q4 - https://www.youtube.com/watch?v=EUwzWHD3Htg ---> where we can get a good idea about gradability.