Week-3 Challenge: ADVISOR Tool
Use ADVISOR tool and simulate the following
1. For EV_defaults_in file, if cargo mass is 500 kg with all other default conditions, can the vehicle travel for 45 km with FTP drive cycle? Conclude your observations.
a.
ADVISOR Simulation Tool for Vehicle Evaluation and Testing
- Accurate component and vehicle simulations are critical to efficient development of advanced vehicles, particularly to making intelligent choices about energy management.
- Simulating vehicle and component performance helps engineers determine how to increase the life of components, improve vehicle performance, optimize vehicle system designs, and reduce development times.
- The U.S. Department of Energy (DOE) and the National Renewable Energy Laboratory (NREL) have worked with industry partners to develop a sophisticated systems analysis tool that can answer crucial questions about specific component and vehicle designs.
- ADVISOR (Advanced Vehicle Simulator) is a model written in the widely used MATLAB/Simulink
software environment. - It can be used to simulate and analyze conventional, advanced, light and heavy vehicles,including hybrid electric and fuel cell vehicles.
- ADVISOR tests the effect of changes in vehicle components (such as motors, batteries, catalytic converters, climate control systems, and alternative fuels) or other modifications that might affect fuel economy, performance, or emissions. The user can alter simulation results by selecting vehicle component types, sizes, and parameters.
- Technology
ADVISOR uses basic physicscalculations and measured component performance to model conceptual vehicles. The user defines a vehicle using overall vehicle data and prescribes a speed-versus-time trace, along withroad grade, that the vehicle must follow.
ADVISOR then puts the vehicle through its paces, making sure it meets the cycleto the best of its ability. It calculatespredicted torque, speed, voltage, current,and power passed from one componentto another. ADVISOR allows the userto answer questions such as:
• What are the optimal drivetrain
component sizes that provide the
best fuel economy?
• Was the vehicle able to follow the
speed trace?
Success Story
ADVISOR Simulation Tool for Vehicle Evaluation and Testing FREEDOM CAR & V EHICLE T ECHNOLOGIES PROGRAM ADVISOR can predict vehicle performance, energy consumption, emissions output,
control strategy function, and average component efficiencies over multiple driving cycles and test procedures.
A Strong Energy Portfoliofor a Strong AmericaEnergy efficiency and cleanrenewable energy will mean a
stronger economy, a cleaner environment, and greater energy independence for America. Working with a wide array of state, community, industry, and university partners, the U.S. Department of Energy's Office of Energy Efficiency and Renewable Energy invests in a diverse portfolio of energy technologies.
For more information contact:
EERE Information Center • 1-877-EERE-INF (1-877-337-3463) • www.eere.energy.gov
• How much fuel and/or electric energy were required in the attempt?
• What was the peak power and efficiency delivered by the drivetrain components?
• What was the distribution of torque and speeds that the engine delivered?
• At what road grade can the vehicle maintain 55 mph with or without the batteries?
ADVISOR is flexible enough to operate on most computer platforms in the commercially available MATLAB/Simulink graphical/ object-oriented program. The model is continuously updated with actual
component test data by users and through university validation efforts. It is flexible enough to model specific components and vehicle configurations for the needs of most users.
Commercialization
In an agreement between NREL and AVL Powertrain Engineering, Inc. (Plymouth, Michigan), AVL will obtain the license to commercialize the ADVISOR vehicle simulation software.
Under the agreement, AVL obtains rights to manufacture, market, and sell
commercial versions of ADVISOR 2003. NREL retains a royalty-free license to future versions of ADVISOR for use on government projects. A cooperative research and development agreement
between NREL and AVL provides for future collaboration to develop integrate vehicle simulation tools for DOE and the
private sector. - AVL provides a highly visible commercial outlet for NREL’s vehicle simulation tools, leading to enhanced use of ADVISOR by automakers and suppliers. ADVISOR, which to date has been distributed at no cost on the Web, has been downloaded by more than 7,000 individuals, corporations, and universities worldwide. AVL will market and sell ADVISOR worldwide through its affiliates and will provide technical support for its global user base.
Benefits
• Reduces testing time to evaluate various vehicle powertrain alternatives
• Provides a shared simulation tool for government and industry
• Assists the automotive industry to develop fuel-efficient vehicles and components
FTP-75
Time-speed data points | 10 Hz file
The FTP-75 (Federal Test Procedure) has been used for emission certification and fuel economy testing of light-duty vehicles in the United States [2656]. The test is often referred to as simply ‘FTP’ (this should not be confused with the FTP test for heavy-duty engines).
The FTP-75 and the FTP-72 are two variants of the EPA Urban Dynamometer Driving Schedule (UDDS). The FTP-75 cycle is derived from the FTP-72 by adding a third phase of 505 s, identical to the first phase of FTP-72 but with a hot start. The third phase starts after the engine is stopped for 10 minutes. Thus, the entire FTP-75 cycle consists of the following segments:
- Cold start transient phase (ambient temperature 20-30°C), 0-505 s,
- Stabilized phase, 506-1372 s,
- Hot soak (min 540 s, max 660 s),
- Hot start transient phase, 0-505 s.
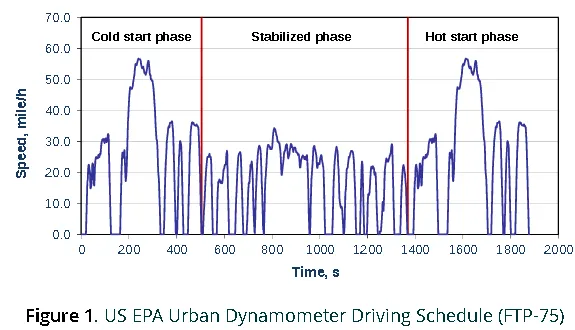
Emissions from each phase are collected in a separate teflon bag, analyzed and expressed in g/mile (g/km). The weighting factors are 0.43 for the cold start phase, 1.0 for the ‘stabilized’ phase and 0.57 for the hot start phase.
The following are some basic parameters of the cycle:
- Duration: 1877 s
- Distance traveled: 11.04 miles (17.77 km)
- Average speed: 21.2 mph (34.12 km/h).
- Maximum speed: 56.7 mph (91.25 km/h).
For emission certification, vehicles must meet the applicable FTP emission standards. From model year 2000, vehicles have to be additionally tested on two Supplemental Federal Test Procedures (SFTP) designed to address shortcomings with the FTP-75 in the representation of (1) aggressive, high speed driving (US06), and (2) the use of air conditioning (SC03).
CAFE fuel economy values are calculated on the basis of FTP and HWFET testing. Until model year 2007, EPA on-road fuel economy values shown on new vehicle’s labels were calculated on the basis of FTP testing for the city rating, while the HWFET test was used for the highway rating. Since model year 2008, the FTP is used for the determination of the EPA on-road fuel economy ratings using the EPA 5-cycle method. The 5-cycle results are calculated based on the results of two FTP tests—one regular and one cold temperature test, run at a lab temperature of 20°F (-6.7°C)—as well as the HWFET, US06 and SC03.
The FTP-75 cycle is known in Australia as the ADR 37 (Australian Design Rules) cycle and in Brazil as test standard NBR6601.
A four-segment variant of the FTP-75 cycle—where the stabilized phase is run again after the completion of the hot start phase—is sometimes used in certain applications, for instance in some hybrid vehicle tests.
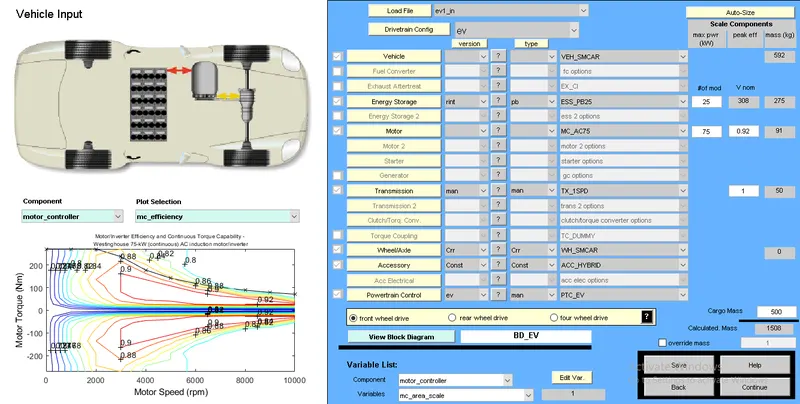
- Upon adding the advisor folder to the matlab path,the advisor.m file is loaded and the gui will be shown as below.
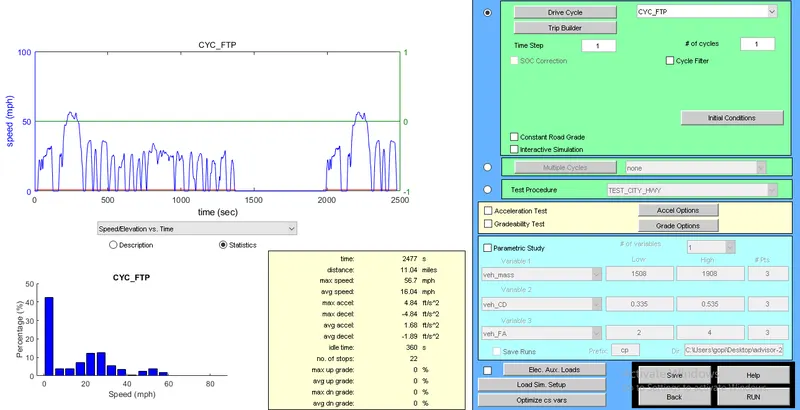
- After loading the file ev_defaults.in the cargo mass is adjusted to 500 and the gui is saved and continuing the gui in which required drive cycles along with their number to be selected is opened and as per the question FTP drive cycle is selected and number of cycles are incresed in steps such that the soc of battery becomes zero or dicharged and the amount of distance taht can be travelled by selected vehicle is obtained with respective time.
- Initially for one cycle of ftp cycle we can observe that
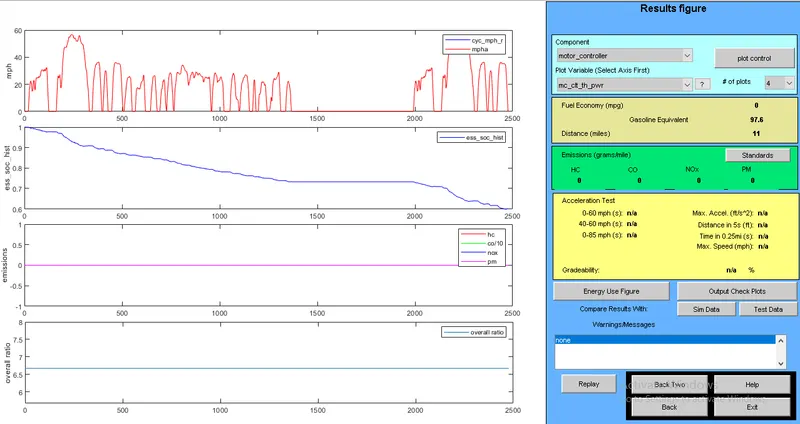
- the soc is reached to 60 percent and the vehicle has covered 11 miles,which is equal to 17.699 km. The soc and drive cycle plot are as shown.
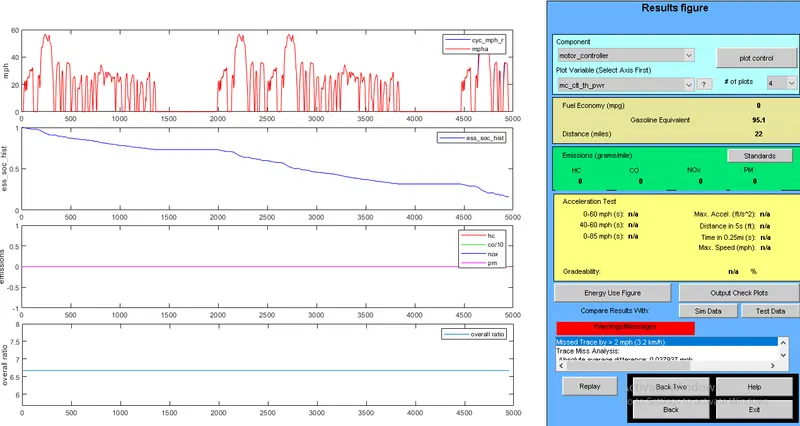
- For 2 cycles of travelling
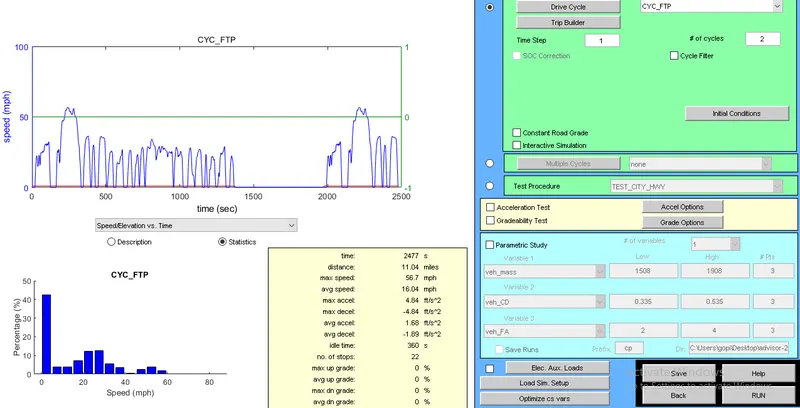
- The soc of battery has reached to about 10 percent and 22 miles which is equivalent to 35.398 km.
- It can be observed from the below figure.
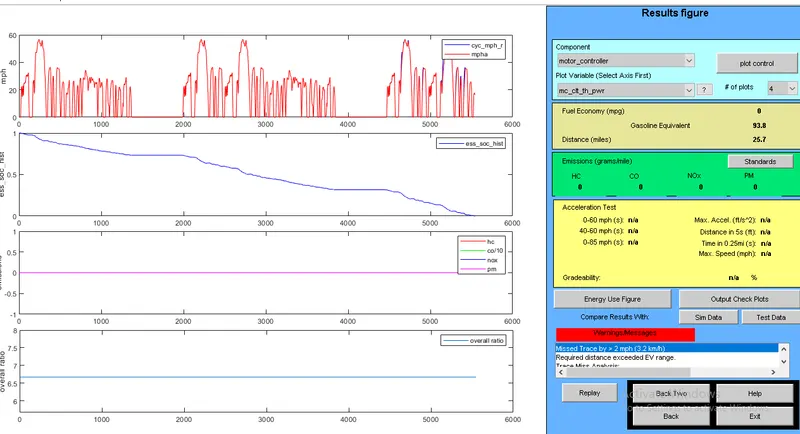
- For 3 cycles of travelling the soc of battery has reached zero and completely disharged.
- We can infer that the vehicle can travel up to 25.7 miles which is 25.7*1.609=41.35 km .
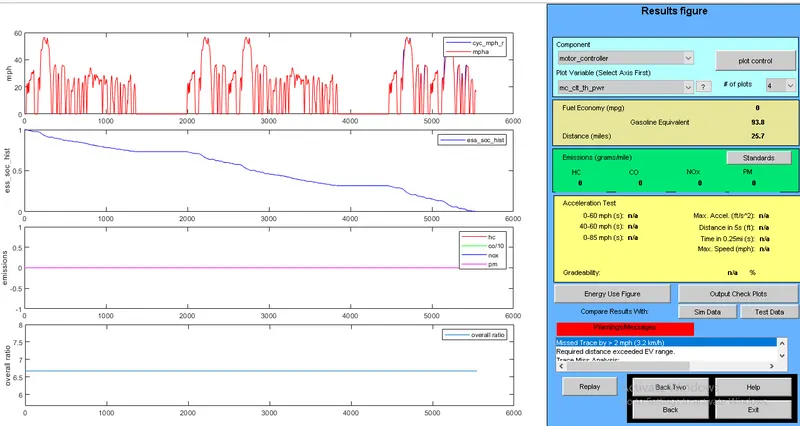
Thus we can infer that the vehicle cannot travel 45km with the preset capacity of 25 kw and to do so various parameters need to be changed.
And also we can observe when the number of cycles has been increased to 4 there in no much change as soc of battery is zero .
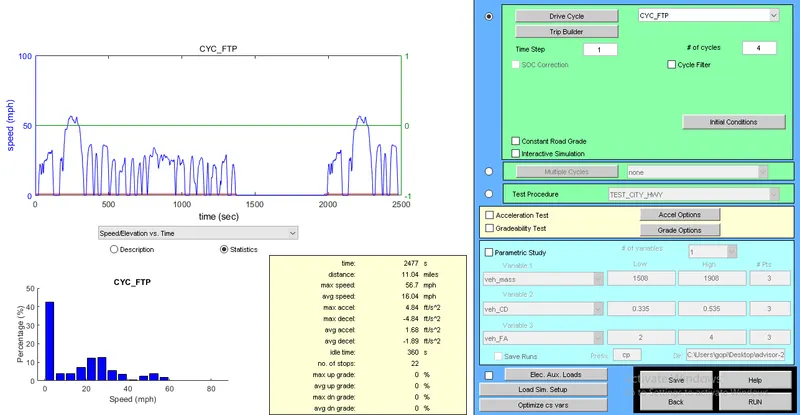
And thus vehicle can travel only up to 41.35km and not 45km .
2. In the above case, try changing the battery capacity and repeat the simulation.
In order to increase the range of vehicle traveled, various trade offs need to be made like decreasing mass,increasing battery capacity etc.
So, if we increase the battery capacity from 25kw(preset model) to 35 kw and by varying the drive cycles
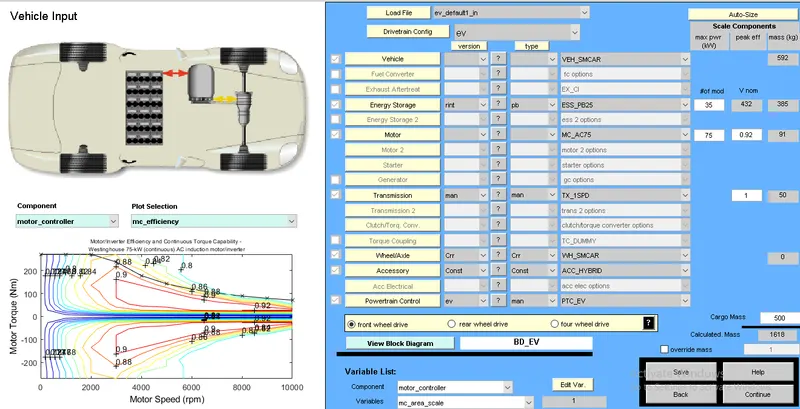
- First for 3 drive cycles with FTP cycle we can observe that the vehicle can travel 33.1 miles which is equal to 53.2 km.
- And soc has reached to about 6 percent,as shown in below plot.
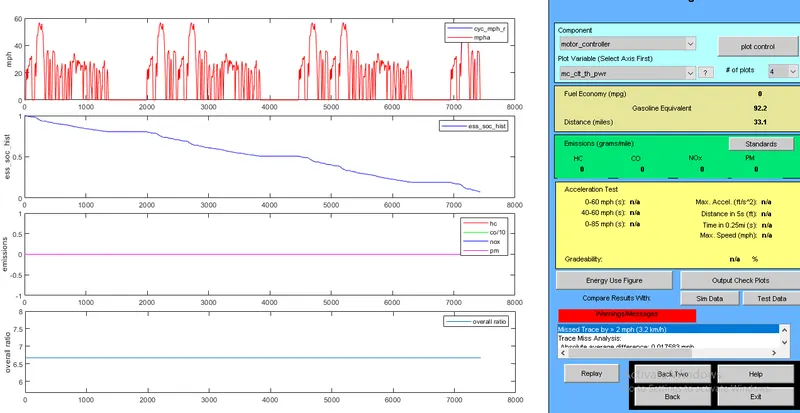
- With 35kw, 4 drivecycles we get about 35.1 miles which is equal to 56.47 km and we can observe that soc is 0 i.e battery completely discharged.
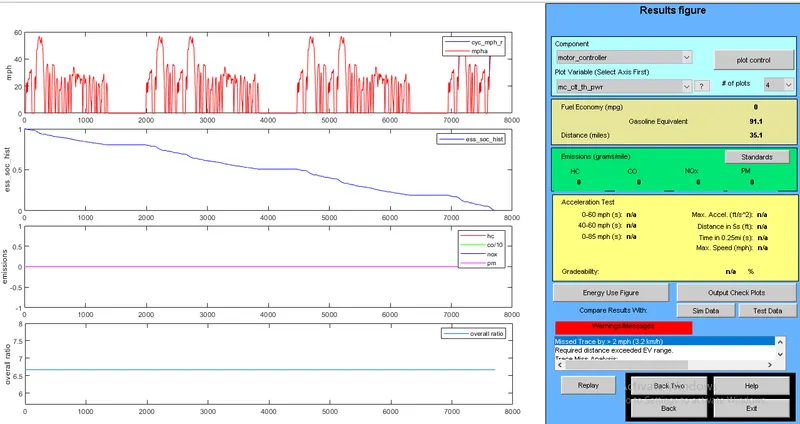
So, if we increase the battery capacity from 35kw to 45 kw and by varying the drive cycles
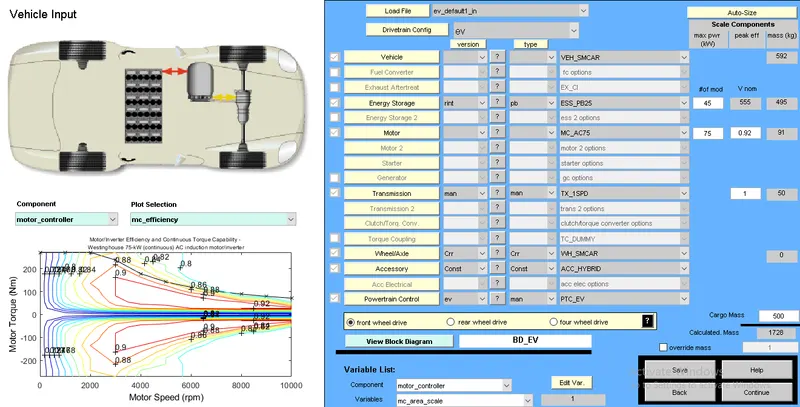
- First for 3 drive cycles with FTP cycle we can observe that the vehicle can travel 33.1 miles which is equal to 53.2 km.
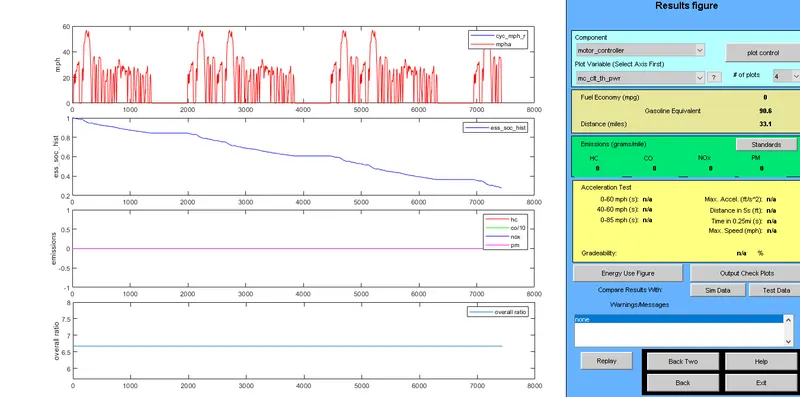
- And soc has reached to about 6 percent,as shown in below plot.
- With 45kw, 4 drivecycles we get about 44.1 miles which is equal to 70.95 km and we can observe that soc is 0 i.e battery completely discharged.
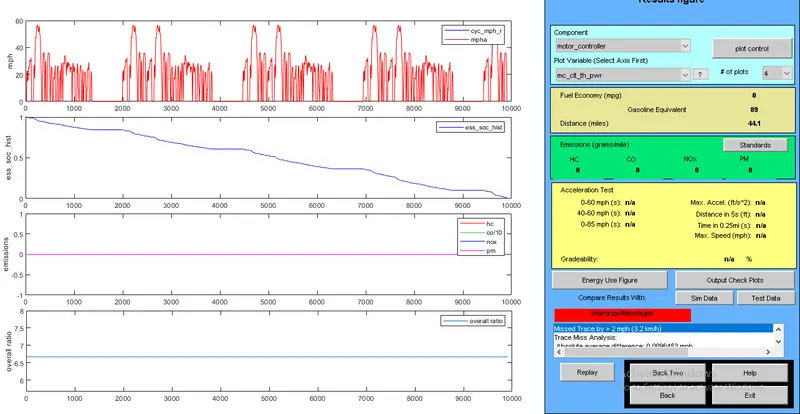
- We can infer that as the battery capacity is increased from 25 kw to 45 kw the distance or the range covered by the vehicle has increased from 41.35 km to 70.95km which is shown in two steps above that is for 35kw and 45 kw.
3. Perform gradeability test with PRIUS_Jpn_defaults_in file
Compare your results in table and conclude.
A.The Toyota Prius is a car built by Toyota which has a hybrid drivetrain, combining an internal combustion engine with an electric motor. It was initially offered as a 4-door sedan, it has been produced only as a 5-door liftback since 2003. In 2007, the United States Environmental Protection Agency and California Air Resources Board rated the Prius as among the cleanest vehicles sold in the United States on the basis of smog-forming emissions. The 2018 model year Prius Eco ranked as the second-most-fuel-efficient gasoline-powered car without plug-in capability available in the US that year, following the Hyundai Ioniq Blue hybrid. The Prius first went on sale in Japan in 1997, and was available at all four Toyota Japan dealership chains, making it the first mass-produced hybrid vehicle. It was subsequently introduced worldwide in 2000. Toyota sells the Prius in over 90 markets, with Japan and the United States being its largest markets.
Upon loading the PRIUS_Jpn_defaults_in file we get the following gui as shown below with various parameters to vary and observe results.
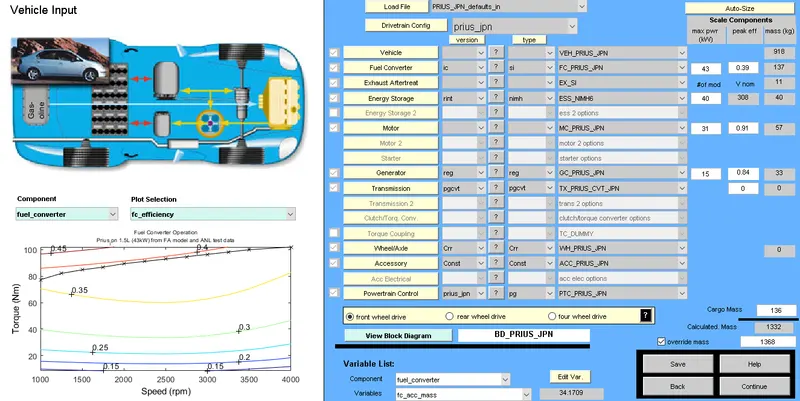
- FTP Drive cycle with 4 cycles is selected and
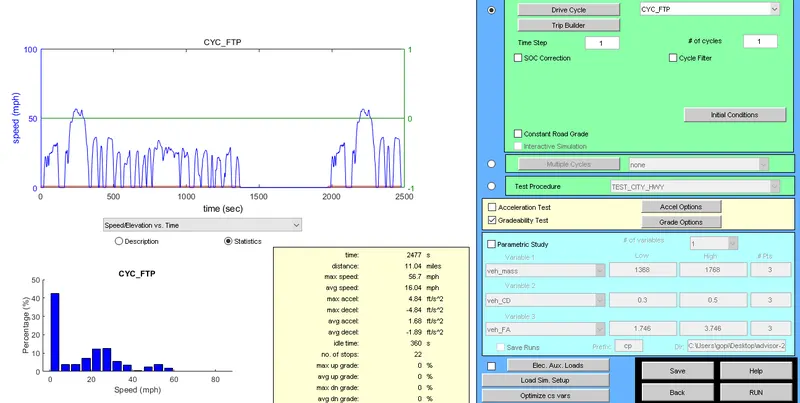
- when gradeability option is selected the following dialogue box opens up and by changing the speed in steps along with duration we observe results of gradeabity.
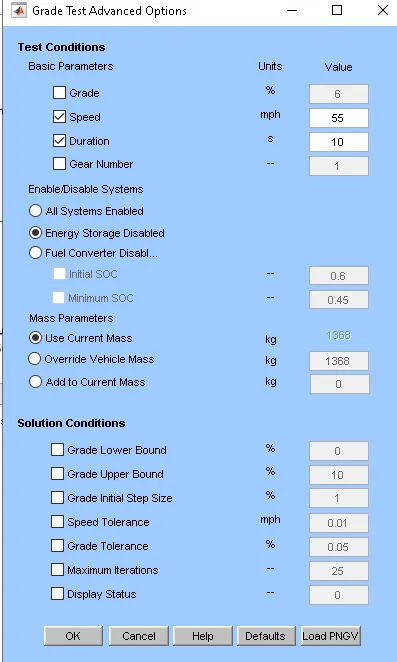
By selecting gradeability option we will be able to access above box with variable parameters such as speed and duration.
By changing the speed from 25 mph to 65 mph we observe the change in gradeability.
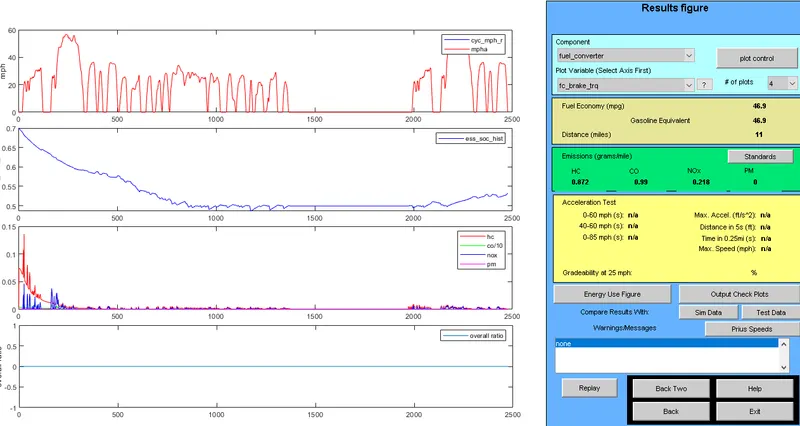
- We can infer that when the prius is travelling with 25mph cannot take any slope as shown below in plot.
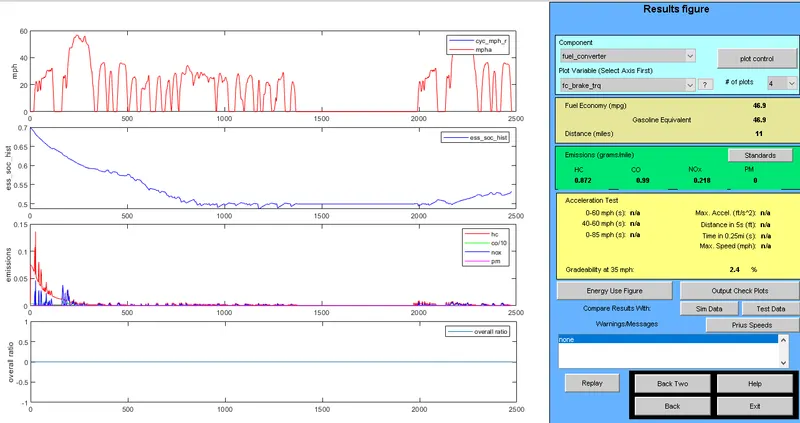
- We can infer that when the prius is travelling with 35 mph can take any slope with gradeability of 2.4% as shown in below plot.
- We can infer that when the prius is travelling with 45 mph can take any slope with gradeability of 2.2% as shown in below plot.
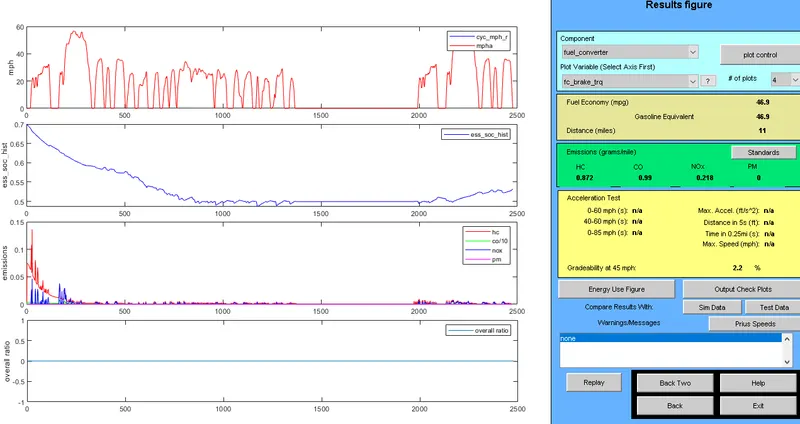
- We can infer that when the prius is travelling with 45 mph can take any slope with gradeability of 1.7% as shown in below plot.
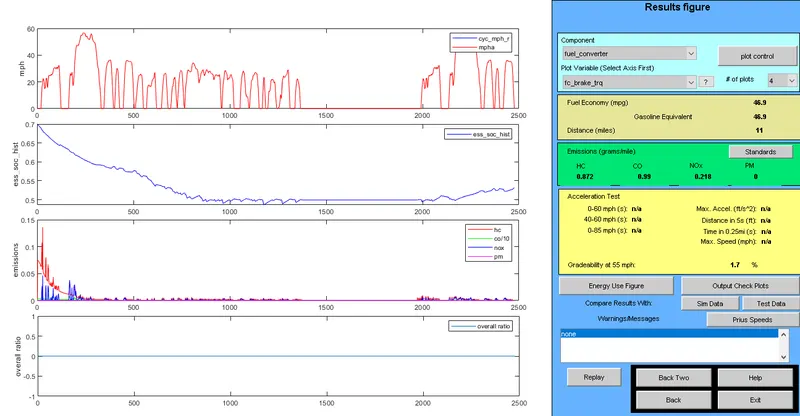
- We can infer that when the prius is travelling with 45 mph can take any slope with gradeability of 1.2% as shown in below plot.
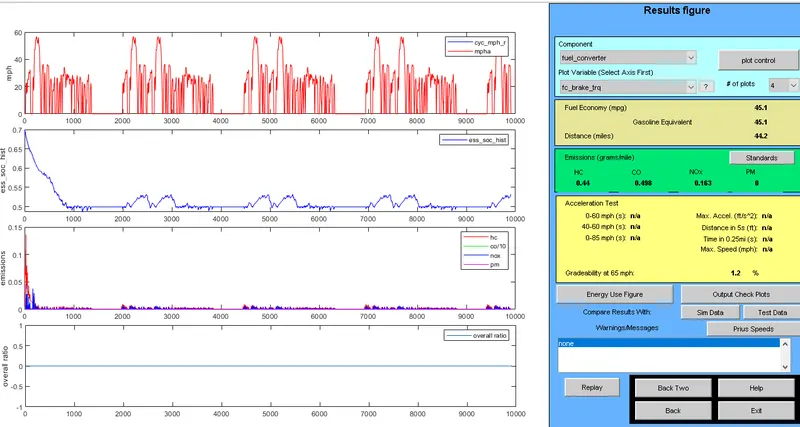
- We can summarize the above results in tabular form and can be shown as
| S.NO | VELOCITY(MPH) | Gradeability |
| 1 | 25 | - |
| 2 | 35 | 1.2% |
| 3 | 45 | 1.7% |
| 4 | 55 | 2.2% |
| 5 | 65 | 2.4% |
- Thus as the speed of a vehicle increase the gradeability decreases and thus if vehicles can maintain certain constant speed the fly overs can be crossed easily as per the gradeability of flyover.
- And also during construction of flyover in order to maintain certain gradebility this study will be useful.