Week 2 Railwheel and Track
Railwheel and Track Analysis and Use of User-defined function for displacement
Objective:
To Perform a static structural analysis on the Railwheel and Track setup and
Case 1: Multiply the bearing load by 5 times and compare the results with the load of 100000 N. Compare the Total Deformation, Equivalent stress, and the life under both the loads
Case 2: Implement a User-defined result and calculate the Total Deformation from this result and check if it is the same as that obtained by the inbuilt result by ANSYS for a load of 100000 N.
Setup:
Model used: Rail Wheel model provided by Skill-Lync
Software tool: ANSYS Workbench R19
Material used: Structural Steel
Material properties:
Case 1:
A) 100000 N Load
- Setup: A new Static Structural study was created in ANSYS Workbench.
- Boundary conditions: Structural steel was applied as the material.
- Frictionless contact is established between shaft and wheel and friction contact is established between wheel and track.
- The track is secured using a fixed joint and the motion of the wheel is defined using a translational joint for 500 mm and a planar joint to keep the wheel rotating in the same plane.
- Mesh: A mesh size of 50 mm is chosen for all bodies and then a finer mesh of 35mm is chosen for certain surfaces where refinement is required using face sizing.
- Loads: A bearing load of 100000 N was applied and a displacement of 500mm was defined to replicate the motion of the wheel on the track.
- Results: The mesh is generated and Stress, Deformation, and life as chosen as the solutions to be evaluated. The results are tabulated in the results section of the report.
- A user-defined formula for displacement is also calculated to verify against the simulation generated result. The formula used is as follows:
- `D=sqrt(ux^2+uy^2 +uz^2)`
Result images:
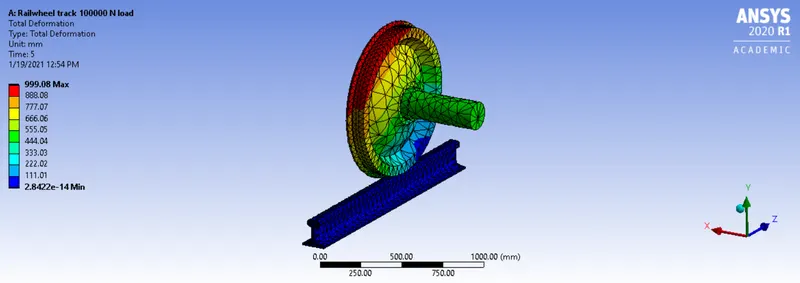
Figure 1: Total Deformation with 100000 N bearing load
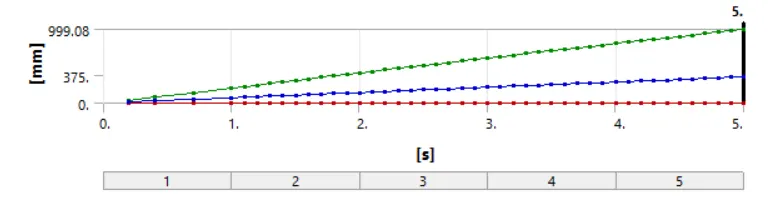
Figure 2: Total Deformation plot with 100000 N bearing load
| Time [s] | Minimum [mm] |
Maximum [mm] |
Average [mm] |
|
| 1 | 0.2 | 0 | 40.174 | 14.117 |
| 2 | 0.4 | 0 | 81.289 | 28.52 |
| 3 | 0.7 | 0 | 143 | 50.15 |
| 4 | 1 | 0 | 204.59 | 71.754 |
| 5 | 1.1 | 0 | 225.05 | 78.939 |
| 6 | 1.2 | 0 | 245.46 | 86.111 |
| 7 | 1.3 | 0 | 265.9 | 93.295 |
| 8 | 1.4 | 0 | 286.27 | 100.46 |
| 9 | 1.5 | 0 | 306.71 | 107.65 |
| 10 | 1.6 | 0 | 327.07 | 114.82 |
| 11 | 1.7 | 0 | 347.45 | 121.99 |
| 12 | 1.8 | 0 | 367.76 | 129.14 |
| 13 | 1.9 | 0 | 388.04 | 136.28 |
| 14 | 2 | 0 | 408.34 | 143.43 |
| 15 | 2.1 | 0 | 428.54 | 150.57 |
| 16 | 2.2 | 0 | 448.79 | 157.71 |
| 17 | 2.3 | 0 | 468.91 | 164.83 |
| 18 | 2.4 | 0 | 489.07 | 171.97 |
| 19 | 2.5 | 0 | 509.19 | 179.08 |
| 20 | 2.6 | 0 | 529.26 | 186.19 |
| 21 | 2.7 | 0 | 549.38 | 193.31 |
| 22 | 2.8 | 0 | 569.34 | 200.39 |
| 23 | 2.9 | 0 | 589.47 | 207.49 |
| 24 | 3 | 0 | 609.42 | 214.56 |
| 25 | 3.1 | 0 | 629.41 | 221.65 |
| 26 | 3.2 | 0 | 649.28 | 228.7 |
| 27 | 3.3 | 0 | 669.07 | 235.75 |
| 28 | 3.4 | 0 | 688.91 | 242.81 |
| 29 | 3.5 | 0 | 708.55 | 249.83 |
| 30 | 3.6 | 0 | 728.3 | 256.86 |
| 31 | 3.7 | 0 | 747.92 | 263.86 |
| 32 | 3.8 | 0 | 767.5 | 270.86 |
| 33 | 3.9 | 2.84E-14 | 787.2 | 277.87 |
| 34 | 4 | 2.84E-14 | 806.71 | 284.86 |
| 35 | 4.1 | 2.84E-14 | 826.29 | 291.86 |
| 36 | 4.2 | 2.84E-14 | 845.62 | 298.81 |
| 37 | 4.3 | 2.84E-14 | 864.93 | 305.77 |
| 38 | 4.4 | 2.84E-14 | 884.17 | 312.72 |
| 39 | 4.5 | 2.84E-14 | 903.41 | 319.64 |
| 40 | 4.6 | 2.84E-14 | 922.71 | 326.58 |
| 41 | 4.7 | 2.84E-14 | 941.81 | 333.48 |
| 42 | 4.8 | 2.84E-14 | 960.98 | 340.41 |
| 43 | 4.9 | 2.84E-14 | 980.06 | 347.28 |
| 44 | 5 | 2.84E-14 | 999.08 | 354.15 |
Table 1: Total Deformation table with 100000 N bearing load
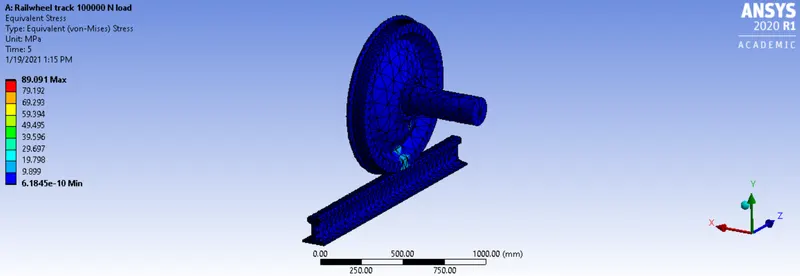
Figure 3: Equivalent Stress with 100000 N bearing load
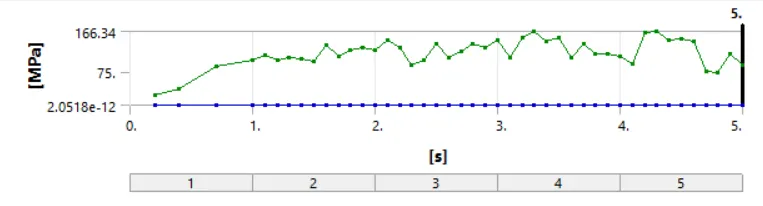
Figure 4: Equivalent Stress plot with 100000 N bearing load
| Time [s] | Minimum [mm] |
Maximum [mm] |
Average [mm] |
|
| 1 | 0.2 | 2.05E-12 | 21.766 | 0.236 |
| 2 | 0.4 | 4.92E-12 | 35.407 | 0.47642 |
| 3 | 0.7 | 1.23E-11 | 88.045 | 0.83552 |
| 4 | 1 | 1.72E-11 | 102.83 | 1.1679 |
| 5 | 1.1 | 1.60E-11 | 111.53 | 1.2039 |
| 6 | 1.2 | 1.86E-11 | 100.9 | 1.1748 |
| 7 | 1.3 | 1.79E-11 | 107.94 | 1.2043 |
| 8 | 1.4 | 2.40E-11 | 103.86 | 1.2138 |
| 9 | 1.5 | 2.43E-11 | 99.228 | 1.2017 |
| 10 | 1.6 | 3.20E-11 | 135.6 | 1.1922 |
| 11 | 1.7 | 3.57E-11 | 108.82 | 1.1716 |
| 12 | 1.8 | 3.98E-11 | 125.14 | 1.211 |
| 13 | 1.9 | 4.74E-11 | 128.33 | 1.1672 |
| 14 | 2 | 4.89E-11 | 124.68 | 1.1994 |
| 15 | 2.1 | 5.49E-11 | 146.69 | 1.2079 |
| 16 | 2.2 | 5.65E-11 | 128.54 | 1.1815 |
| 17 | 2.3 | 5.88E-11 | 89.674 | 1.1808 |
| 18 | 2.4 | 5.98E-11 | 100.14 | 1.165 |
| 19 | 2.5 | 6.02E-11 | 137.14 | 1.2174 |
| 20 | 2.6 | 6.44E-11 | 106.77 | 1.1849 |
| 21 | 2.7 | 6.31E-11 | 121.92 | 1.2143 |
| 22 | 2.8 | 7.57E-11 | 138.83 | 1.264 |
| 23 | 2.9 | 8.33E-11 | 129.24 | 1.2173 |
| 24 | 3 | 1.03E-10 | 146.25 | 1.235 |
| 25 | 3.1 | 1.12E-10 | 108.09 | 1.2058 |
| 26 | 3.2 | 1.18E-10 | 153.64 | 1.2373 |
| 27 | 3.3 | 1.30E-10 | 165.37 | 1.2082 |
| 28 | 3.4 | 1.24E-10 | 142.71 | 1.1497 |
| 29 | 3.5 | 1.51E-10 | 151.97 | 1.1948 |
| 30 | 3.6 | 1.56E-10 | 105.91 | 1.1478 |
| 31 | 3.7 | 1.68E-10 | 138.76 | 1.2695 |
| 32 | 3.8 | 1.47E-10 | 114.4 | 1.2171 |
| 33 | 3.9 | 1.50E-10 | 115.63 | 1.225 |
| 34 | 4 | 1.70E-10 | 108.96 | 1.1773 |
| 35 | 4.1 | 1.81E-10 | 92.867 | 1.168 |
| 36 | 4.2 | 2.27E-10 | 164.07 | 1.2435 |
| 37 | 4.3 | 2.63E-10 | 166.34 | 1.2194 |
| 38 | 4.4 | 2.86E-10 | 145.44 | 1.2505 |
| 39 | 4.5 | 3.22E-10 | 148.66 | 1.2247 |
| 40 | 4.6 | 3.34E-10 | 143.35 | 1.2113 |
| 41 | 4.7 | 3.79E-10 | 75.253 | 1.1833 |
| 42 | 4.8 | 3.81E-10 | 71.976 | 1.1613 |
| 43 | 4.9 | 4.50E-10 | 115.36 | 1.1889 |
| 44 | 5 | 6.18E-10 | 89.091 | 1.1666 |
Table 2: Equivalent Stress table with 100000 N bearing load
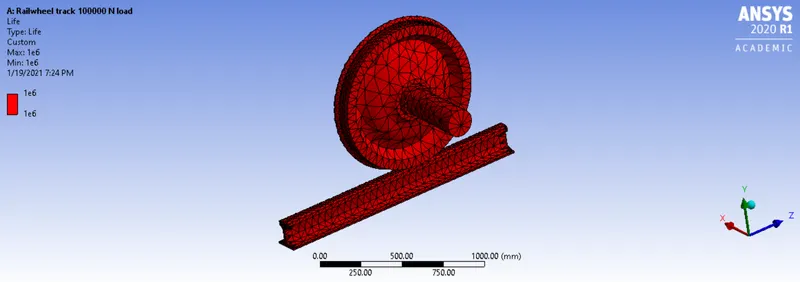
Figure 5: Life with 100000 N bearing load
B) 500000 N Load
- Setup: A new Static Structural study was created in ANSYS Workbench.
- Boundary conditions: Structural steel was applied as the material.
- Frictionless contact is established between shaft and wheel and friction contact is established between wheel and track.
- The track is secured using a fixed joint and the motion of the wheel is defined using a translational joint for 500 mm and a planar joint to keep the wheel rotating in the same plane.
- Mesh: A mesh size of 50 mm is chosen for all bodies and then a finer mesh of 35mm is chosen for certain surfaces where refinement is required using face sizing.
- Loads: A bearing load of 500000 N was applied and a displacement of 500mm was defined to replicate the motion of the wheel on the track.
- Results: The mesh is generated and Stress, Deformation, and life as chosen as the solutions to be evaluated. The results are tabulated in the results section of the report.
Result images:
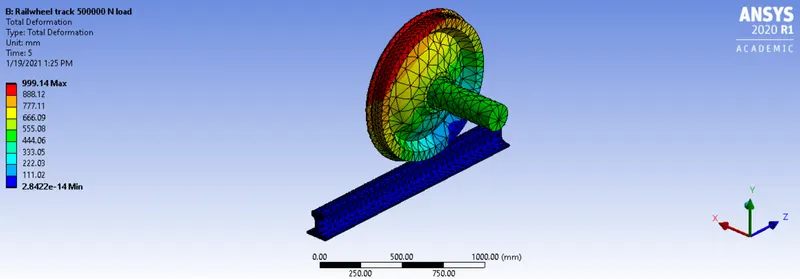
Figure 7: Total Deformation with 500000 N bearing load
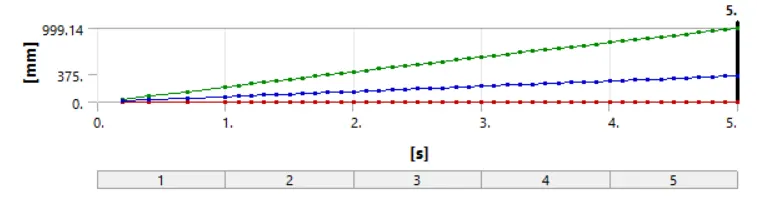
Figure 8: Total Deformation plot with 500000 N bearing load
| Time [s] | Minimum [mm] |
Maximum [mm] |
Average [mm] |
|
| 1 | 0.2 | 0 | 40.174 | 14.117 |
| 2 | 0.4 | 0 | 81.289 | 28.52 |
| 3 | 0.7 | 0 | 143 | 50.15 |
| 4 | 1 | 0 | 204.59 | 71.754 |
| 5 | 1.1 | 0 | 225.05 | 78.939 |
| 6 | 1.2 | 0 | 245.46 | 86.111 |
| 7 | 1.3 | 0 | 265.9 | 93.295 |
| 8 | 1.4 | 0 | 286.27 | 100.46 |
| 9 | 1.5 | 0 | 306.71 | 107.65 |
| 10 | 1.6 | 0 | 327.07 | 114.82 |
| 11 | 1.7 | 0 | 347.45 | 121.99 |
| 12 | 1.8 | 0 | 367.76 | 129.14 |
| 13 | 1.9 | 0 | 388.04 | 136.28 |
| 14 | 2 | 0 | 408.34 | 143.43 |
| 15 | 2.1 | 0 | 428.54 | 150.57 |
| 16 | 2.2 | 0 | 448.79 | 157.71 |
| 17 | 2.3 | 0 | 468.91 | 164.83 |
| 18 | 2.4 | 0 | 489.07 | 171.97 |
| 19 | 2.5 | 0 | 509.19 | 179.08 |
| 20 | 2.6 | 0 | 529.26 | 186.19 |
| 21 | 2.7 | 0 | 549.38 | 193.31 |
| 22 | 2.8 | 0 | 569.34 | 200.39 |
| 23 | 2.9 | 0 | 589.47 | 207.49 |
| 24 | 3 | 0 | 609.42 | 214.56 |
| 25 | 3.1 | 0 | 629.41 | 221.65 |
| 26 | 3.2 | 0 | 649.28 | 228.7 |
| 27 | 3.3 | 0 | 669.07 | 235.75 |
| 28 | 3.4 | 0 | 688.91 | 242.81 |
| 29 | 3.5 | 0 | 708.55 | 249.83 |
| 30 | 3.6 | 0 | 728.3 | 256.86 |
| 31 | 3.7 | 0 | 747.92 | 263.86 |
| 32 | 3.8 | 0 | 767.5 | 270.86 |
| 33 | 3.9 | 2.84E-14 | 787.2 | 277.87 |
| 34 | 4 | 2.84E-14 | 806.71 | 284.86 |
| 35 | 4.1 | 2.84E-14 | 826.29 | 291.86 |
| 36 | 4.2 | 2.84E-14 | 845.62 | 298.81 |
| 37 | 4.3 | 2.84E-14 | 864.93 | 305.77 |
| 38 | 4.4 | 2.84E-14 | 884.17 | 312.72 |
| 39 | 4.5 | 2.84E-14 | 903.41 | 319.64 |
| 40 | 4.6 | 2.84E-14 | 922.71 | 326.58 |
| 41 | 4.7 | 2.84E-14 | 941.81 | 333.48 |
| 42 | 4.8 | 2.84E-14 | 960.98 | 340.41 |
| 43 | 4.9 | 2.84E-14 | 980.06 | 347.28 |
| 44 | 5 | 2.84E-14 | 999.08 | 354.15 |
Table 3: Total Deformation table with 500000 N bearing load
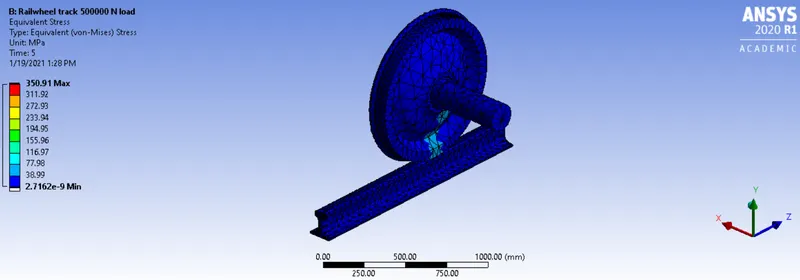
Figure 9: Equivalent Stress with 500000 N bearing load
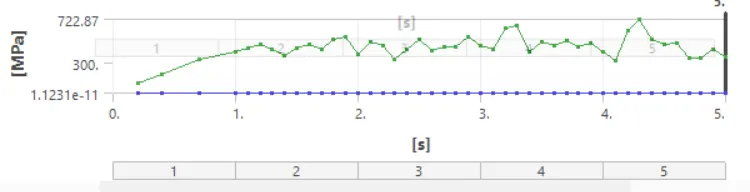
Figure 10: Equivalent Stress plot with 500000 N bearing load
| Time [s] | Minimum [mm] |
Maximum [mm] |
Average [mm] |
|
| 1 | 0.2 | 2.05E-12 | 21.766 | 0.236 |
| 2 | 0.4 | 4.92E-12 | 35.407 | 0.47642 |
| 3 | 0.7 | 1.23E-11 | 88.045 | 0.83552 |
| 4 | 1 | 1.72E-11 | 102.83 | 1.1679 |
| 5 | 1.1 | 1.60E-11 | 111.53 | 1.2039 |
| 6 | 1.2 | 1.86E-11 | 100.9 | 1.1748 |
| 7 | 1.3 | 1.79E-11 | 107.94 | 1.2043 |
| 8 | 1.4 | 2.40E-11 | 103.86 | 1.2138 |
| 9 | 1.5 | 2.43E-11 | 99.228 | 1.2017 |
| 10 | 1.6 | 3.20E-11 | 135.6 | 1.1922 |
| 11 | 1.7 | 3.57E-11 | 108.82 | 1.1716 |
| 12 | 1.8 | 3.98E-11 | 125.14 | 1.211 |
| 13 | 1.9 | 4.74E-11 | 128.33 | 1.1672 |
| 14 | 2 | 4.89E-11 | 124.68 | 1.1994 |
| 15 | 2.1 | 5.49E-11 | 146.69 | 1.2079 |
| 16 | 2.2 | 5.65E-11 | 128.54 | 1.1815 |
| 17 | 2.3 | 5.88E-11 | 89.674 | 1.1808 |
| 18 | 2.4 | 5.98E-11 | 100.14 | 1.165 |
| 19 | 2.5 | 6.02E-11 | 137.14 | 1.2174 |
| 20 | 2.6 | 6.44E-11 | 106.77 | 1.1849 |
| 21 | 2.7 | 6.31E-11 | 121.92 | 1.2143 |
| 22 | 2.8 | 7.57E-11 | 138.83 | 1.264 |
| 23 | 2.9 | 8.33E-11 | 129.24 | 1.2173 |
| 24 | 3 | 1.03E-10 | 146.25 | 1.235 |
| 25 | 3.1 | 1.12E-10 | 108.09 | 1.2058 |
| 26 | 3.2 | 1.18E-10 | 153.64 | 1.2373 |
| 27 | 3.3 | 1.30E-10 | 165.37 | 1.2082 |
| 28 | 3.4 | 1.24E-10 | 142.71 | 1.1497 |
| 29 | 3.5 | 1.51E-10 | 151.97 | 1.1948 |
| 30 | 3.6 | 1.56E-10 | 105.91 | 1.1478 |
| 31 | 3.7 | 1.68E-10 | 138.76 | 1.2695 |
| 32 | 3.8 | 1.47E-10 | 114.4 | 1.2171 |
| 33 | 3.9 | 1.50E-10 | 115.63 | 1.225 |
| 34 | 4 | 1.70E-10 | 108.96 | 1.1773 |
| 35 | 4.1 | 1.81E-10 | 92.867 | 1.168 |
| 36 | 4.2 | 2.27E-10 | 164.07 | 1.2435 |
| 37 | 4.3 | 2.63E-10 | 166.34 | 1.2194 |
| 38 | 4.4 | 2.86E-10 | 145.44 | 1.2505 |
| 39 | 4.5 | 3.22E-10 | 148.66 | 1.2247 |
| 40 | 4.6 | 3.34E-10 | 143.35 | 1.2113 |
| 41 | 4.7 | 3.79E-10 | 75.253 | 1.1833 |
| 42 | 4.8 | 3.81E-10 | 71.976 | 1.1613 |
| 43 | 4.9 | 4.50E-10 | 115.36 | 1.1889 |
| 44 | 5 | 6.18E-10 | 89.091 | 1.1666 |
Table 4: Equivalent Stress table with 500000 N bearing load
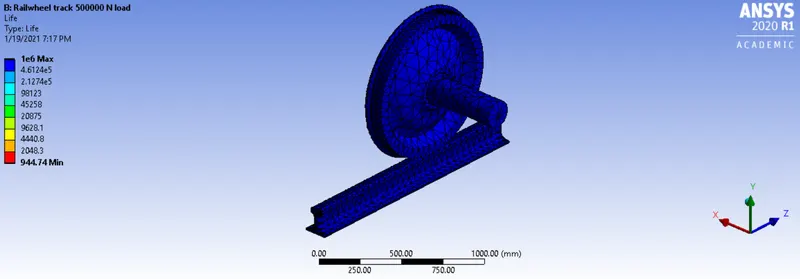
Figure 11: Life with 500000 N bearing load
Case 1 Results
- In the case of Stress, the maximum stress in case 1A (100000 N bearing load) is 89 MPa while in case 1B (500000 N bearing load) is 350 MPa. The yield strength of the material is 250 MPa thus failure will occur in case 1B because it exceeds maximum yield strength.
- The total deformation in both cases is comparable.
- The life for case 1A has a minimum value of 100000 cycles. For case 1B the minimum value of cycles is 944 before it can start to experience failure due to fatigue. This is because of the increased load.
Case 2 Results
The user-defined equation was used to simulate total deformation. the following is the result of that simulation.
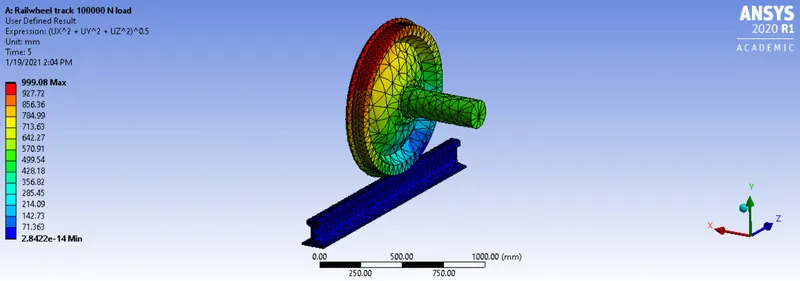
Figure 13: Total deformation using user-defined equation
As it can be compared to figure 1, the values through the user-defined equation and Ansys inbuilt function are the same thus validating each other.