Week 2 - Flow over a Cylinder.
Phenomenon of Karman vortex street.
In fluid dynamics, a Karman vortex street (or a von Karman vortex street) is a repeating pattern of swirling vortices, caused by a process known as vortex shedding, which is responsible for the unsteady separation of flow of a fluid around blunt bodies.
A vortex street will form only at a certain range of flow velocities, specified by a range of Reynolds numbers (Re), typically above a limiting Re value of about 90. The (global) Reynolds number for a flow is a measure of the ratio of inertial to viscous forces in the flow of a fluid around a body or in a channel, and may be defined as a nondimensional parameter of the global speed of the whole fluid flow.
vortex shedding is an oscillating flow that takes place when a fluid such as air or water flows past a bluff (as opposed to streamlined) body at certain velocities, depending on the size and shape of the body. In this flow, vortices are created at the back of the body and detach periodically from either side of the body forming a Von Karman vortex street. The fluid flow past the object creates alternating low-pressure vortices on the downstream side of the object. The object will tend to move toward the low-pressure zone.
PART-I
- Simulate the flow with the steady and unsteady case and calculate the Strouhal Number for Re= 100.
Geaometry
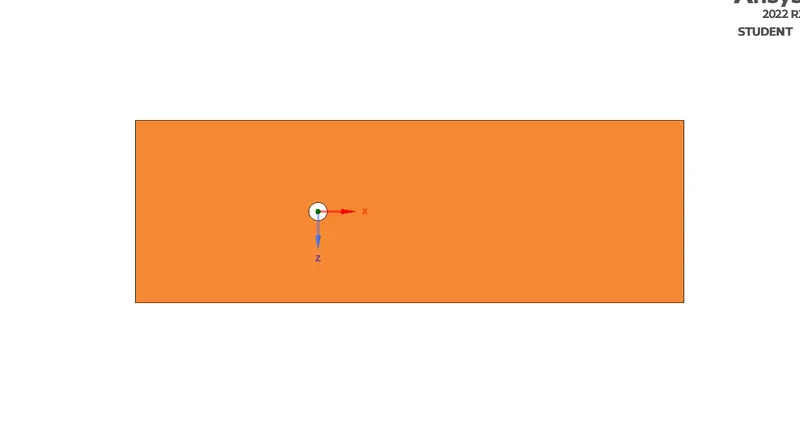
To design the following geometry in space claim
Set the units of distance to meters.
Draw a circle of 2m dia>draw construction lines on either side 20m on left, 40m on right side.
Then draw a rectangle using the construction lines.
Then click on pull to crate a surface then select the circle and press delete.
Meshing
Procedure
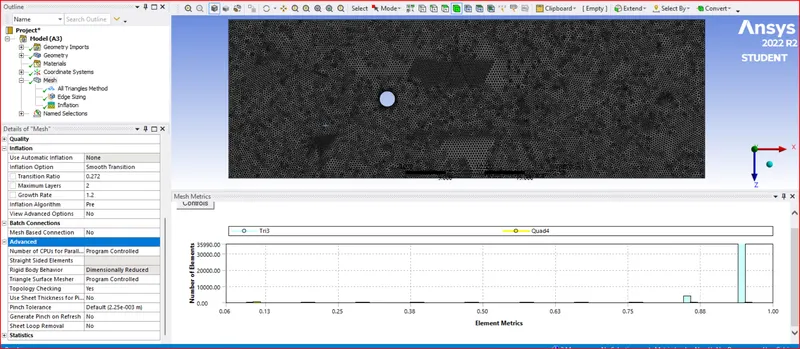
First generate mesh
right click on mesh>select method and elements as triangle elements>generate mesh.
Right click on mesh select element sizing
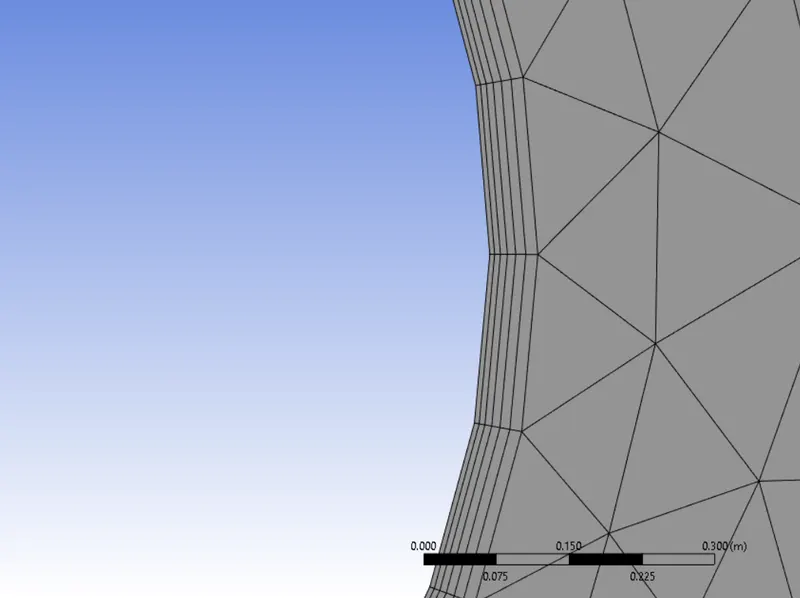
Right click on mesh select Inflation
Now create named selection.
Cylinder edge as wall, rectangle edges as symmetry boundary, Rectangle left end along x- axis as inlet and rectangle right end along x axis as outlet.
No of elements in the below mesh is 40204.
Mesh Inflation around the cylinder edge:
Setup
Domain:
Perform mesh check.
Evluate mech quality.
Solver type: pressure based.
Time: steady
Velocity formulation:Absolute.
Physics:
Energy box: uncheck since temperature is not measured.
Viscous>laminar.
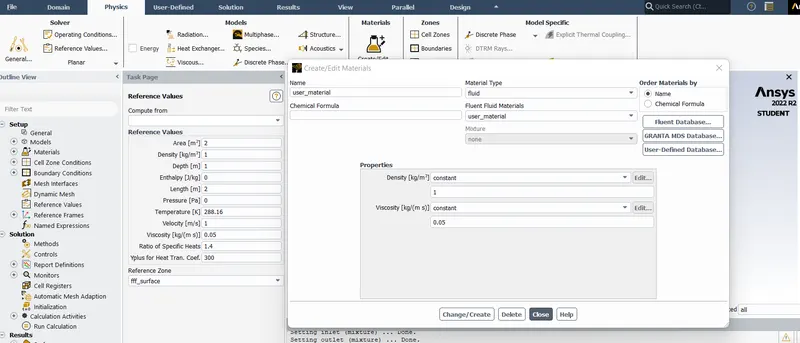
Materials>fluent database>select air>copy>name it as user_material>ok.
Cell zone:select fff surface>edit>material name select user material.
Boundaries:Inlet set vel as 1m/s.
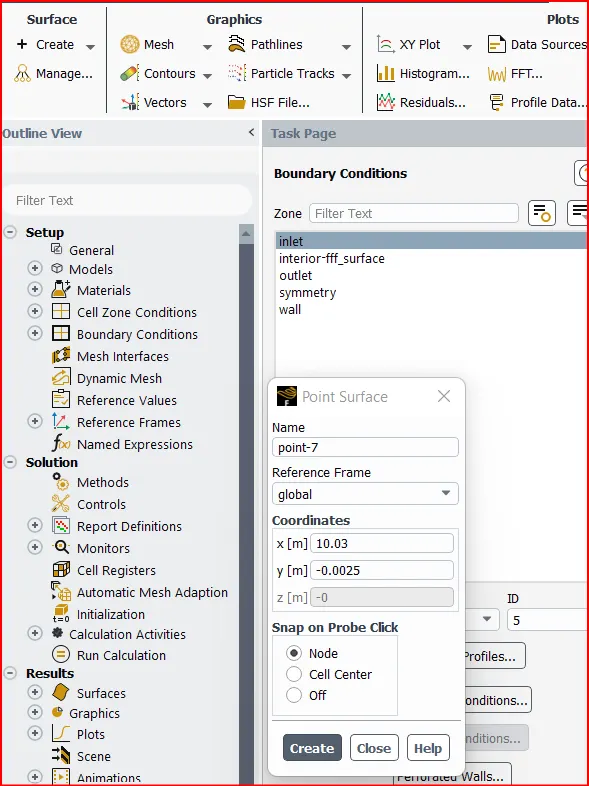
To Create Monitor point>Go to results>create>point> set point name and coordinates and click ok.
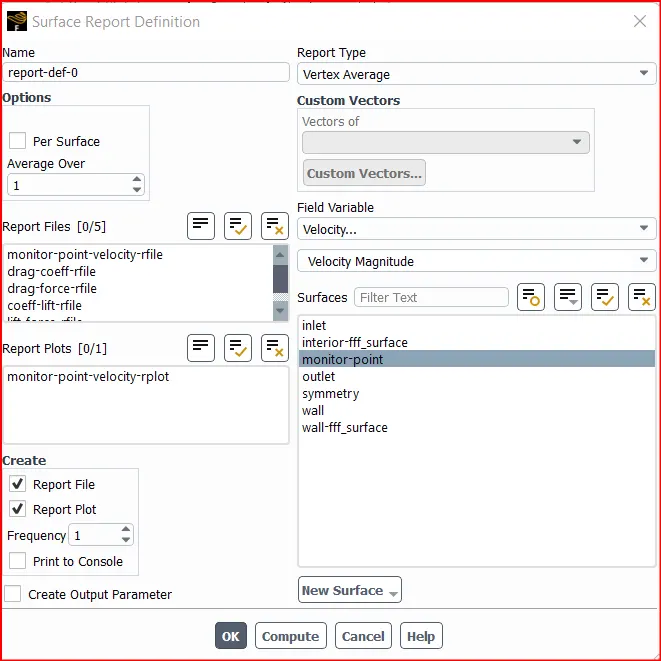
Go to solution>definitions>new>surface report>vertex average then following settings.
Solution
- Calculate the coefficient of drag and lift over a cylinder by setting the Reynolds number to 10,100,1000,10000 & 100000. (Run with steady solver)
Reynolds number 10.
velocity = 0.25 m/s.
density = 1 kg/m3.
viscosity = 0.05 Pa-s.
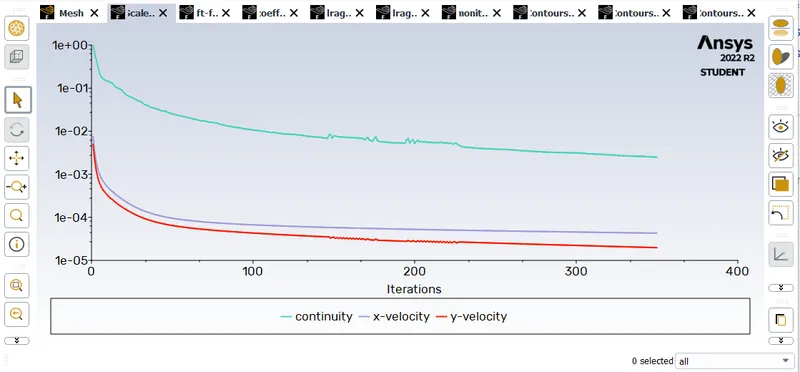
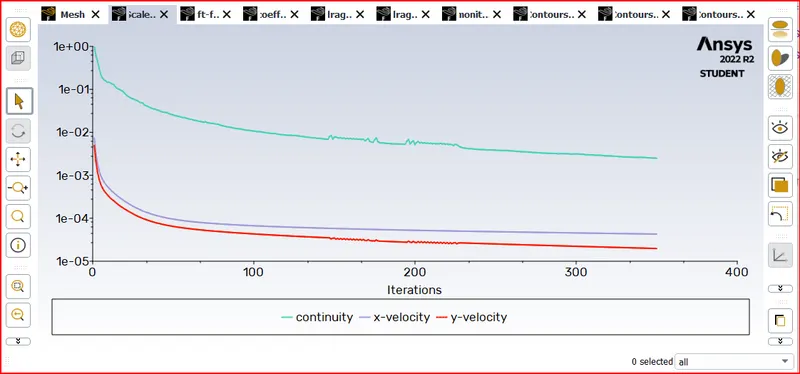
Scaled Residuals:
Plot of Lift Force:
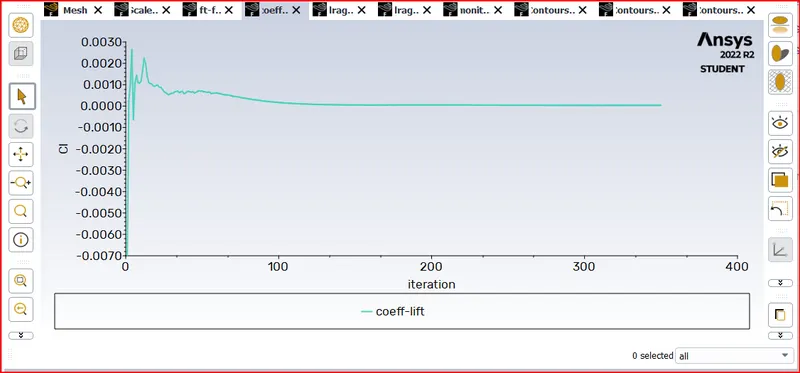
Coefficient of Lift:
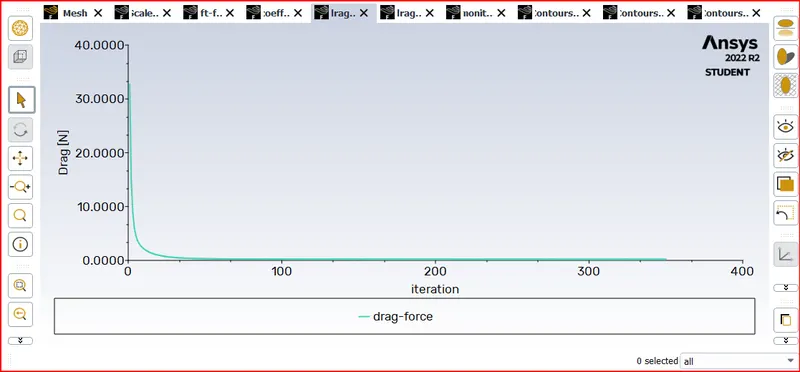
Drag Force
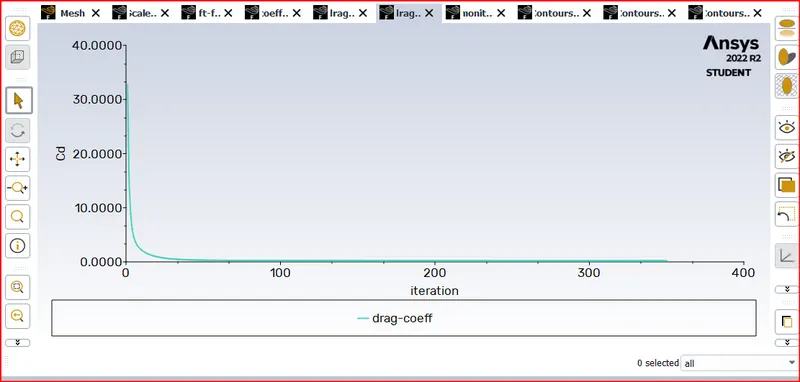
Drage coefficientL:
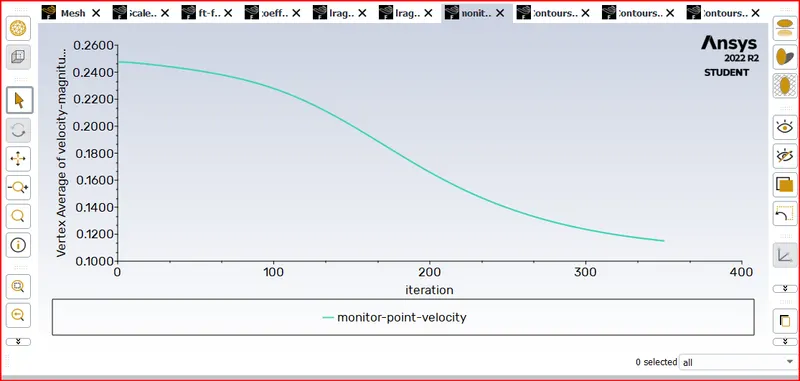
Monitor point velocity:
Contour plot
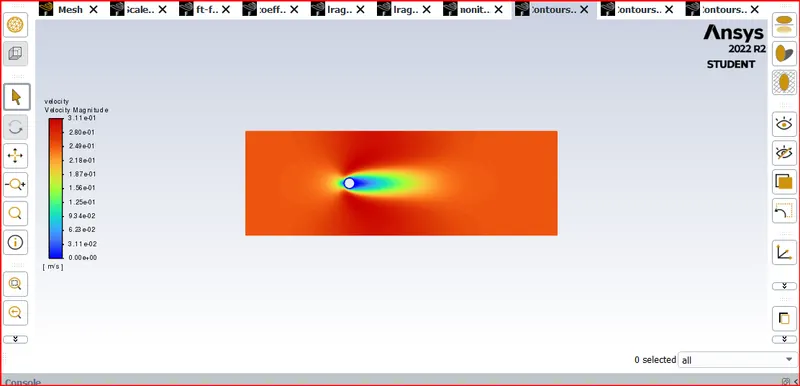
Hence for Reynolds no.10 no vortex shedding is observed.
Reynolds number 100.
velocity = 2.5 m/s.
density = 1 kg/m3.
viscosity = 0.05 Pa-s.
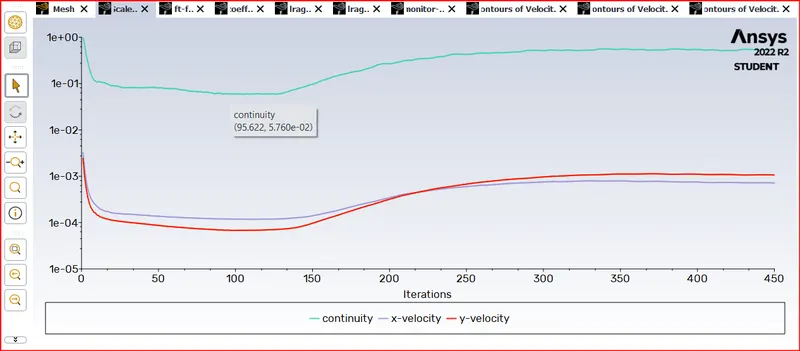
Scaled Residuals:
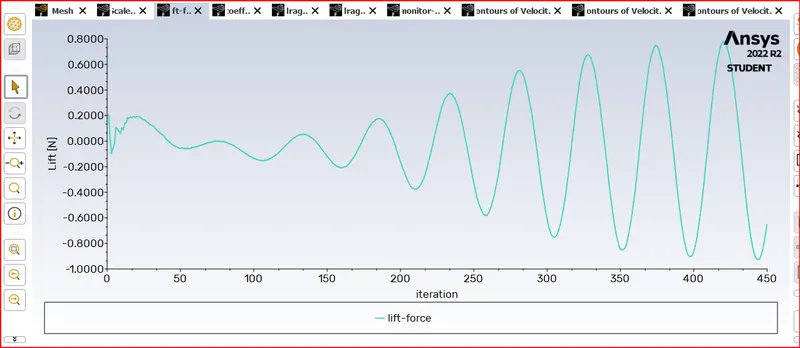
Plot of Lift Force:
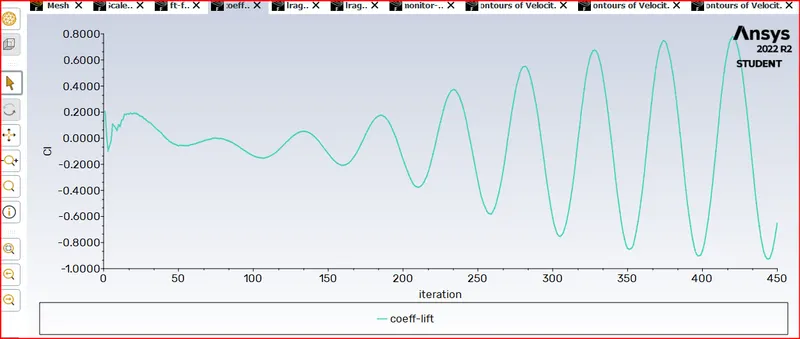
Coefficient of Lift:
Drag Force
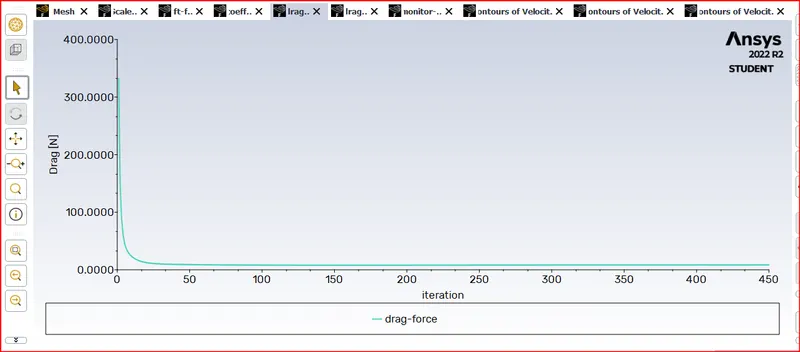
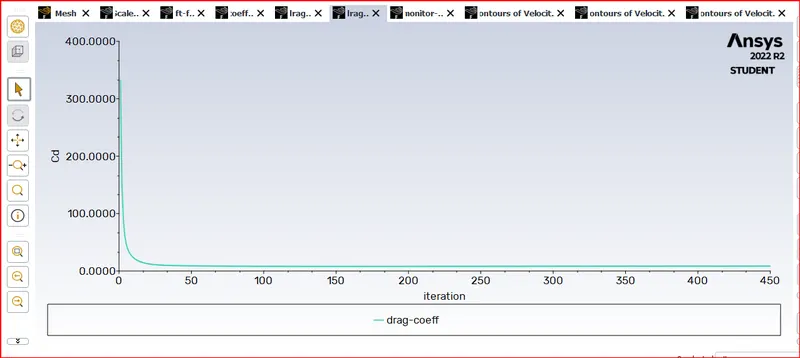
Drage coefficient:
Monitor point velocity:
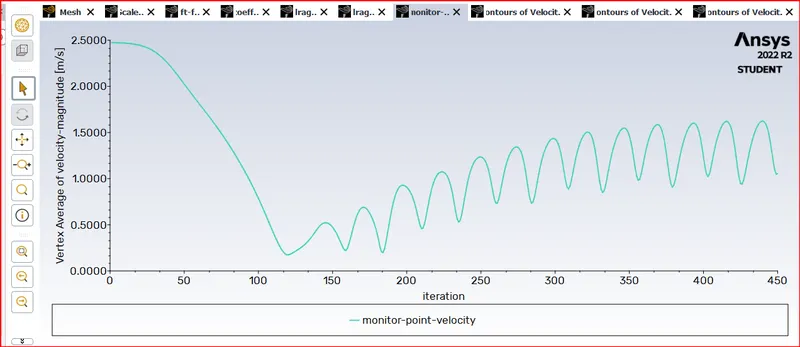
As seen in the above plot the flow has converged at around 200 iterations since the velocity variation seems periodic
Contour plot
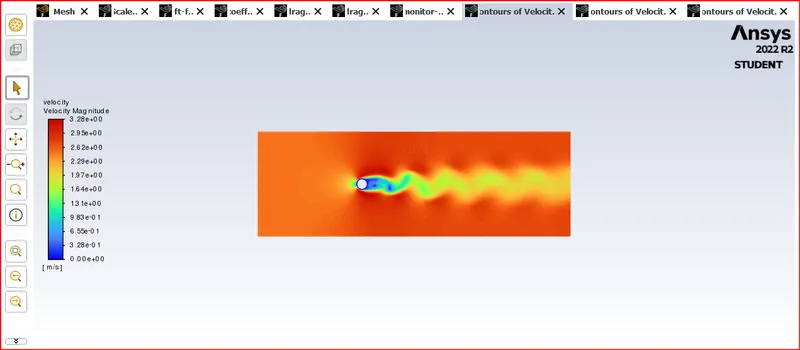
As seen in the above contour plot, vortex shedding is observed.
Reynolds number 1000.
velocity = 25 m/s.
density = 1 kg/m3.
viscosity = 0.05 Pa-s.
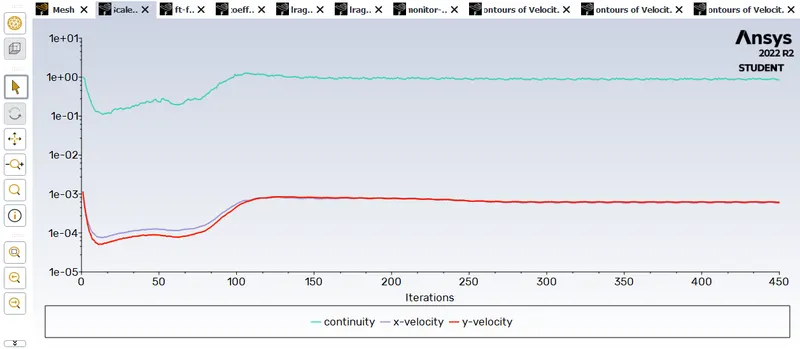
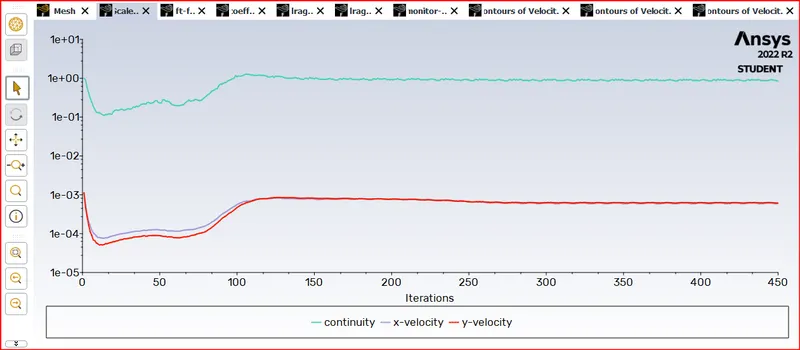
Scaled Residuals:
Plot of Lift Force:
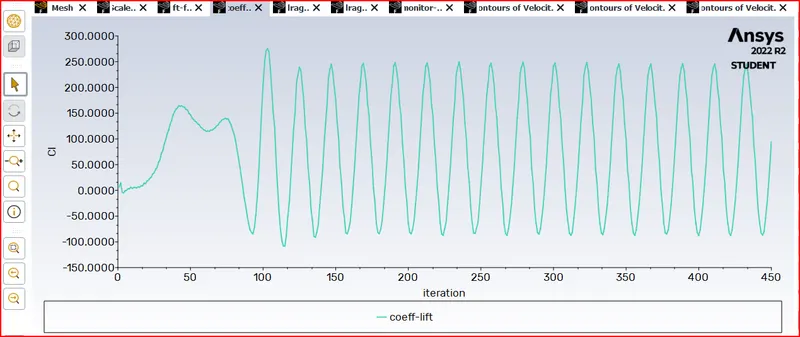
Coefficient of Lift:
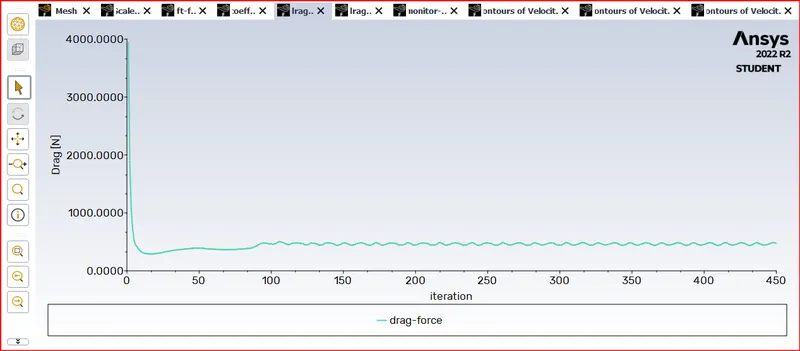
Drag Force
Drage coefficient:
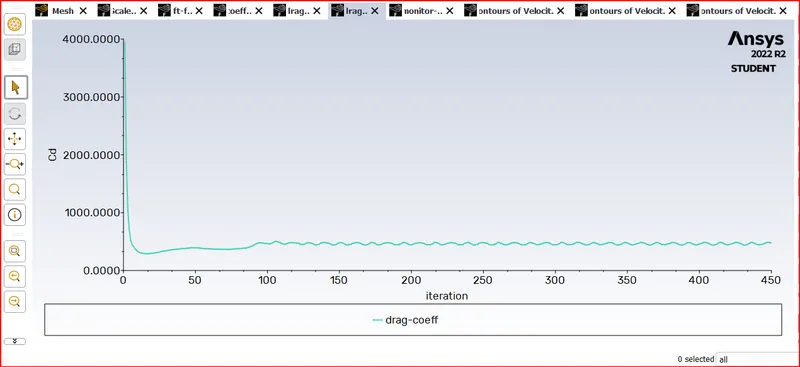
Monitor point velocity:
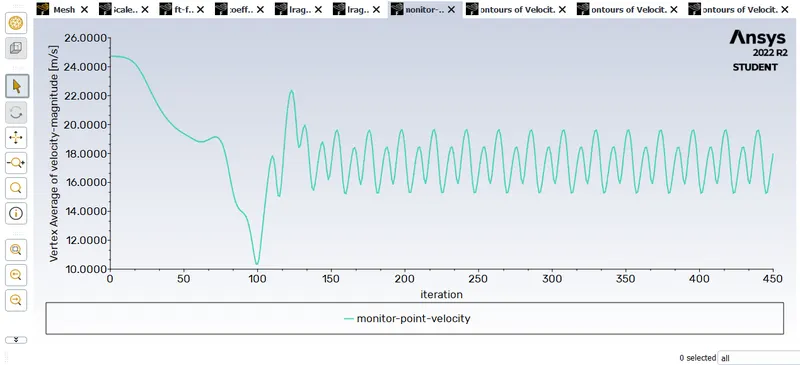
As seen in the above plot the flow has converged at around 200 iterations since the velocity variation seems periodic
Contour plot
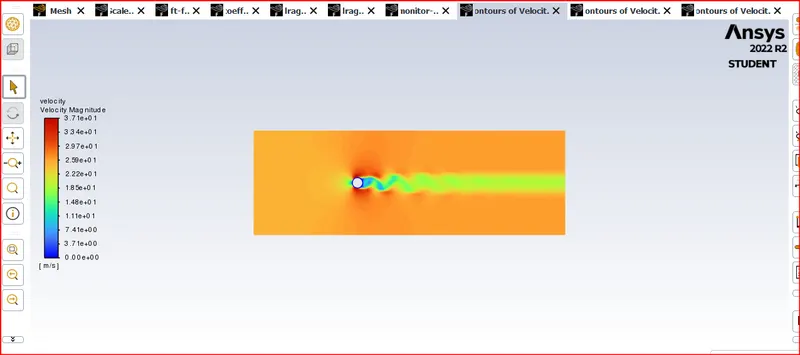
As seen in the above contour plot, vortex shedding is observed.
Reynolds number 10000.
velocity = 250 m/s.
density = 1 kg/m3.
viscosity = 0.05 Pa-s.
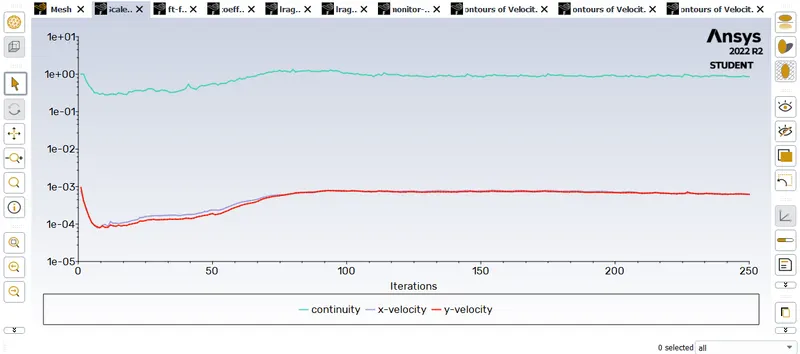
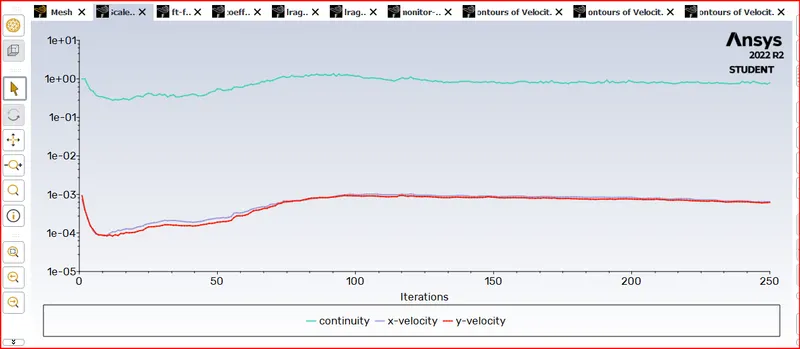
Scaled Residuals:
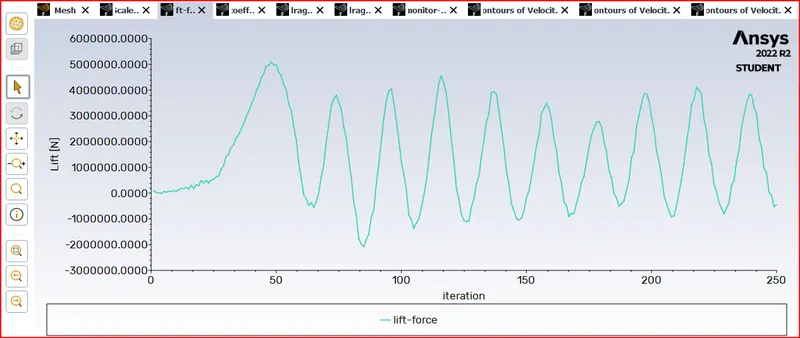
Plot of Lift Force:
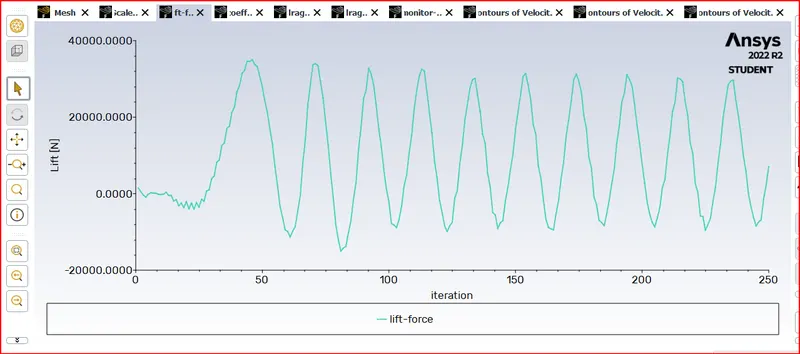
Coefficient of Lift:
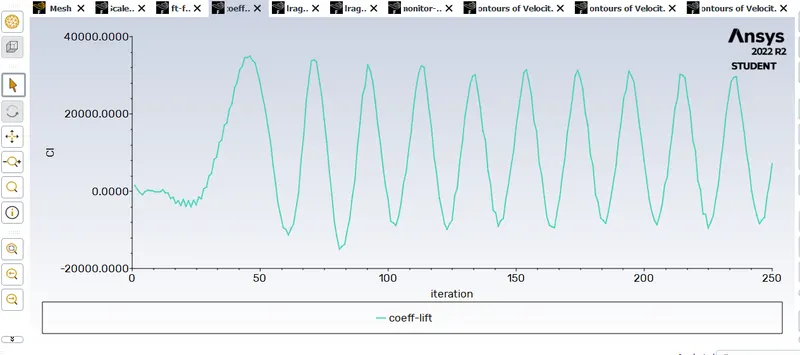
Drag Force
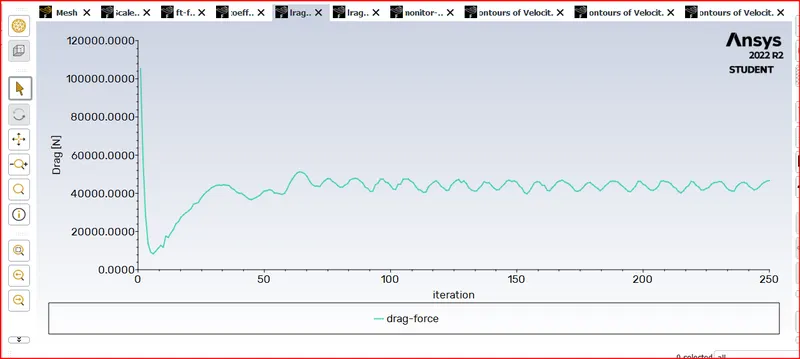
Drage coefficient:
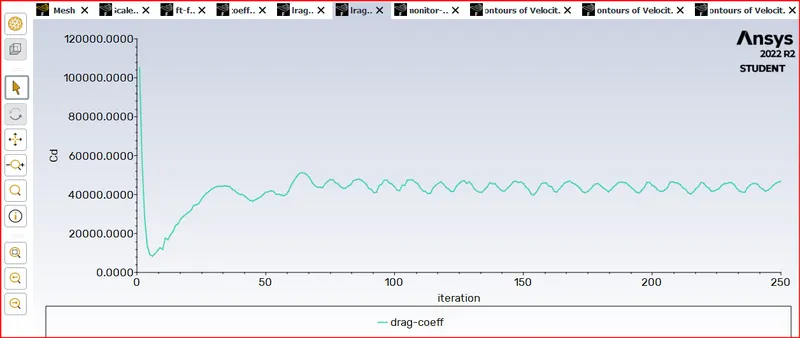
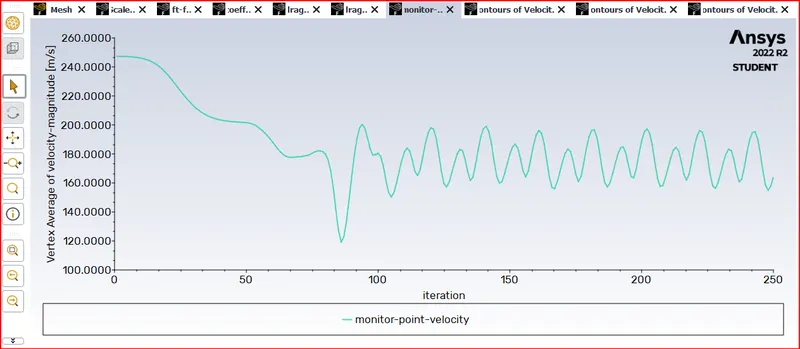
Monitor point velocity:
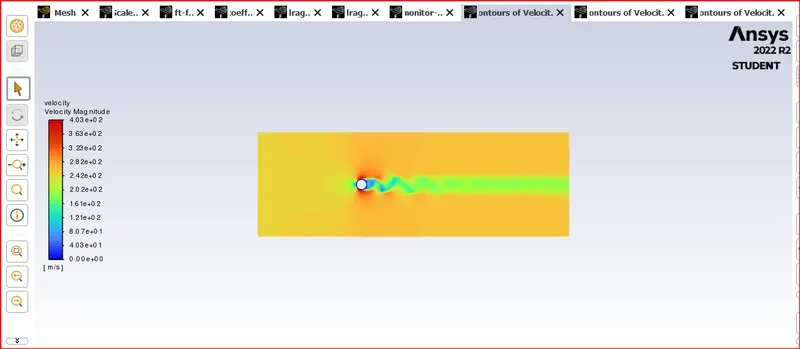
Contour plot
As seen in the above velocity plot the flow has converged at around 100 iterations since the velocity variation seems periodic
As seen in the above contour plot, vortex shedding is observed.
Reynolds number 100000.
velocity = 2500 m/s.
density = 1 kg/m3.
viscosity = 0.05 Pa-s.
Scaled Residuals:
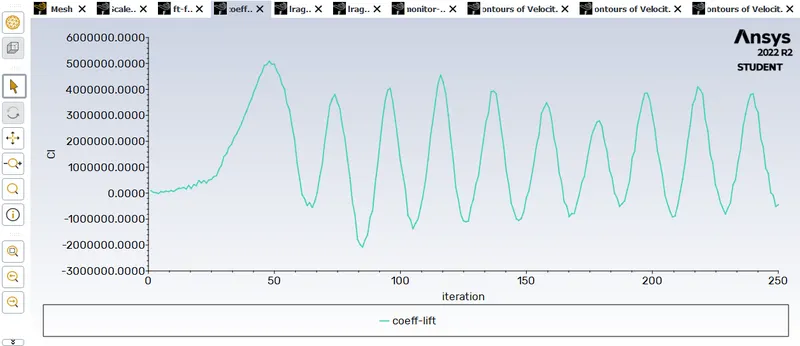
Plot of Lift Force:
Coefficient of Lift:
Drag Force
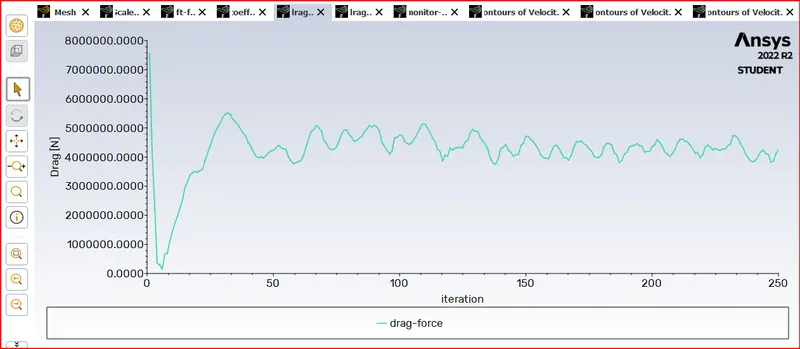
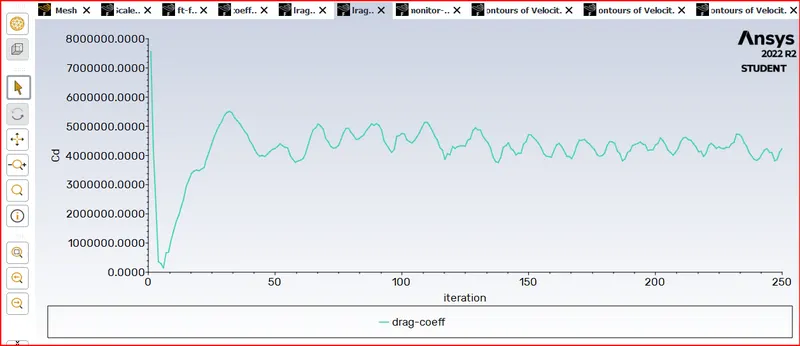
Drage coefficient:
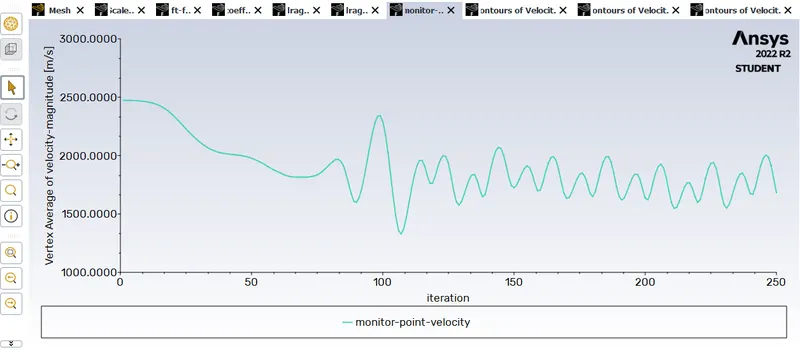
Monitor point velocity:
Contour plot
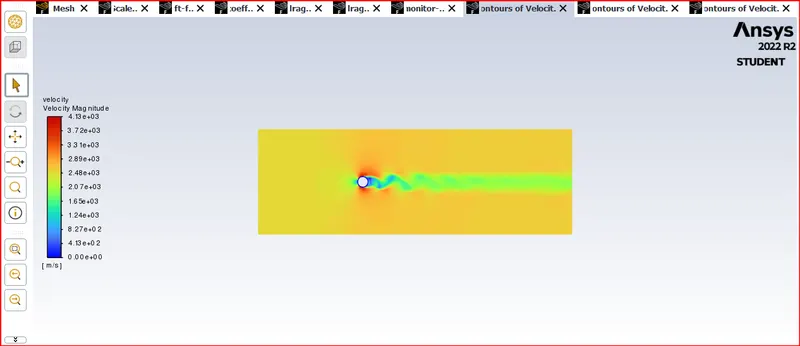
As seen in the above velocity plot the flow has converged at around 100 iterations since the velocity variation seems periodic
As seen in the above contour plot, vortex shedding is observed
Simulate the flow with the unsteady case and calculate the Strouhal Number for Re= 100.
Reynolds number 100.
velocity = 2.5 m/s.
density = 1 kg/m3.
viscosity = 0.05 Pa-s.
Scaled Residuals:
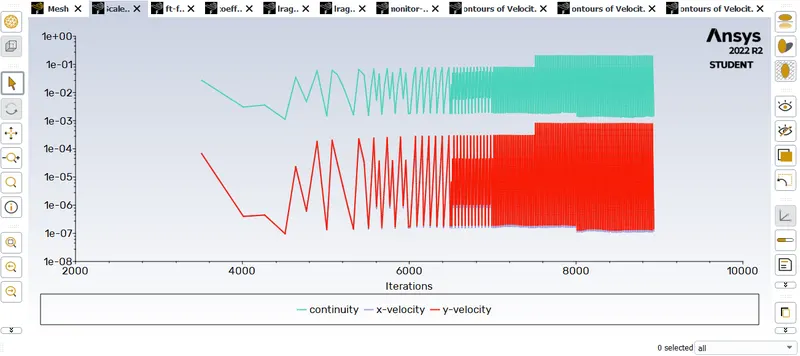
Plot of Lift Force:
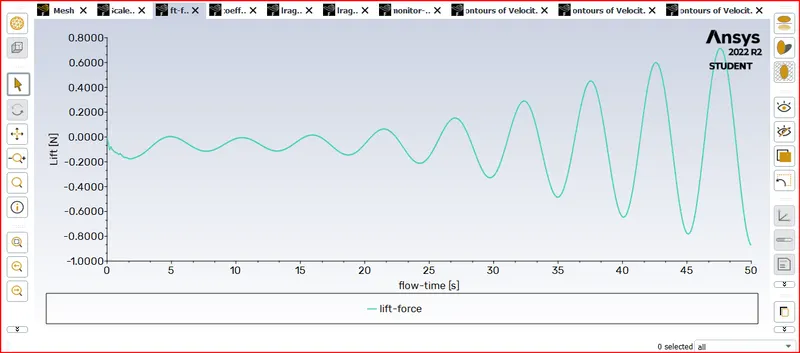
Coefficient of Lift:
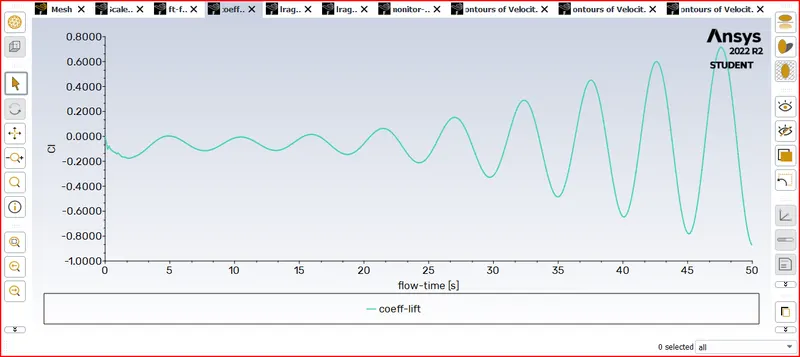
Drag Force
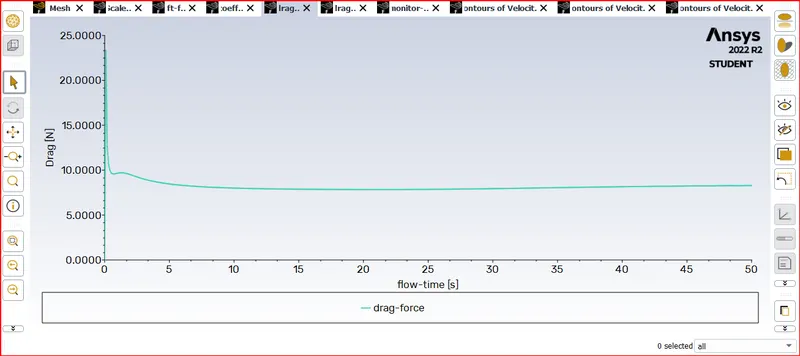
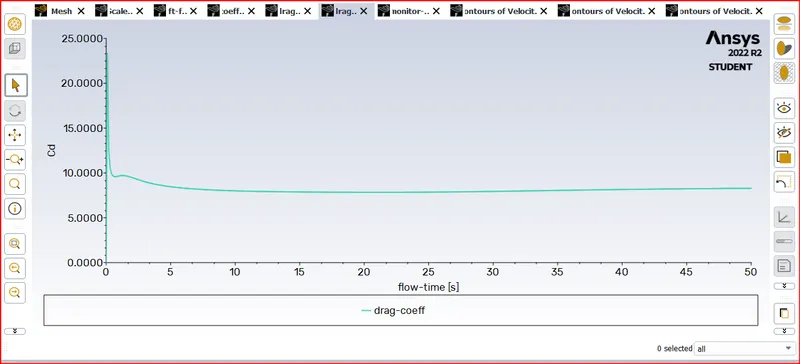
Drage coefficient:
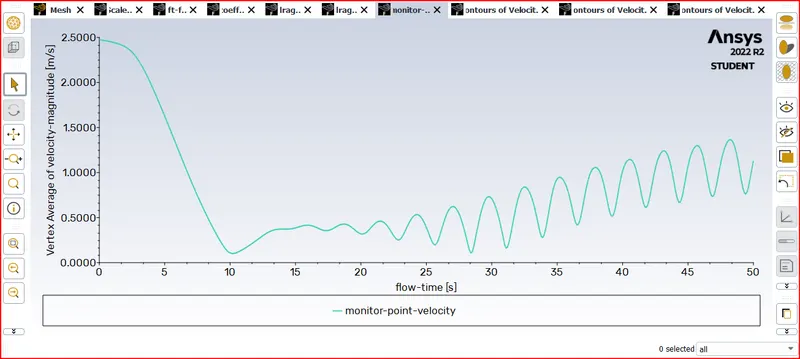
Monitor point velocity:
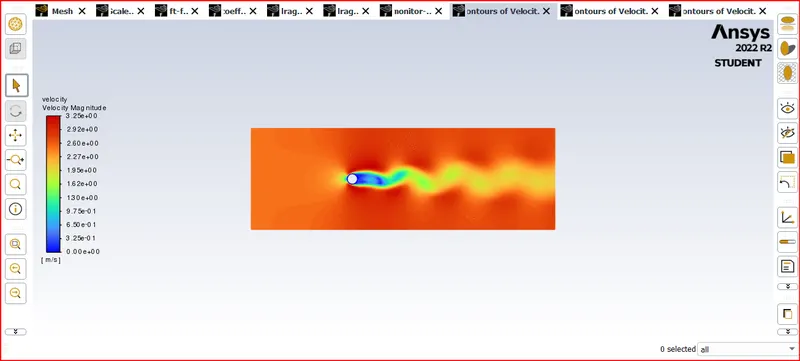
Contour plot
As seen in the velocity plot, the amplitude of velocity variation is constant the flow has said to be converged.
As seen in the above contour plot vortex shedding is observed.
Strouhal number:
Strouhal number is a dimensionless number describing oscillating flow mechanisms.
The Strouhal number is given as
St = f*d/u
Steps to calculate strouhal number:
Results>fft>following settings.
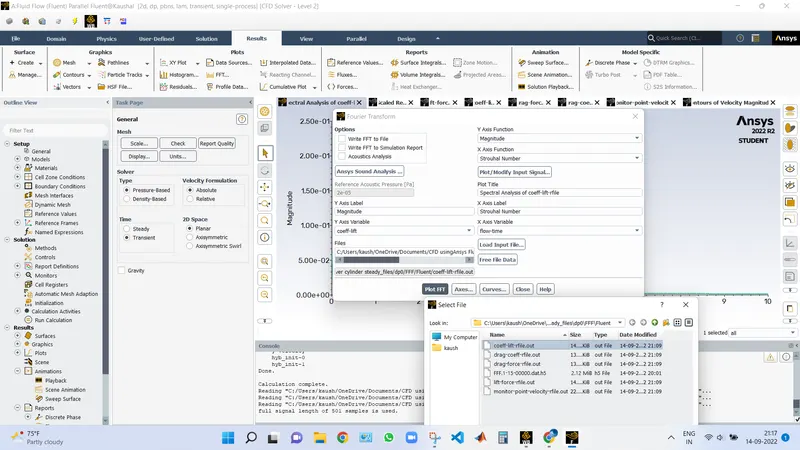
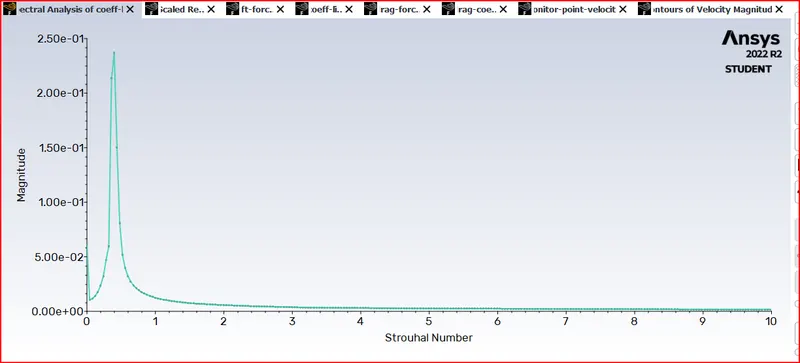
Strouhal number=0.23692
Discuss the effect of Reynolds number on the coefficient of drag.
Lift coefficient decreases rapidly and drag coefficient increases rapidly when Reynolds number is decreased below critical range. For both a laminar and a turbulent boundary layer increasing Reynolds Number gives lower skin friction drag.
Conclusion:
Simulation is carried out in steady state as well as transient state.
In steady state simulation is carried out at various reynolds number (10,100,1000, 10000 & 100000)
Here the reynolds no is varied by changing the velocity of flow and rest all parameters like the viscosity, density remains constant during all the simulations.
For reynolds number 10 no vortex shedding is observed and for rest all the conditions vortex shedding is observed.
Transient state simulation is carried out for reynolds number 100 and vortex shedding is observed.
Coefficient of drag and coefficient of lift is plotted for all the conditions.
strouhal number is also calculated