Week 2 Air standard Cycle
Objective : Program to plot PV diagram and to calculate thermal efficency of air standard cycle
Basic Formulae : `V/V_c`= `1/2`(`r_c`-1)[R+1-`cos theta`-(`R^2`-`sin^2 theta`)`^1/2`]
`eta`= 1- `1/r_c^(gamma-1)`
Code :
import math
import matplotlib.pyplot as plt

bore = 0.1
stroke = 0.1
con_rod = 0.15
cr = 12

def engine_kinematics(bore, stroke, con_rod, cr, start_crank, end_crank):


	a = stroke/2
	R = con_rod/a
	v_s = (math.pi/4)*pow(bore,2)*stroke
	v_c = v_s/(cr-1)

	sc = math.radians(start_crank)
	ec = math.radians(end_crank)

	n_v = 10

	dtheta = (ec-sc/n_v-1)
	v = []

	for i in range(0,n_v):
		theta = sc + i*dtheta
		term1 =	0.5*(cr-1)
		term2 = R + 1 - math.cos(theta)
		term3 = pow(R,2) - pow(math.sin(theta),2)
		term3 = pow(term3,0.5)
		v.append((1 + term1*(term2 - term3))*v_c)

	return v
v = engine_kinematics(bore, stroke, con_rod, cr, 0, 180)

p1 = 101325
t1 = 500
t3 = 2300

gamma = 1.4
# volume
v_s = (math.pi/4)*pow(bore,2)*stroke
v_c = v_s/(cr-1)
v1 = v_c + v_s

# at state point 1 = v1

# stae point 2 (after compression)
v2 = v_c

#p2v2^gamma = p1v1^gamma
p2 = p1*pow(v1,gamma)/pow(v2,gamma)

#p2v2/t2 = p1v1/t1 | rhs = p1v1/t1 | p2v2/t2 = rhs | t2 = p2v2/rhs
rhs = p1*v1/t1
t2 = p2*v2/rhs
v_compression = engine_kinematics(bore, stroke, con_rod, cr, 180, 0)

constant = p1*pow(v1,gamma)

#p_compression*v_compression^gamma = constant
p_compression = []
for v in v_compression:
	p_compression.append(constant/pow(v,gamma))
print(p_compression)
#state point 3
v3 = v2

#p3v3/t3 = p2v2/t2 | rhs = p2v2/t2 | p3v3/t3 = rhs | p3 = rhs*t3/v3
rhs = p2*v2/t2
p3 = rhs*t3/v3

#state point 4
v4 = v1

#p4v4^gamma = p3v3^gamma
p4 = p3*pow(v3,gamma)/pow(v4,gamma)

#p4v4/t4 = rhs
t4 = p4*v4/rhs

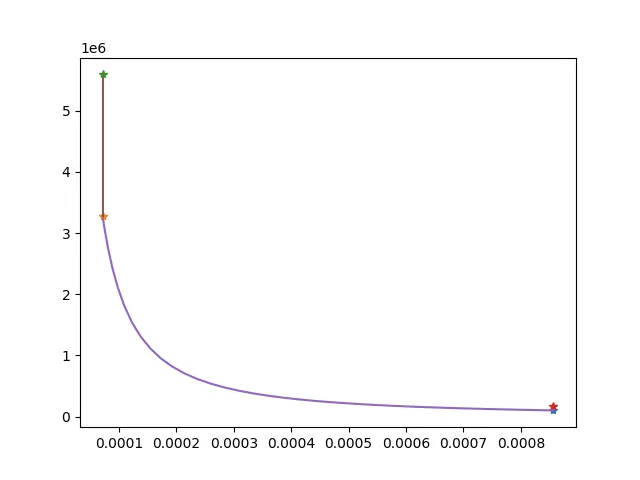
plt.plot([v1,v2,v3,v4,v1],[p1,p2,p3,p4,p1])
plt.plot(v_compression, p_compression)
plt.show()

eta = 1 - (1/(pow(cr, gamma-1)))
Output :

Report :
Line 1 : importing math module for calculations
Line 2 : Importing matplotlib module to create plot
Line 4 : defining 'bore ' value
Line 5 : defining 'stroke ' value
Line 6 : defining 'con_rod ' value
Line 7 : defining 'cr ' value (compression ratio)
Line 9 : defining functions as engine kinematics
Line 12 :Defining value of 'a' (Stands for crank pin radius )
Line 13 : R is a constant
Line 14 : Defining swept volume
Line 15 : Defining clearance volume
Line 17 : Defining starting crank angle
Line 18 : Defining ending crank angle
Line 20 : Values is defined to make difference between starting crank angle and ending crank angle
Line 22 : dtheta is an actual difference between two angles
Line 23 : v is an empty array that is used to store all the values that are generated
Line 25 : for loop to calculate no. of values at every angle
Line 26 : calculation for angle for every angle
Line 27 : breaking down formula in three different terms (term1)
Line 28 : breaking down formula in three different terms (term2)
Line 29 : breaking down formula in three different terms (term3)
Line 30 : term3a is defined to simplify term3
Line 31 : using append to increase value than the previous one
Line 33 : return v is used when output is calculated but not displayed in the output window
Line 34 : calling a function
Line 36 : defining p1 (pressure at state point 1)
Line 37 : defining t1 (temperature at state point 1)
Line 38 : defining t3 (temperature at state point 3)
Line 40 : defining gamma (specific heat ratio)
Line 41 : heading for determining volume
Line 42 : defining formula for swept volume
Line 43 : defining formula for clearance volume
Line 44 : defining formula for total volume for cylinder
Line 46 : stating that v1 will be before compression
Line 48 : heading for state point 2 i.e. after compression
Line 49 : volume at state point is equal to clearance volume since piston is at top dead center
Line 51 : heading for determining pressure at state point 2
Line 52 : determining pressure at state point 2
Line 54 : Determining temperature at state point 2 (ideal gas law)
Line 55 : second last step before getting final equation for
Line 56 : t2 defining t2 after deriving
Line 57 : calling a function and defining it as v_compression
Line 59 : defining a constant (from line 51)
Line 61 : giving heading equation
Line 62 : defining p_compression as empty array
Line 63 : defining a for loop for p_compression
Line 64 : using append to give increment to the p_compression value
Line 65 : 'print' statement to get p_compression values in the output window
Line 66 : heading state point 3
Line 67 : v3 is defined as volume before the suction
Line 69 : derivation to determine pressure at state point 3
Line 70 : second last step before getting final equation of p3
Line 71 : final equation of p3
Line 73 : Heading for state point 4
Line 74 : defining v4 as equal to v1
Line 76 : determining pressure at state point 4
Line 77 : final equation for pressure at state point 4
Line 79 : determining temperature at state point 4
Line 80 : final equation for temperature at state point 4
Line 82 : using matplotlib module to create plots for volume and pressure at all the state points
Line 83 : this command is used to plot v_compression and p_compression
Line 84 : this command is used to show plot that is created
Line 86 : defining eta (thermal efficiency) formula
Line 88 : command to print value of eta
Plot :