Week -2
AIM
1. To Make a Simulink model of Doorbell using Solenoid block with the following details
Create a situation where the switch is closed for 2 seconds and then released. Observe the physical movement of the plunger. And assume remaining parameters.
2. Use a thermistor to sense the temperature of a heater & turn on or turn off the fan as per below conditions
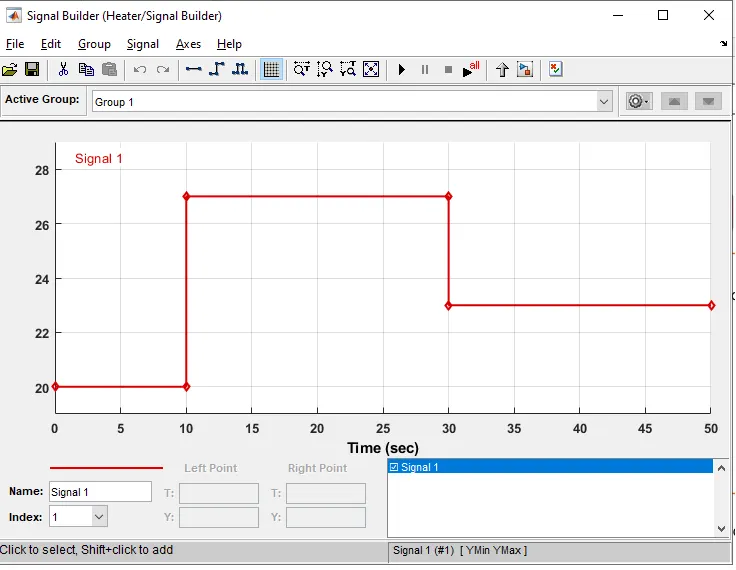
Temperature source: 20 °C from 0 to 10 seconds, 27 °C from 10 to 30 seconds, 23 °C from 30 to 50 seconds
Fan conditions: ON if the temperature above 25 °C, OFF otherwise
PROCEDURE
1. To Make a Simulink model of Doorbell using Solenoid block.
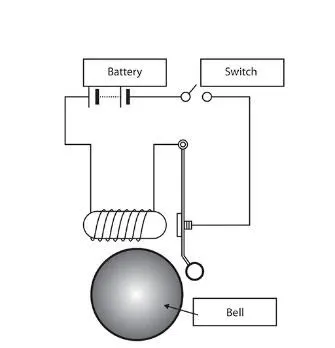
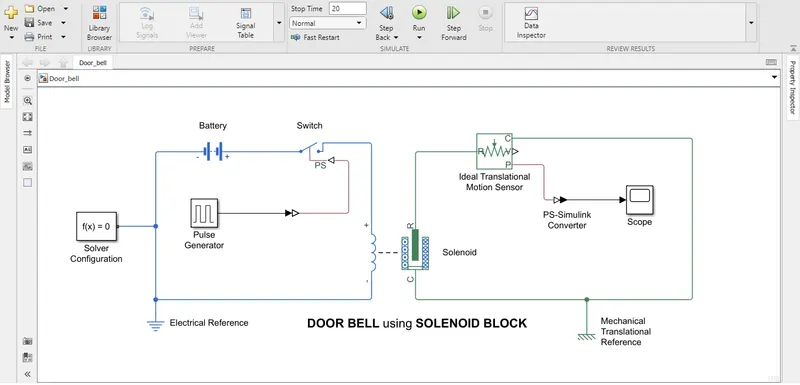
From the above diagram of a Door Bell, we have to set a Simulink model using Solenoid Block. To do so, In MATLAB > Click on Simulink. Now we have the Simulink environment open. Double click on the workspace to search the required blocks.
- We require a 12V battery for power supply.
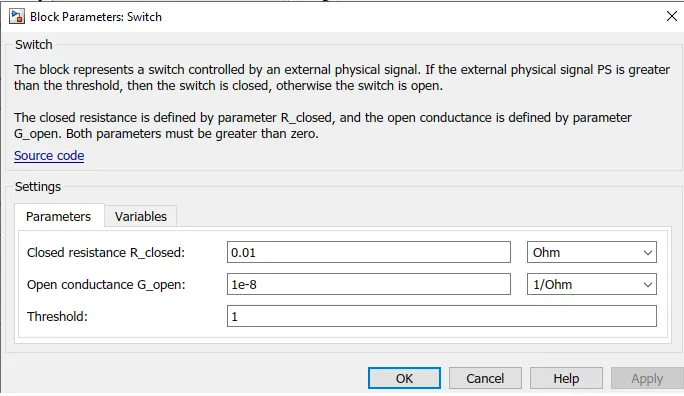
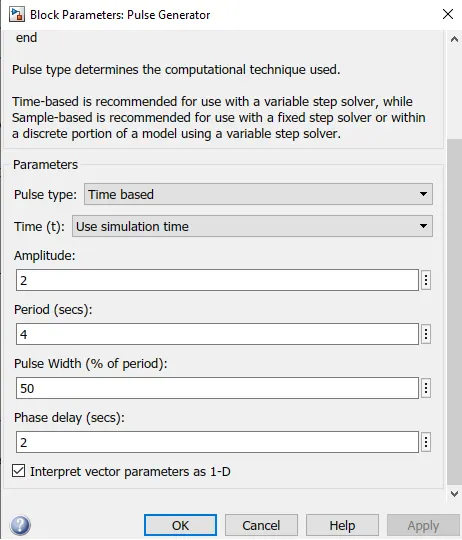
- A Switch to ON and OFF the Door Bell. As per condition, We have to set the Threshold parameter as 1. The switch has a input port PS(Physical Signal) where we connect a input block which is a Pulse generator via Simulink - PS Convertor. Double click on the pulse generator to set the input parameters for 'Amplitude' as 2, 'Period' as 4sec, 'Pulse' width as 50 %, 'Phase delay' as 2sec. The block represents a switch controlled by an external physical signal. If the external physical signal PS is greater than the threshold, then the switch is closed, otherwise the switch is open.
- We require a Electrical Reference block. The Electrical Reference block represents an electrical ground. Electrical conserving ports of all the blocks that are directly connected to ground must be connected to an Electrical Reference block.
- We require atleast one Solver Configuration for every model. The Solver Configuration block specifies the solver parameters that our model require.
- And most importantly a Solenoid Block(Plunger). The Solenoid has two connecting ports. One is electrical and the other is mechanical. (Electrical connections)The positive terminal is connected to the closing end port of the Switch i.e above PS port. Negative terminal is connected to the ground. (Mechanical connections)The port R is connected to the Ideal Translational Motion Sensor. And C is connected to the Mechanical Translational Reference Block.
- The Mechanical Translational Reference block represents a reference point, or frame, for all mechanical translational ports. All translational ports that are rigidly clamped to the frame (ground) must be connected to a Mechanical Translational Reference block.
- The Ideal Translational Motion Sensor measures velocity or displacement in a mechanical translational network. The sensor is ideal since it does not account for inertia, friction, delays, energy consumption, and so on. The physical signal ports V and P report the displacement and velocity, respectively, of port R relative to port C. The measurement is positive when the motion at R is greater than the motion at C.
- Finally the Scope is connected to the port P of Ideal Translational Motion Sensor via PS - Simulink Convertor in order to view the Output.
- Connect all the Blocks, set Input parameters with the given data. Now we set the Stop time as 20 and Run the Simulation.
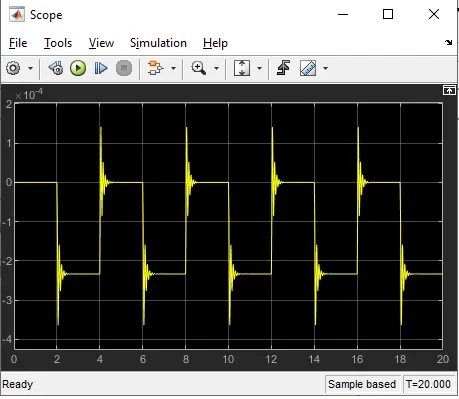
- By observing the physical movement of the plunger in the Pulse Graph, We can see that the Switch is closed for 2 seconds and then released.
DOOR BELL using SOLENOID BLOCK
PULSE GRAPH of the SOLENOID
2. Use a thermistor to sense the temperature of a heater & turn on or turn off the fan.
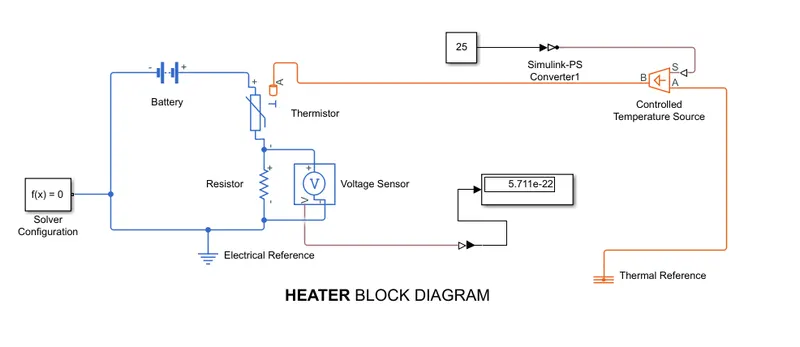
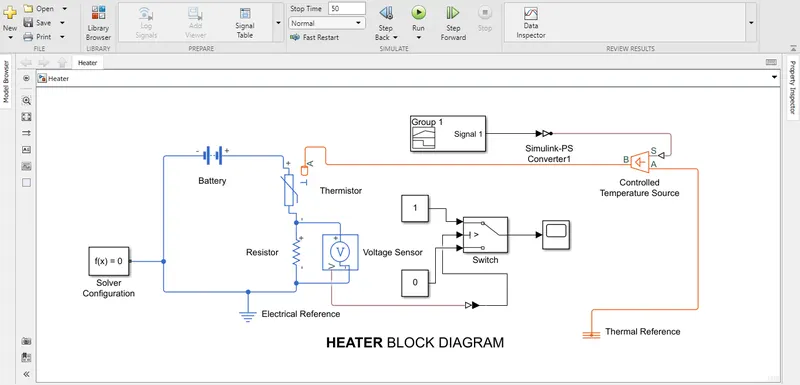
In order to sense the temperature of a heater using a thermistor and to set a condition to turn ON and OFF the Fan according to the given data, We require some electrical and thermal blocks.
- A 12V Battery for a continouos power supply.
- A Thermistor.
- A Resistor Block. The Resistor block models a linear resistor, described with the following equation V = IR. Where, V - Voltage, I - Current and R - Resistance. The parameter of the resistor is set to 1 by default in the block.
- Voltage Sensor a device that converts voltage measured between two points of an electrical circuit into a physical signal proportional to the voltage.
- A Electrical Reference block.
- A Solver Configuration block.
- A Controlled Temperature Source block. This block represents an ideal energy source in a thermal network that can maintain a controlled temperature difference regardless of the heat flow rate. The temperature difference is set by the physical signal port S. A positive temperature difference causes the temperature at port B to be greater than the temperature at port A.
- And a Thermal Reference.
- Connect all the Blocks, set Input parameters with the given data.
First we have to determine the Threshold Value by setting a temperature difference of 25 degree celsius using a constant block via Simulink - PS Convertor to the physical signal port S of Controlled Temperature Source block. Then we connect a display block to the physical signal V of the Voltage sensor inorder to display the Threshold value. Now run the Simulation with stop time as 50. We can see that the Threshold value is 5.711e-22
Now we replace the Constant Block with a Signal builder to set the given conditions. Temperature source: 20 °C from 0 to 10 seconds, 27 °C from 10 to 30 seconds, 23 °C from 30 to 50 seconds. And replace the Display block with a Simulink Switch Block. Set the threshold parameter of the switch with the value we got (by passing the temp of 25 deg cel.) 5.711e-22
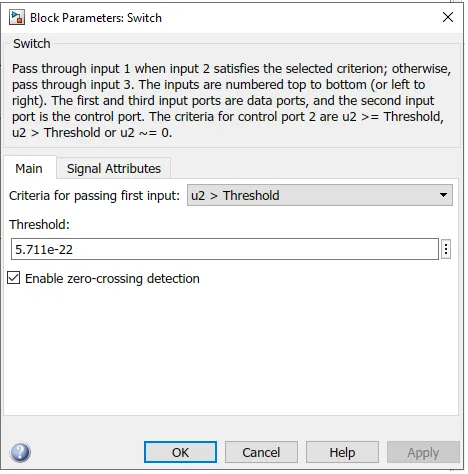
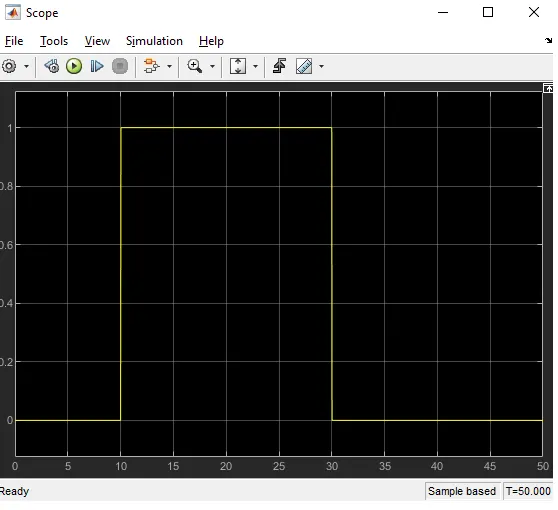
The Switch has three input ports. The first and third input ports are data ports, and the second input port is the control port. Add a Constant Block by passing the value 1 via first port to know if the condition is true. And another Constant Block by passing the value 0, if the condition is false. Then connect a Scope block to the Switch in order to visualize the Output. Now again run the Simulation. Check the output via Scope. We can sense that within the time interval of 50sec, The heater Temperature is OFF from 0 to 10sec then ON from 10 to 30sec and OFF from 30 to 50sec.
HEATER BLOCK DIAGRAM
PLOT GRAPH of HEATER TEMPERATURE CONDITION - ON & OFF