Week -2
AIM:
To make a Simulink Model of Door Bell using Solenoid Block.
SOLENOID:
A Solenoid is a type of electromagnet, the purpose of which is to generate a controlled magnetic field through a coil wound into a tightly packed helix. The coil can be arranged to produce a uniform magnetic field in a volume of space when a current is pass through it. The term solenoid was coined in1823 by Andre-Marie Ampere to designate a helical coil. In Engineering the term may also refer to variety of transducer device that convert energy into linear motion. The term is also often use to refer to a solenoid valve, an integrated device containing an electromechanical solenoid which actuate either a pneumatic value or hydraulic valve, or a solenoid switch, which is specific type of Relay that internally uses an electromagnetic solenoid to operate an electric switch for example an automobile starter solenoid or linear solenoid, solenoid bolts, a type of electromechanical locking mechanism, also exist. In electromagnetic technology, a solenoid is an actuator assembly with a sliding ferromagnetic plunger inside the coil. Without power, the plunger extends for part of its length outside the coil; applying power pulls the plunger into the coil. Electromagnet with the fix core is not considered solenoids.
Basic Component used to generate a simple Doorbell circuit is:
GIVEN CONDITION: IN the arrangement ,when the switch is closed the electromagnet receives electrical power from the Battery and pulls the metal arm to hit the bell producing sound by creating a situation where the switch is closed for 2 secs and then released.
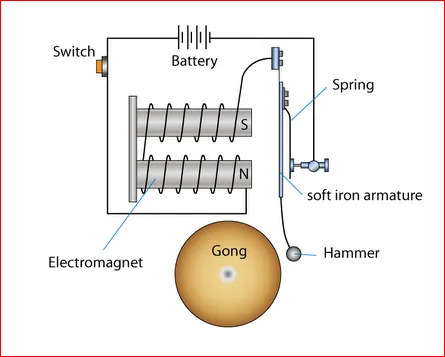
We have used the following Blocks in the model-
- Pulse Generator:
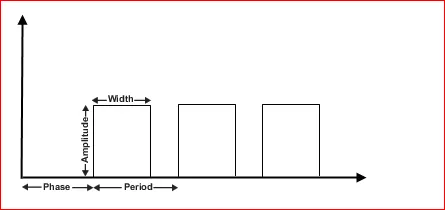
The Pulse Generator block generates square wave pulses at regular intervals. The block waveform parameters, Amplitude, Pulse Width, Period, and Phase delay, determine the shape of the output waveform. The following diagram shows how each parameter affects the waveform.
- Battery:
In Battery positive terminal is connected with switch and negative terminal is connected to “Electric Reference”.
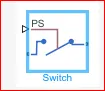
- Switch:
The switch Block model a switch is controlled by an external physical signal.
- Solenoid Block:
Solenoid Block is connected with Switch and Battery and electrical circuit will be formed.
The Solenoid Block represents the Electrical characteristics and generated force for the solenoid in the following figure:
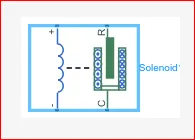
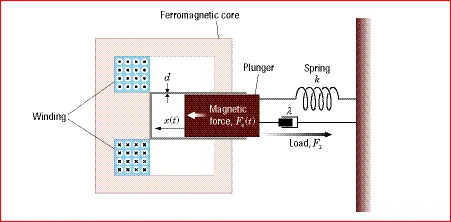
The return spring is optional. To remove the effects of this spring from the model, set the spring constant parameter as from 0 to 10.
To show the direction in which the solenoid acts the block icon changes dynamically based on value of the Motion direction under excitation parameter.
The Port ‘C’ is connected with Mechanical Translation reference.
- Ideal Translation Motion Sensor Block:
Ideal Translation Motion Sensor Block is connected with Solenoid Block ‘R’ to observe the Physical movement of the Plunger.
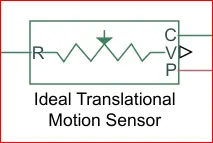
Connections R and C are mechanical translational conserving ports that connect the block to the nodes whose motion is being monitored. Connections V and P are physical signal output ports for velocity and position, respectively.
The block positive direction is from port R to port C. This means that the velocity is measured as v = vR – vC, where vR, vC are the absolute velocities at ports R and C, respectively.
Port C is connected with Mechanical translational reference.
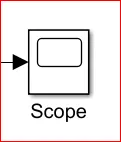
- Scope:
Scope is connected with Ideal Translation Motion Sensor to get the output. The real-time Scope block acquires data in chunks of size Number of samples from the real-time application that is executing on the target computer.
- PS-Simulink Converter:
The PS-Simulink Converter block converts a physical signal into a Simulink output signal. Use this block to connect outputs of a Physical Network diagram to Simulink scopes or other Simulink blocks.
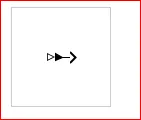
- Simulink-Ps Converter:
This Block convert simulink signals into physical signal for operational use in Model.

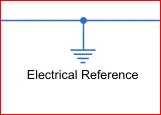
- Electrical Reference Block:
The Electrical Reference block represents an electrical ground. Electrical conserving ports of all the blocks that are directly connected to ground must be connected to an Electrical Reference block. A model with electrical elements must contain at least one Electrical Reference block.
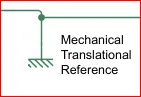
- Mechanical Translation Reference Block:
The Mechanical Rotational Reference block represents a reference point, or frame, for all mechanical rotational ports. All rotational ports that are rigidly clamped to the frame (ground) must be connected to a Mechanical Rotational Reference block.
- Solver Configuration:
Each physical network represented by a connected Simscape block diagram requires solver settings information for simulation. The Solver Configuration block specifies the solver parameters that your model needs before you can begin simulation.
OBJECTIVES:
For DoorBell- Create a situation where the switch is closed for 2 sec and then released. Observe the physical movement of the plunger.
SIMULINK MODEL:
EXPLANATION:
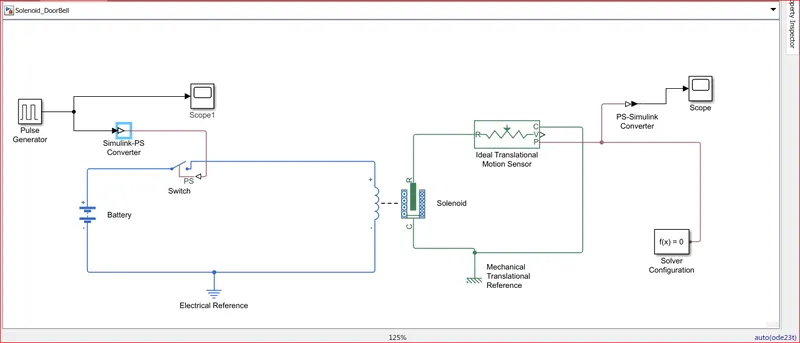
- From the above governing circuit of a DoorBell, we know that we need a switch, solenoid, battery and a plunger.
- So, in order to get these entire component in simulink model we have to select the block that perform same action what the above device perform.
- Now first a “Solenoid block” is taken to represent a solenoid in the model, then to represent battery we have taken “Battery Block” from the library Browser.
- Then this “Solenoid Block” & “Battery Block” are connected to each other via positive and negative terminals.
- A “Switch Block” is placed between “Solenoid Blocks” and “Battery Block “and is connected with both Blocks.
- Now for switch to operate we need to provide Physical signal through “PS” port in the “Switch Block”. The provided physical signal should be greater than the threshold of the switch, for switch being close, or else it will be open.
- Now this whole Battery Switch and Solenoid path is connected to an “Electric Reference Block” which represents earthing of the circuit. This “Electric Reference Block” should be connected to the negative terminal of “Battery Block”.
- Then in the solenoid block “R” and”C” are two variable which represent Plunger and Fixed Point respectively.
- Now the solenoid “R” is connected to “R” of “Ideal Translation Motion Sensor Block” which senses the position of plunger in the Solenoid Block and gives the Output.
- Now in the “Ideal Translation Motion Sensor Block” the output are given as “V” & ”P” which represent the velocity and position of the plunger. Since we are only interested in knowing the change in position of the plunger, so we need only results of “P” output.
- Now “C” in the “Ideal Translation Motion Sensor Block” is a mechanical translation conserving port, which means that the mechanical process starts from “R” and end at “C” and again it start at “R” and the cycle goes on.
- So “C” in the “Ideal translation Motion sensor block” is connected to “Mechanical Translation Reference” which represents a fix point where it is rigidly clamped in real time.
- Similarly “C” of the solenoid block is also connected to the same “Mechanical Translation Reference” as fixed point for solenoid.
- Since we position of the plunger as output from “Ideal Translation Sensor Block” we have connected port”p” to a ‘PS-Simulink Converter’ where the Physical value from port ’P’ are converted into Simulink value, and then this ‘PS-Simulink Converter’ is connected to ‘Scope Block’ which will generate a graph for change in position of Plunger from port ‘P’ of ‘Ideal Translation Motion Sensor Block’.
- Now to provide a physical signal for operating the switch, we have used a “Pulse Generator Block”, which generates a continuous Square Pulse.
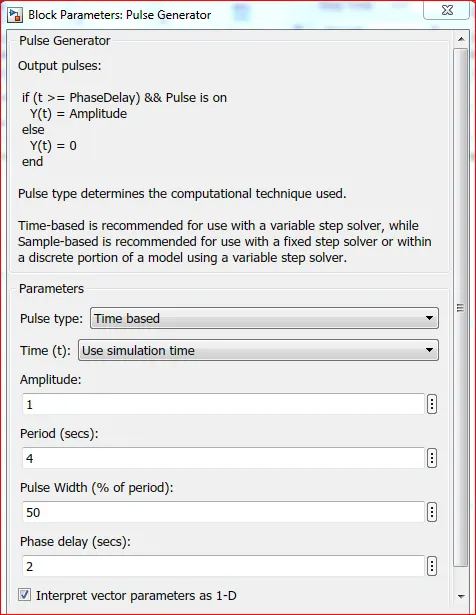
- From the above figure we can observe we have given period value as “ 4 ” pulse width as ‘50’, phase delay as ’2’ and Amplitude by default is ‘1’ we have not changed it. This means that initially the Pulse will be Zero, Since we have given Phase Delay of “2” so till 2 sec the Pulse will be Zero and at the end of 2 sec the Pulse will start rising from Zero to 1, Since we have given Amplitude as “1” and then now the Pulse width will be Half of Period, So for the next 2 seconds the Pulse will be at Amplitude “1” only, then it will again come down to zero at 4th Second and then it will be Zero. So, after these 4 seconds period again the pulse will be generated and thus cycle continues.
- From starting to ending of the Pulse it will take 4 sec of time period in which only for 2 secs the Amplitude will be “1” and for rest of time it will be Zero. So, after these 4 secs period again the Pulse will be generated and thus Cycle continues.
- To this “Pulse Generator” a “Scope Block” is connected to see how the Pulse is generated.
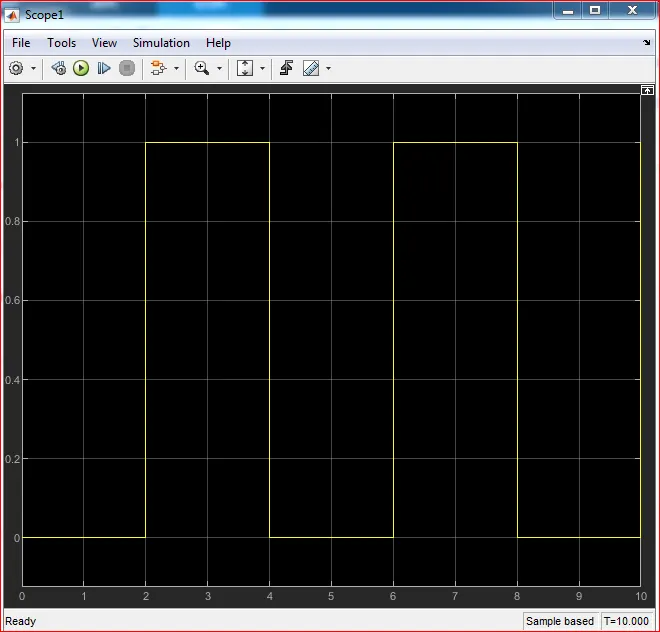
- The above figure is obtained by running the Simulink Model and double clicking the “Scope1 Block”. This figure shows how the Pulse is generated and in this figure the X-axis represents the “Time” and Y-axis represents the “Amplitude”. As mentioned in the point no.18, the Pulse has started from 2 sec and ending at 6 sec which is nothing but a time period of 2 secs.
- Thus, this represents that when amplitude is 1, the switch will be close and current will start flowing and when it is zero the switch will open and current stop flowing. Since our objective is only to see the change in position of Plunger when Switch is Close for 2 sec , so we have the Amplitude as 1 for 2 sec in the Pulse generator by making the Pulse width half of the period in the inputs fir “Pulse Generator Block”.
- Since the Pulse that is coming from “Pulse Generator Block” is a Simulink value, so to convert this value into Physical value we have used “Simulink-PS Converter Block”, since Switch only takes Physical value as Inputs.
- As mention above, the port “P” of “Ideal Translation Motion Sensor Block” is connected to another “Scope2 Block” and a “Solver Configuration Block” is also connected to this path which generates Equations and solves the whole Model internally to give the results of the Whole Simulink Model output.
- Now Run the Model and Double click on the “Scope2 Block” which is connected to “Ideal Translation Motion Sensor Block” to get the results.
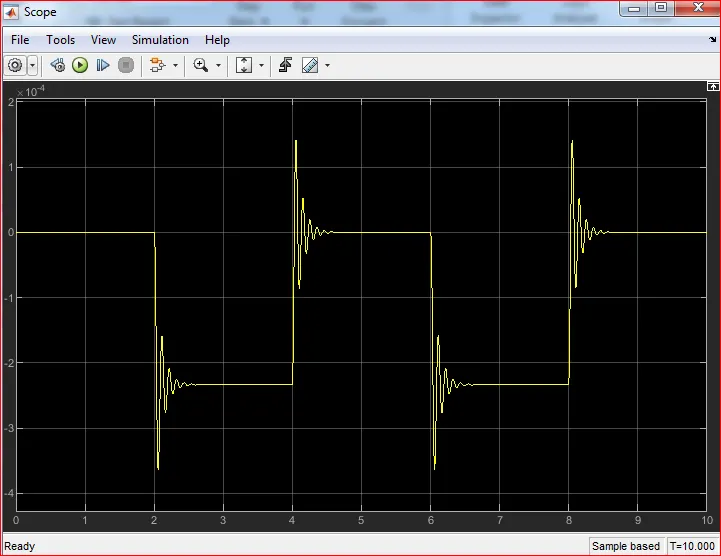
- We will get the above Graph as the result when we double click on “Scope2 Block”. Here X-axis Represent the “Time” and the Y-axis represent position of Plunger in mm.
- From the above figure we can observe that the initial position of the Plunger is at “5mm” as from Pulse generator Block, a Pulse generated at 2, so in the position of the Plunger is also changing at time 2 seconds and time till which the Pulse Amplitude is “1” till that time plunger is also at the same position after the change from initial position.
- Again, as the Amplitude of the Pulse become zero, the Plunger returns to the Original position back again and as the pulse cycle goes on, Plunger is also at same position after the change from initial position.
- We can also observe that when there is change in position of the Plunger, there is some Wave form at the start of change in position. This is due to recoil of spring, each time when the Plunger is moving. So to reduce this, in the “Solenoid Block” we can reduce the spring constant value and increase the Damping Coefficient. This will reduce the Waves that are being formed and we will get a smooth graph.
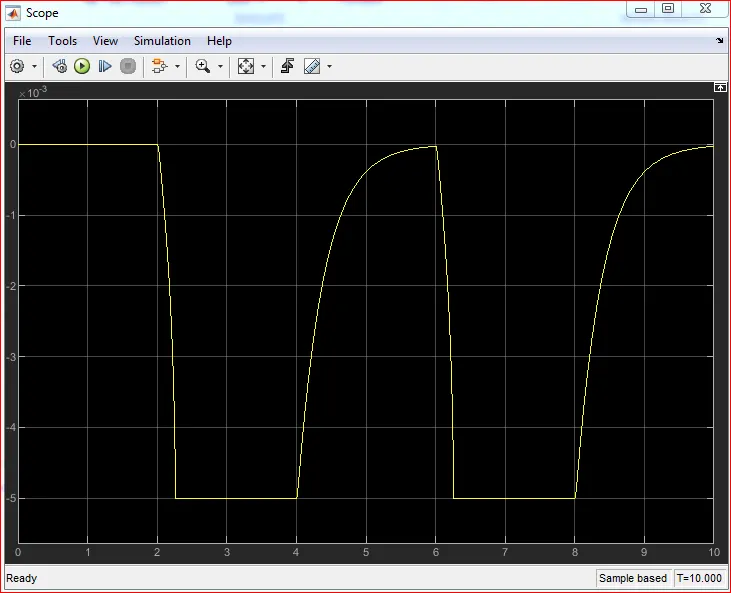
- The above figure is a smoother graph than previous one. This was done by changing the value of spring constant and Damping Coefficient in the “Solenoid Block”.
CONCLUSION:
1.The Physical movement of the Plunger of solenoid was observed when switch is close for 2 seconds .
2.
AIM:
To use a thermistor in Simulink to sense the temperature of a heater & turn on or turn off the fan as per below conditions:
Temperature source: 20 °C from 0 to 10 seconds, 27 °C from 10 to 30 seconds, 23 °C from 30 to 50 seconds
Fan conditions: ON if the temperature above 25 °C, OFF otherwise.
THEORY:
THERMISTOR:
A thermistor is a thermally sensitive resistor that exhibits a precise and predictable change in resistance proportional to small changes in body temperature. There are two types of thermistors.
NTC or Negative Temperature Coefficient thermistors, and PTC or Positive Temperature Coefficient thermistors. The difference is that NTC thermistors exhibit a DECREASE in resistance as body temperature increases, while PTC thermistors exhibit an INCREASE in resistance as body temperature increases. We use an NTC thermistor here.
Overall model:
Breaking down the model into different subsystems
SUBSYSTEM 1:Generates Simulink signals.
In order to test the working of the model for a wide range of temperatures, we have designed our input in the form of steps of temperatures greater than, equal to and less than 298.15K.
We have used Simulink blocks here to generate step signals of our desired nature which is fed into a 'controlled temperature source' simscape block. Here the Simulink signals are connected to the temperature signals that are fed as input into the thermistor.
THE GRAPH OF INPUT TEMPERATURE SIGNAL TO THE THERMISTOR :
SUBSYSTEM 2: The temperature signals here are converted to current signals that are fed to subsystem 3.
Here we connect the thermistor to a battery source and a current sensor. As the thermistor has an inherent resistance at its standard temperature, we effectively use it as a resistor in this circuit, whose value changes with the temperature input to the thermistor.
As the resistance of the thermistor changes in accordance with the varying temperature, for a given input voltage from the battery, the current in the circuit changes. This current is then fed to the subsystem 3 that is meant to activate a switch.
At its reference temperature 298.15K, the thermistor holds a resistance of 1000 ohms.
At this reference state, the current in the subsystem 2 is noted to be 0.01198A.
When the temperature signal fed into the thermistor is greater than 298.15K (i.e 25-degree Celsius), its resistance decreases and hence the current in the subsystem 2 increases i.e its value rises more than 0.01198A.
When the temperature signal fed into the thermistor is less than 298.15K (i.e 25-degree Celsius), its resistance increases and hence the current in the circuit decreases i.e its value plunges lower than 0.01198A.
The above graph shows the current change with respect to the input temperature signals.
Note that as the temperature is increased beyond 298.15K the current value also surpassed the reference current 0.01198A. Needless to say, its value plunges below 0.01198A when the temperature falls below 298.15K.
We exploit this behavior using a switch in the subsystem 3 whose threshold is set as 0.01198. By feeding a higher value of current through the switch we ensure that the circuit in subsystem 3 gets closed, which enables the fan to rotate. This is in line with our aim that the fan must rotate when the temperature exceeds 25-degree celsius.
And when the current through the switch falls below 0.01198A, which happens when the resistance value increases due to low temperature, the circuit in subsystem 3 remains open and hence the fan does not spin.
SUBSYSTEM 3:
We use a universal motor along with an ideal rotational motion sensor to visualize the rotation of the fan.
The rotation of the fan in this subsystem is witnessed only when the switch here is closed by the current signal from the subsystem 2. And this switch is designed to close only when the temperature is greater than 298.15K i.e is corresponding to the current greater than 0.01198A as explained in previous subsystems.
The rotation of the fan is shown using two parameters.
ANGULAR DISPLACEMENT and ANGULAR VELOCITY
ANGULAR DISPLACEMENT GRAPH:
We can infer from this graph that the fan shows zero angular displacements up to the first 10 seconds when the temperature is 293.156K (20-degree Celcius)
When the temperature is 300.15K (27-degree Celcius)between 10 to 30 seconds we can see the fan moving.
And when the temperature is 296.15K(23-degree Celcius) between 30 to 50 seconds we can see that the fan has stopped spinning and the angular displacement is constant after 30 seconds.
The same is also inferred from the angular displacement graph.
RESULT:
From both the ANGULAR DISPLACEMENT and ANGULAR VELOCITY graphs we could infer that our fan is in motion only when the temperature signal sensed by the thermistor is greater than 25-degree Celcius, which is in line with the aim of the project.