Week -2
1) Make a Simulink model of Doorbell using solenoid block:
AIM: To make a "Simulink model of Doorbell using solenoid block" and to observe the physical movement of the plunger where the switch is closed for 2 seconds and then released.
OBJECTIVE: To make a Simulink model of Doorbell using solenoid block with the following details:
- In the above arrangement, when the switch is closed the electromagnet receives electrical power from the battery and pulls the metal arm to hit the bell producing sound.
- To Create a situation where the switch is closed for 2 seconds and then released. Observe the physical movement of the plunger and also assume remaining parameters.
SIMULINK MODEL OF DOORBELL USING SOLENOID BLOCK:
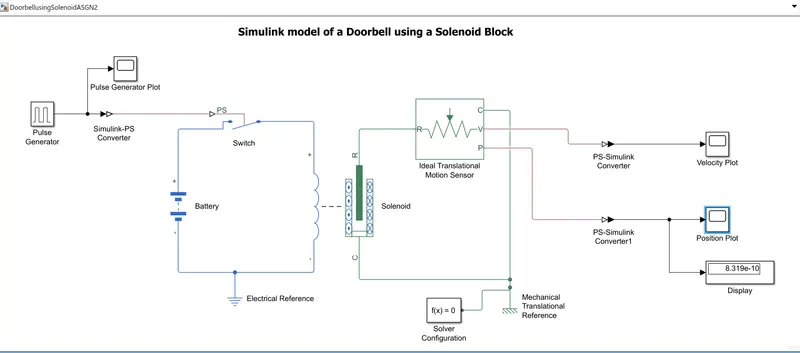
From the above figure it is seen that a battery is connected to a solenoid through the switch. The pulse generator is connected to the switch for giving the appropriate pulses and is used to create the square wave pulses of regular intervals.
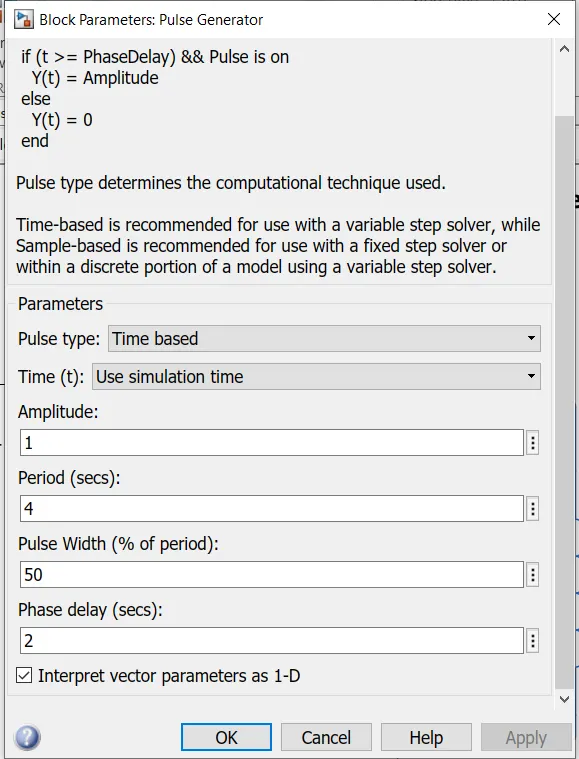
- The signals are generated for every 2 sec to control the switch for ringing the bell using the pulse generator.
- Then according to the signal, the switch will act to control the current flow to the solenoid and then it generates the magnetic field to attract the armature.
- The motion is sensed using the ideal translational motion sensor from the solenoid and then the signals are converted to simulink phase.
- The scope is connected to the velocity and position terminal of the ideal translational motion sensor to get the outputs.
- The PS-Simulink converter is used to convert the physical signal to simulink signal and Simulink-PS converter is used to convert the simulink signal to physical signal.
- The solver configuration block is used for specifying the solver parameters that the model needs before the beginning of simulation.
SIMULATION RESULTS OF INPUT AND OUTPUT PLOTS :
INPUT PULSE GENERATOR PLOT:
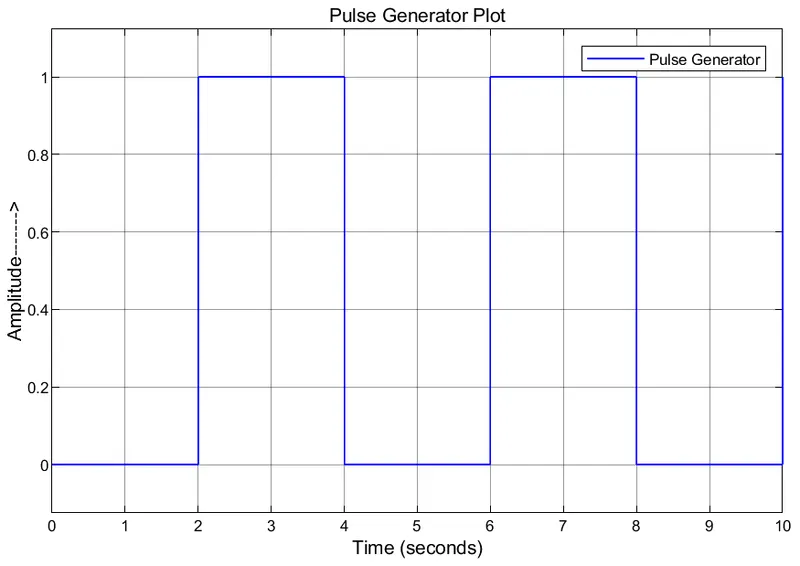
- The time pulse is generated for every 2 seconds to control the switch in a time span of 10 sec.
- When the switch is closed, the solenoid block receives the electrical power and the plunger moves from position R to C to hit the bell which produces the sound.
OUTPUT VELOCITY PLOT:
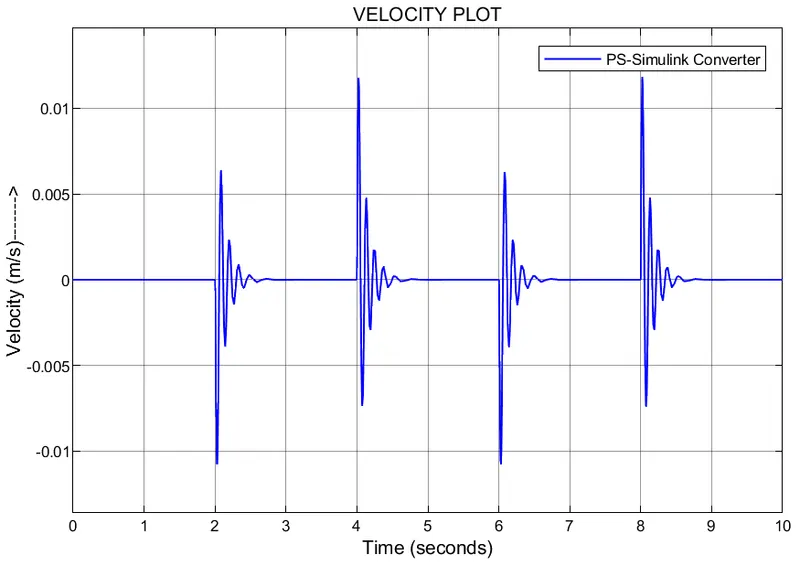
- From the velocity plot it is understood that the bell is rung for every 2 sec in a time span of 10 sec, when the physical output signal from ideal translational motion sensor is converted into simulink signal using PS-simulink converter .
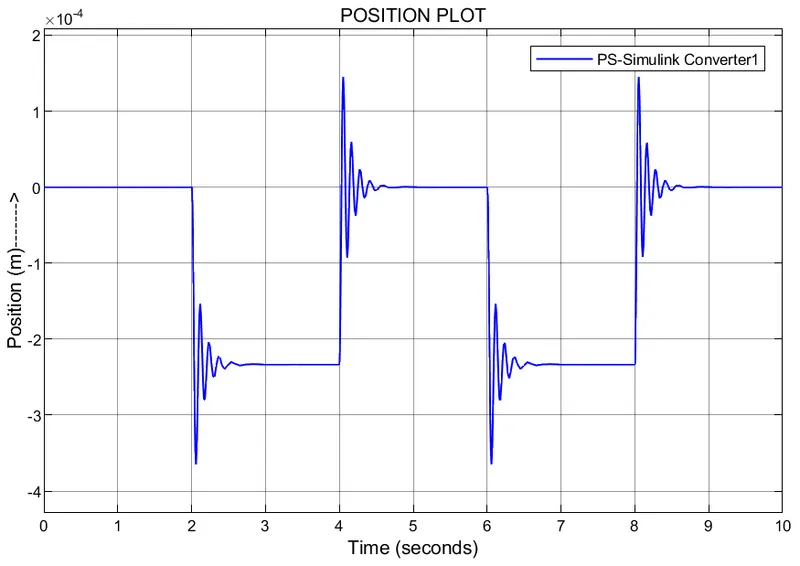
OUTPUT POSITION PLOT:
- From the position plot it is understood that the bell is rung for every 2 sec in a time span of 10 sec, when the physical output signal from ideal translational motion sensor is converted into simulink signal using PS-simulink converter .
- The negative waveform is obtained if the solenoid parameter is set to the position from R to C.
CONCLUSION:
- The Simulation model of a Doorbell using soleniod block is obtained by using the specific blocks as shown in the simulation diagram and the condition to observe the physical movements of the plunger when the switch is closed for 2 seconds and then released is obtained.
2) Simulink model of a Thermistor to sense the temperature of a heater and to turn ON/OFF the Fan as per the given temperatures:
AIM: To make the simulink model of a Thermistor to sense the temperature of a heater and to turn ON/OFF the fan as per the given temperatures.
OBJECTIVE: To build a simulink model using a thermistor to sense the temperature of a heater & turn on or turn off the fan as per the below conditions:
- Temperature source: 20 °C from 0 to 10 seconds, 27 °C from 10 to 30 seconds, 23 °C from 30 to 50 seconds
- Fan conditions: ON if the temperature above 25 °C, OFF otherwise
SIMULINK MODEL OF A THERMISTOR TO SENSE THE TEMPERATURE OF A HEATER:
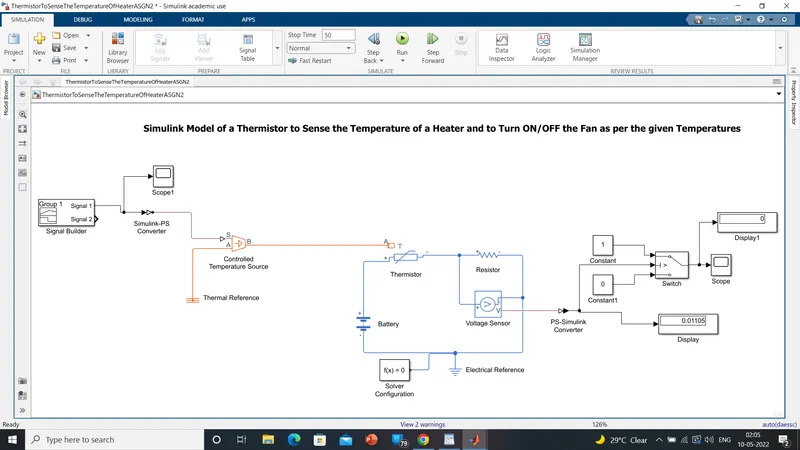
From the above figure we can see the simulink model of a Thermistor to sense the temperature of a heater and to Turn ON/OFF the fan as per the given temperature conditions.
The components used here are:
- Signal Builder: Used to provide Temperature signals to the Thermistor
- Simulink - PS Converter
- Controlled Temperature Source
- Thermal Reference
- Thermistor
- Resistance
- Battery
- Voltage Sensor
- Electrical Reference
- Solver Configuration
- PS-Simulink Converter
- Constant Block
- Switch Block
- Display Block
- Scope
The model creation is explained below.
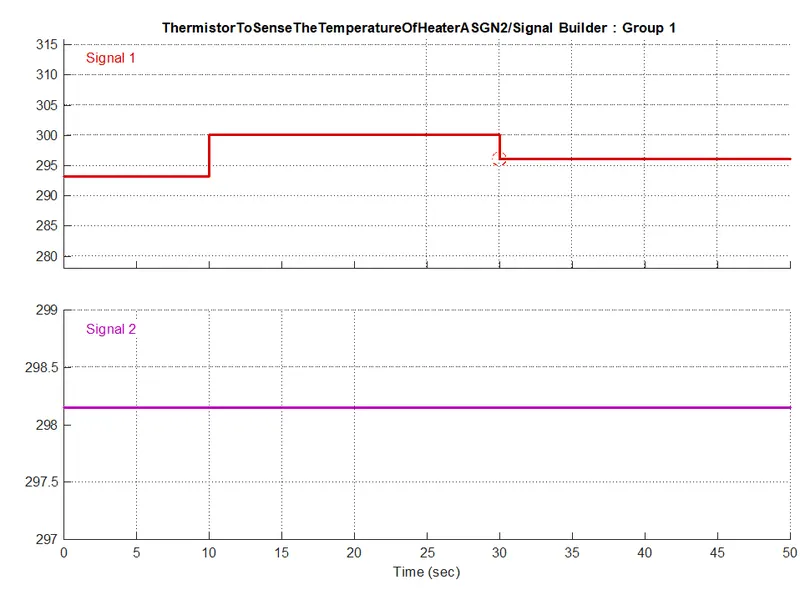
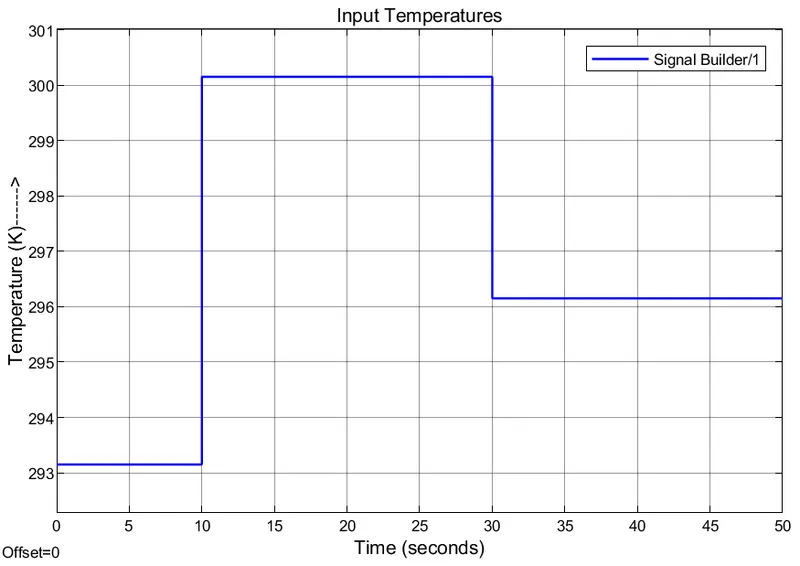
- Firstly, the signal builder block is used to provide the temperature pulses to the thermistor to sense the temperature before the switching operation of the fan. The temperature pulses are given manually in the signal builder block as an input signal. We give 5 temperature inputs at every 10 sec i.e. 50 seconds (20 °C from 0 to 10 seconds, 27 °C from 10 to 30 seconds, 23 °C from 30 to 50 seconds). These are given as 293.15, 293.15, 300.15, 300.15, 296.15, 296.15 for every 10 seconds (Here the temperature is taken in Kelvin).
- Also, the temperature input of 25 degrees (i.e. 298.15 K) is taken as second signal in the signal builder to check the threshold voltage at the display near the voltage sensor.
- The scope is connected to view the input signals of the circuit.
- The Controlled temperature source block is added for maintaining the temperature and is connected to the signal builder through the Simulink-PS converter.
- Port A is connected with the Thermal reference, which represents the temperature is equal to absolute zero.
- The Port A of Thermistor is connected to the Port B of a controlled temperature source block and the +ve terminal of thermistor is connected to a battery and -ve terminal is connected to the resistor. The voltage sensor is connceted across the resistor to sense the output variation of the voltage coming from the thermistor.
- The voltage fluctuation can be seen with the fluctuation of temperature coming from the signal builder block.
- The solver configuration is added to the circuit.
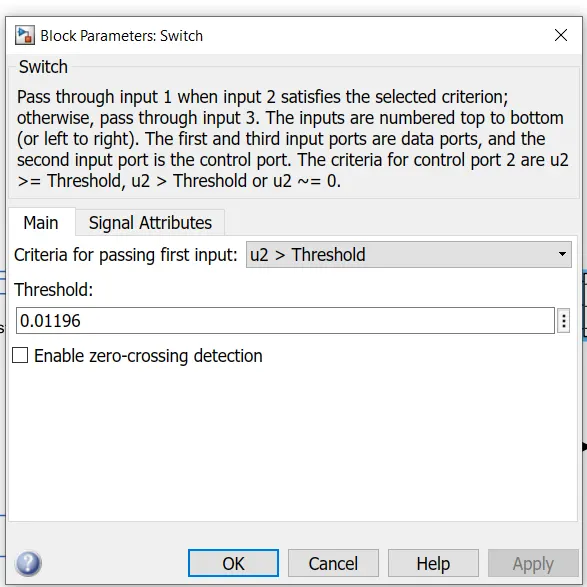
- The stop time is taken as 10 sec, when the temperature is given for 298.15K using signal 2 in the signal builder to check the threshold voltage value at the V terminal of voltage sensor display, and put that value in the conditional switch. (I got the value as 0.01196)
- And now remove the signal 2 of the signal builder and connect the signal 1 to the controlled temperature source by taking the stop time as 50 sec, and run the simulation. Now we will get the output.
- Using the two constants (i.e. 0 or 1) we input the value as 1 if the condition is matched and 0 if it is not matched.
- The final result is seen in the display block if the fan is switched ON or not.
- Using Scope block we can see the graph for 50 seconds time.
INPUT PLOT: SIGNAL BUILDER inputs (i.e. X- axis is Time period and Y-axis is Temperature in Kelvin)
INPUT SCOPE: We can see the input plot has Temperature values at Y-axis and Time period at X-axis.
SIMULATION RESULTS:
OUTPUT SCOPE: We can observe the changes that occured in the voltage under ON and OFF conditions of fan at 50 seconds time period.
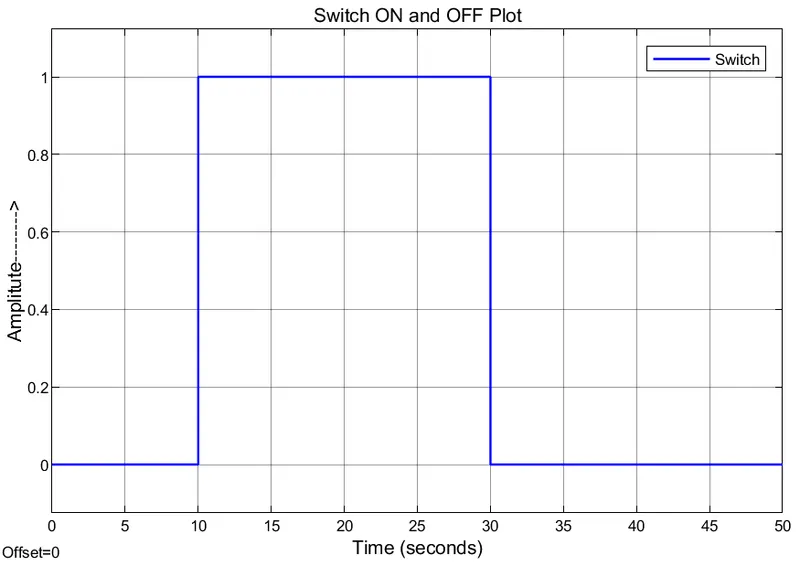
From the above figure, we can see that between the time period 10 to 30 seconds the temperature is beyond 25 degree Celcius so the switch is turned ON and hence the output is there. Also, from the time period of 0 to 10 seconds and 30 to 50 seconds the temperature is less than the 25 degree Celcius, as a result it does not have the voltage to or beyond the threshold point so there is no output produced i.e. switch is turned OFF.
CONCLUSION:
The simulink model of a Thermistor to sense the temperature of a heater and to turn ON/OFF the fan as per the given temperature conditions is built and the outputs are obtained accordingly.