Week 2- 2R Robotic Arm Challenge
Kindly find the following google drive link of the output animation GIF file, made using only Octave.
https://drive.google.com/file/d/1HmttjbwefKxFz6Xdr7rNjZ5cBFgz95fI/view?usp=sharing
Here is the code for this challenge,
% Forward Kinematics of a 2R Robotic Arm Manipulator

clear all
close all
clc

% Inputs
l1 = 2;
l2 = 1;

theta1 = linspace(0,90,10);
theta2 = linspace(0,90,10);
pt = 0.1;
t_span = length(theta1) * length (theta2);

ct = 1;

for i = 1:length(theta1)
  THETA1 = theta1(i);
  for j = 1:length(theta2)
    THETA2 = theta2(j);

    % Coordinates
    x(1) = 0;
    y(1) = 0;

    x(2) = l1*cosd(THETA1);
    y(2) = l1*sind(THETA1);

    x(3) = x(2) + l2*cosd(THETA2);
    y(3) = y(2) + l2*sind(THETA2);

    % Plotting

    plot([x(1),x(2)],[y(1),y(2)],'linewidth',3,'color','b',[x(2),x(3)],[y(2),y(3)],'linewidth',3,'color','r');

    axis ([-0.125 3.5 -0.125 3.5]);
    title ('Range of Movement of a 2R Robotic Arm Manipulator');
    xlabel ('Displacement on X-axis');
    ylabel ('Displacement on Y-axis');
    grid on;

    % Animation Commands
    pause (pt);
    printf ('Creating GIF - Progress.... %d/%dn', ct, length (t_span));
    img = print ('-RGBImage');
    imwrite (img, 'Animation.gif', 'DelayTime', pt, 'Compression', 'bzip', 'WriteMode', 'Append');

    ct = ct+1;
  endfor
endfor
& here are the attached screenshots of the outputs,
Output in the Command Window -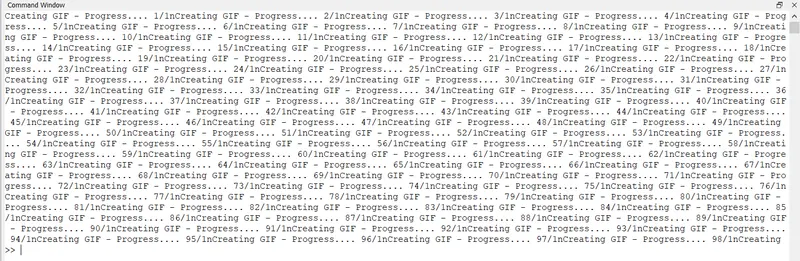
Final Plot Output -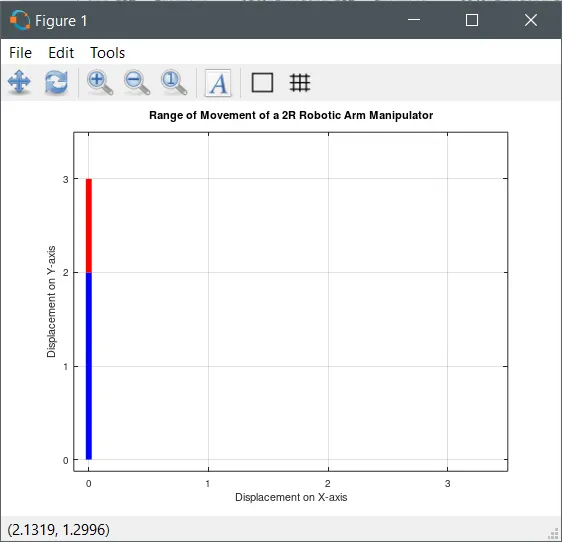
Plot Output while the code was still running -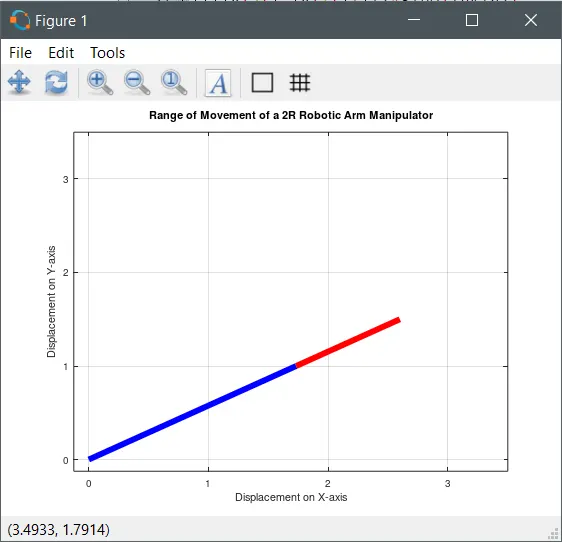
Report of Challenge for Forward Kinematics of a 2R Robotic Arm Manipulator
- Stepwise explanation of the code:
Here’s a brief, explaining the finalized code for the program,
% Forward Kinematics of a 2R Robotic Arm Manipulator

clear all
close all
clc
- Initial commands at the start of a program;
% Inputs
l1 = 2;
l2 = 1;

theta1 = linspace(0,90,10);
theta2 = linspace(0,90,10);
pt = 0.1;
t_span = length(theta1) * length (theta2);

ct = 1;
- Initiating input values as follows :
- length of linkage arms as l1 & l2;
- angle of arms w.r.t. X-axis, as theta1 & theta2 of respective arms,
where, theta1 is an array of 10 values in between 0 & 90 degrees using ‘linspace’ command,
similarly, theta2 is also an array of 10 values in between 0 & 90 degrees using ‘linspace’ command; - pause time of animation in seconds, as pt;
- total number of frames in the animation, as t_span,
where, there is a frame taken in consideration for each value of theta2 across each value of theta1, i.e., the total number of frames would be length of array ‘theta1’ X length of array ‘theta2’; - for loop counter, as ct;
for i = 1:length(theta1)
  THETA1 = theta1(i);
  for j = 1:length(theta2)
    THETA2 = theta2(j);
- Here, the first ‘for’ loop initiates the code inside it, using ‘i’ as the loop counter
for each value of ‘theta1’, till the end of ‘theta1’ array’s last value.
The code inside this loop, using ‘i’ as the index, assigns ‘theta1’s values to ‘THETA1’ variable, one at a time.
then, the second or the nested ‘for’ loop initiates the code inside it, for each value of ‘theta2’, till the end of ‘theta2’ array’s last value.
The code inside this nested loop, using ‘j’ as the index, assigns ‘theta2’s values to ‘THETA2’ variable one at a time.
    % Coordinates
    x(1) = 0;
    y(1) = 0;

    x(2) = l1*cosd(THETA1);
    y(2) = l1*sind(THETA1);

    x(3) = x(2) + l2*cosd(THETA2);
    y(3) = y(2) + l2*sind(THETA2);
- Here, inside the nested ‘for’ loop, is the code for calculating coordinate points of the start & end of the linkage arms 1 & 2 resp.,
where x(1) & y(1) are the coordinates of start point of linkage 1,
where x(2) & y(2) are the coordinates of end point of linkage 1 & start point of linkage 2,
where x(3) & y(3) are the coordinates of end point of linkage 2.
Only start point of linkage 1, is known to be (0,0);
while the end point of linkage 1 is found out using ‘theta1’ in the formula mentioned in the code, similarly, end point of linkage 2 is found out using ‘theta2’ in the formula mentioned in the code.
    % Plotting

    plot([x(1),x(2)],[y(1),y(2)],'linewidth',3,'color','b',[x(2),x(3)],[y(2),y(3)],'linewidth',3,'color','r');

    axis ([-0.125 3.5 -0.125 3.5]);
    title ('Range of Movement of a 2R Robotic Arm Manipulator');
    xlabel ('Displacement on X-axis');
    ylabel ('Displacement on Y-axis');
    grid on;
- This section of the code has the plotting commands for the coordinates calculated before;
The ‘plot’ command, is used to plot a line of ‘linewidth’ – 3, and ‘color’ – ‘Blue’ for representing Linkage 1 on the plot, similarly, the same ‘plot’ command, is used to plot a line of ‘linewidth’ – 3, and ‘color’ – ‘Red’ for representing Linkage 2 as well on the plot,
The ‘axis’ command is used for fixing the axis’s ranges for the plot,
The ‘title’ command is used to show the plot’s title,
Commands ‘xlabel’ & ‘ylabel’ to annotate the axes respectively,
‘grid on’ command is used to turn ON the gridlines for the plot;
    % Animation Commands
    pause (pt);
    printf ('Creating GIF - Progress.... %d/%dn', ct, length (t_span));
    img = print ('-RGBImage');
    imwrite (img, 'Animation.gif', 'DelayTime', pt, 'Compression', 'bzip', 'WriteMode', 'Append');

    ct = ct+1;
  endfor
endfor
- This section of the code, has the animating commands used to make the GIF file using all the plots as frames;
Here’ the ‘pause’ command is used to pause the plot result for the specified value of ‘pt’ variable before showing the next result;
the ‘pause’ command used here does not govern the pausing time for the animation file, it just pauses the output,
The ‘printf’ command used here, helps in keeping track of the GIF creation process,
Then, the ‘print’ command is used to fetch the current plot image & store it in the ‘img’ variable,
Then, the command ‘imwrite’ is used to write images or plots into various specified formats,
here, ‘img’ is the variable where the plot is stored,
& ‘animation.gif’ is the name & format of the file,
& ‘DelayTime’ is the property used to specify the delay time between frames for the GIF file,
& ‘Compression’ is the property used to compress the image files so that they can be compressed to the minimum size possible for GIF creation,
& ‘WriteMode’ is the property used for specifying the writing mode of the frames in the animation gif, which here is ‘Append’.
Lastly, increment for the loop counter ‘ct’, and 'endfor' command to mark the end point for both the ‘for’ loops.
Now, all of this code will be executed again & again for all the values of 'theta1' & 'theta2' due to the condition of the nested 'for' loops,
and each time they are executed, a new plot frame is added to the GIF file which is being created.
2. While optimizing the code, the following errors were faced,
- Error 1-

As per the error, ‘ct’ variable was not defined,
so, defined variable ‘ct’ before the start of the for loop as ‘ct = 1;’
that solved the error.
- Error 2-
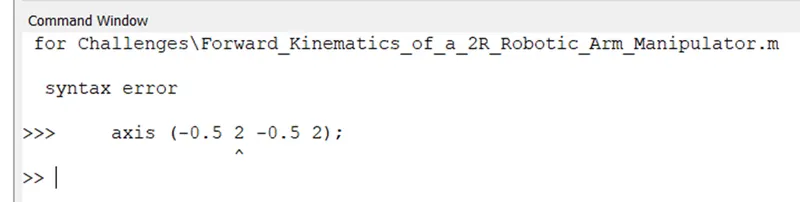
As per the error thrown, there was a syntax error,
so, added ‘[] ‘square brackets, inside the parenthesis for axis’s range,
that solved the error.
- Error 3-
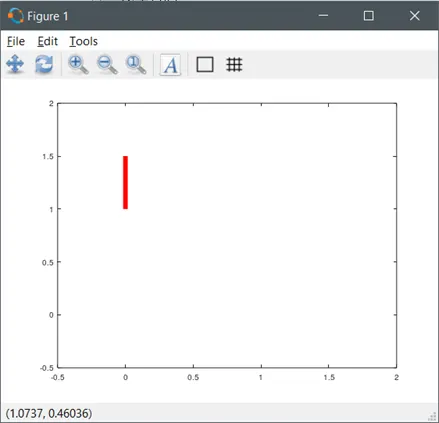
There was no error, but this was not the desired output,
but from this output it was understood that the plot was somehow only plotting the second arm only,
so tried ‘hold on’ command to hold on to the first arm plot as well,
but that resulted in a single plot window with all the plots as such,
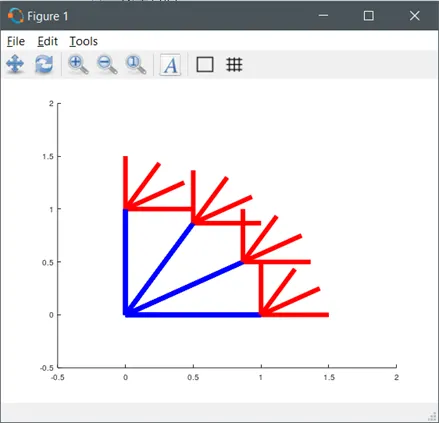
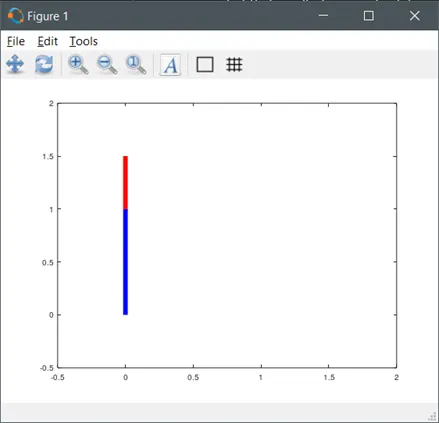
Then, removed the ‘hold on’ command, and used a single plot command only, to plot both the arms,
the command would then be as such,
plot([x(1),x(2)],[y(1),y(2)],'linewidth',3,'color','b',[x(2),x(3)],[y(2),y(3)],'linewidth',3,'color','r');That solved the rectified the output to the desired output as such,
- Error 4-

The code ran without errors, but the problem was that the GIF file had images or frames of the earlier faulty plot in it as well,
as such -
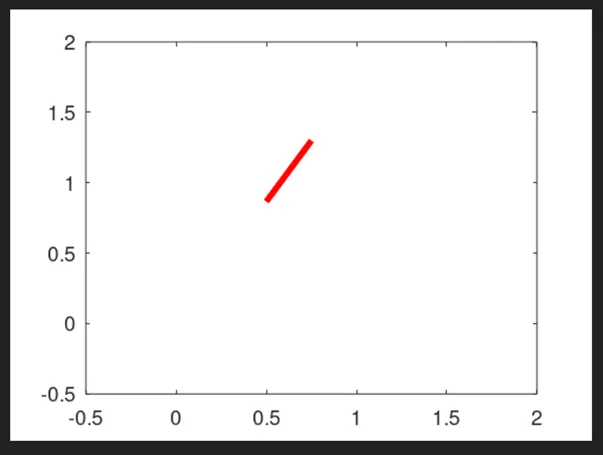
I think this was due to those wrong earlier outputs, but still they were written into the file,
because of the ‘WriteMode’ – ‘Append’, which adds the frames to the file and keeps already placed frames in the gif. as it is. So, to solve that, I’m simply deleting the existing file, and rerunning the code will fix it, with the exact desired plots.