Week 12 - Final Project - Modelling and Analysis of a Datacenter
Aim:-
The objective of the project is to create a data center model using macros in Icepak. The main parts of the data center are Computer room air conditioning (CRAC), server cabinets, power distribution units, and perforated tiles. Analyze the flow distribution and behavior of temperature in the server stacks.
Introduction:
- A data center is a building, a dedicated space within a building, or a group of buildings used to house computer systems and associated components, such as telecommunications and storage systems.
- A data center is a facility that centralizes an organization's shared IT operations and equipment for the purposes of storing, processing, and disseminating data and applications. Because they house an organization's most critical and proprietary assets, data centers are vital to the continuity of daily operations.
- Data centers are made up of three primary types of components: compute, storage, and network.
- The essential components of any data center often include cybersecurity systems, firewalls, routers, servers, storage systems, and switches. A core commonality of all data centers is servers.
Problem Description:
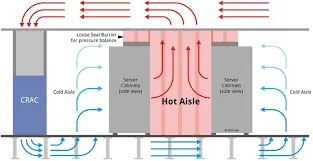
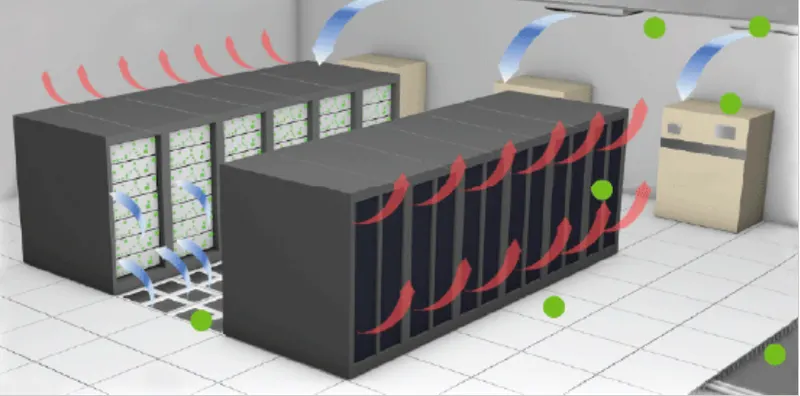
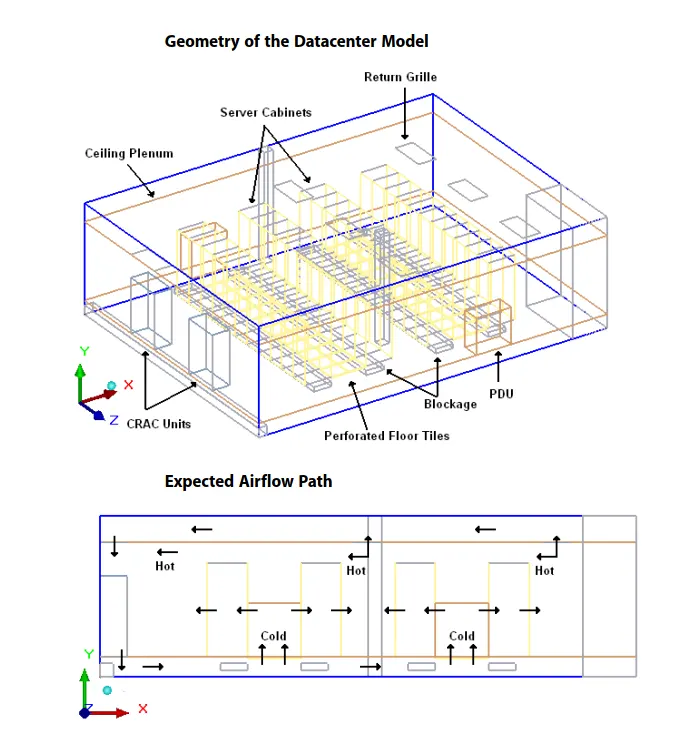
This tutorial considers a 1200 sq. ft. datacenter with a slab-to-slab height of 12 ft. The data center consists of a 1.5 ft underfloor plenum and a 2 ft ceiling plenum. The CRACs discharge cold air into the underfloor plenum. The cold air enters the main data center space mainly through the perforated floor tiles and returns back to the air conditioning units. The cooling load is summarized below. The size and Capacity of Heat Sources in Datacenter correspond to the heat output from the server cabinets and the PDUs. A PCB board, library files, and traces are imported to create the model. The model is first solved for conduction only, without the components, and then solved using the actual components with forced convection.
|
Heat Source |
Size |
Power |
|
Server Cabinet |
2 ft x 3 ft x 7 ft |
3000 W |
|
High Density |
2 ft x 3 ft x 7 ft |
7000 W |
|
PDU |
4 ft x 2 ft x 5 ft |
3600 W |
Model
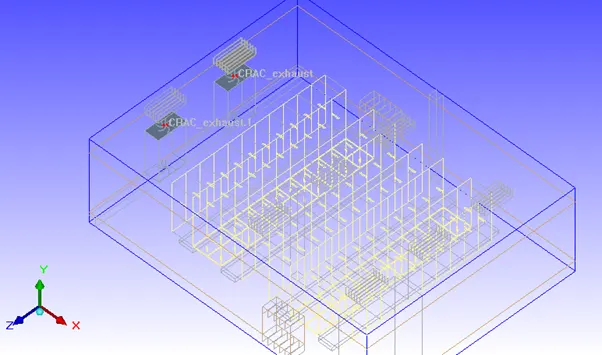
The following objects are created in Icepak using the design specification.
i) Cabinet: It creates a fluid region around the model for which the governing equations are solved.
Geometry
- Shape - Prism.
- Specified By - Start/end.
- Start Xs - 0.
- Start Ys - 0.
- Start Zs - 0
- End Xe - 40ft.
- End Ye - 12ft.
- End Ze - 30ft.
ii) Raise the floor
The plate object is used
- Shape - Rectangular.
- Plane - X-Z.
- Specified By - Start/end.
- Start Xs - 0.
- Start Ys - 1.5ft.
- Start Zs - 0
- End Xe - 40ft.
- End Ze - 30ft.
iii) Computer room air conditioning (CRAC)
Macros --> Modelling --> Data center componnets --> CRAC.
- Specified By - Start/length.
- Start Xs - 0.
- Start Ys - 0.
- Start Zs - 0
- Length Xl - 2ft.
- Length Yl - 6ft.
- Length Zl - 4ft.
- Flow direction - -Y.
- Fan Specification - Simple.
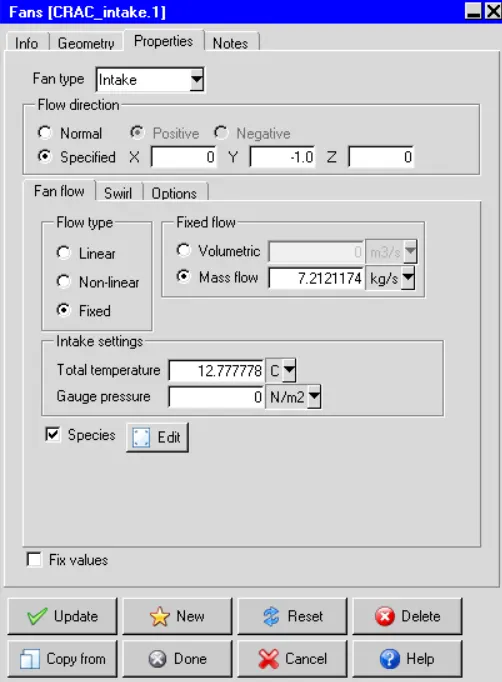
Intake fan specification
- Mass flow rate - 15.9 lbm/s.
- Supply temperature - 55F.
- Create a group and name it as CRACs
Copy the CRAC & translate the 10ft along Z and create a group and name it CRACs1.
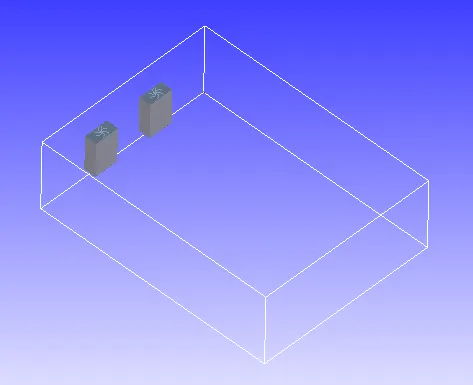
iv) Rack 1
Macros --> Modelling --> Data center components --> Rack (front to rear).
- Specified By - Start/length.
- Start Xs - 0.
- Start Ys - 0.
- Start Zs - 0
- Length Xl - 3ft.
- Length Yl - 7ft.
- Length Zl - 2ft.
- Flow direction - -X.
Rack specification
- Heat load - 3000W.
- Volume flow - 450 CFM.
- No of racks - 11.
- Create an additional rack along - +Z.
Create a group and name it RACKs.
The direction of flow in an adjacent rack will be in opposite direction.
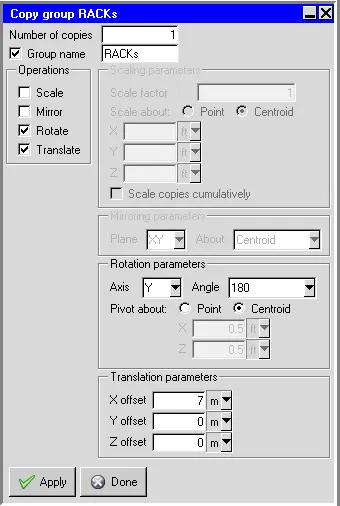
Copy the Racks, translate the 7ft along X and rotate around the Y axis, angle - 180 and pivot about the centroid & name the group as RACKs
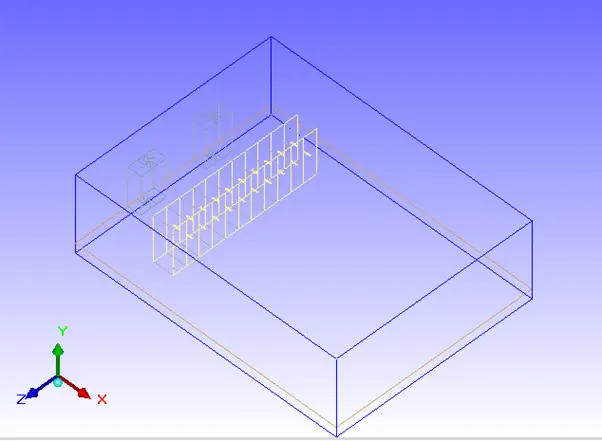
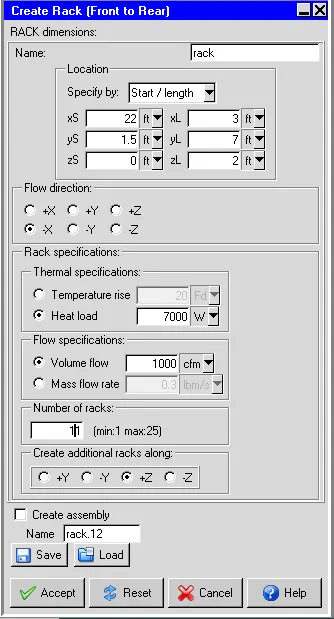
Rack 2
Macros --> Modelling --> Data center components --> Rack (front to rear).
- Specified By - Start/length.
- Start Xs - 22ft.
- Start Ys - 1.5ft.
- Start Zs - 4ft.
- Length Xl - 3ft.
- Length Yl - 7ft.
- Length Zl - 2ft.
- Flow direction - -X.
Rack specification
- Heat load - 7000W.
- Volume flow - 1100 CFM.
- No of racks - 11.
- Create an additional rack along - +Z.
Create a group and name it HD RACKs.
The direction of flow in the adjacent rack will be in opposite direction.
Copy the Racks, translate the 7ft along X and rotate around the Y axis, angle - 180, and pivot about the centroid & name it as HD RACKs.
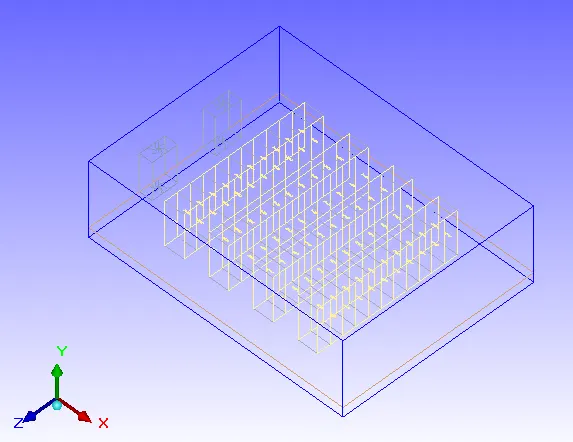
v) Perforated Tiles
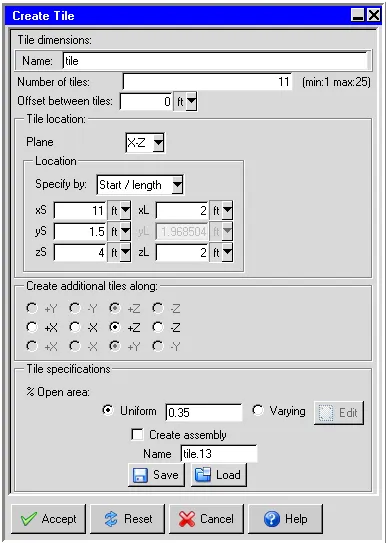
Macros --> Modelling --> data center components --> Tiles.
- Plane - X-Z.
- No tiles - 11.
- Specify by - Start/length.
- Start Xs - 11ft.
- Start Ys - 1.5ft.
- Start Zs - 4ft.
- Length Xl - 2ft.
- Length Zl - 2ft.
- Create additional tiles along - +Z.
- Open Area:
- Uniform - 0.35.
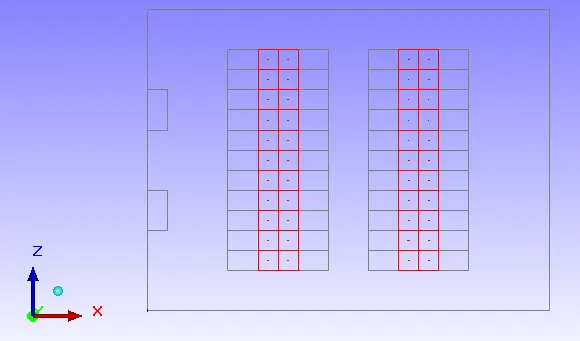
Copy the Tiles & translate 2ft along X, create the group & name it Tile.
Copy the Tile group & translate 14ft along X.
vi) Ceiling
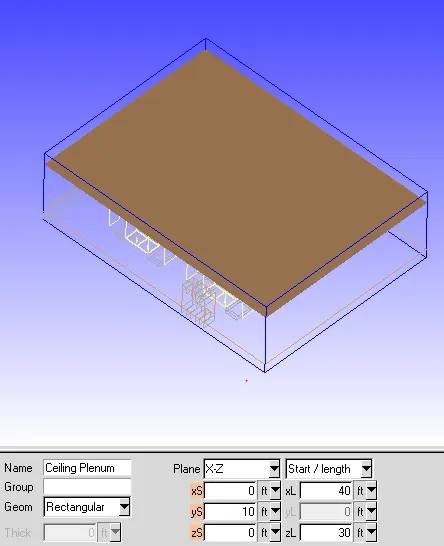
- Plane - X-Z.
- Specify by - Start/end.
- Start Xs - 0.
- Start Ys - 10ft.
- Start Zs - 0.
- End Xe - 40ft.
- End Ze - 30ft.
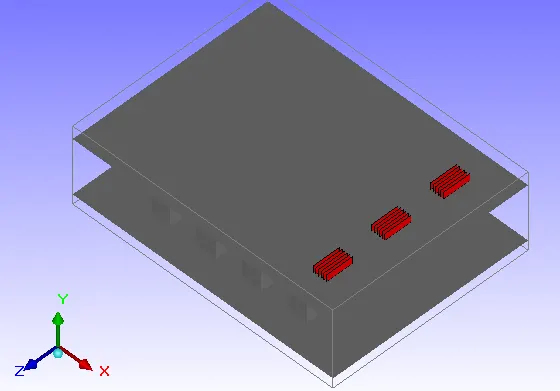
vii) Grille 1
- Shape - Rectangular.
- Plane - X-Z.
- Specified By - Start/length.
- Start Xs - 33ft.
- Start Ys - 10ft.
- Start Zs - 4ft.
- Length Xl - 2ft.
- Length Zl - 4ft.
- Free area ratio - 0.5.
Copy the grille & translate 9ft along Z.
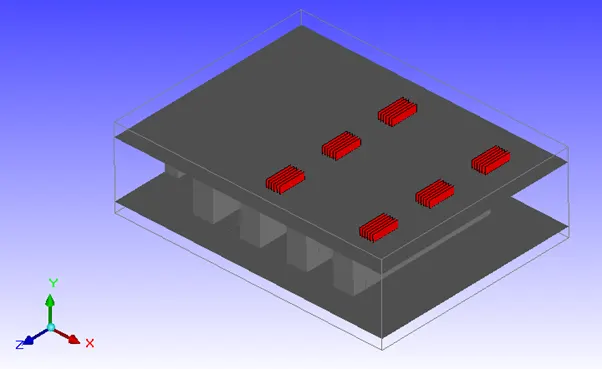
Grille 2
- Shape - Rectangular.
- Plane - X-Z.
- Specified By - Start/length.
- Start Xs - 0.
- Start Ys - 10ft.
- Start Zs - 8ft.
- Length Xl - 2ft.
- Length Zl - 4ft.
- Free area ratio - 0.5.
Copy the grille & translate 10ft along Z.
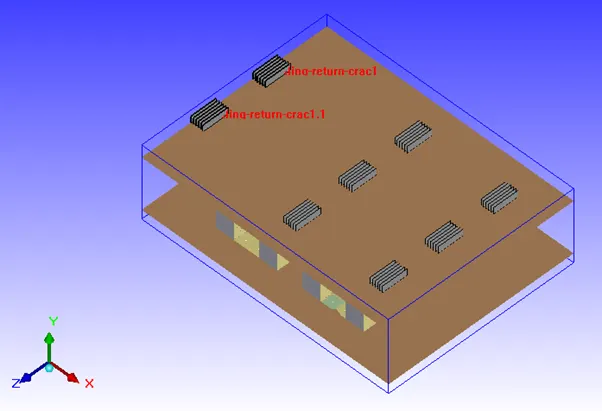
viii) Power distribution unit
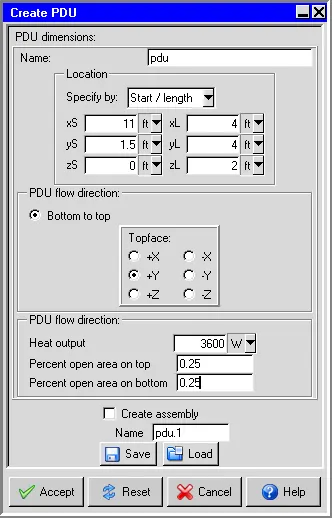
Macros --> Modelling --> Data center componnets --> PDU.
- Specified By - Start/length.
- Start Xs - 11ft.
- Start Ys - 1.5ft.
- Start Zs - 0
- Length Xl - 4ft.
- Length Yl - 4ft.
- Length Zl - 2ft.
- Bottom to top - Top face - +Y.
Flow direction
- Heat load - 3600W.
- Percent open area on top - 0.25.
Percent open area on the bottom - 0.25 & create the group & name it as PDU.
Copy the grille & translate 14ft along X & 28ft along Z.
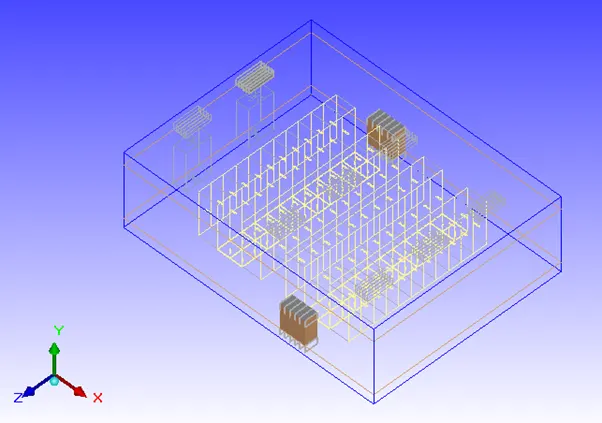
ix) Pipe 1
- Group name - Blockage.
- Specified By - Start/length.
- Start Xs - 0.
- Start Ys - 0.
- Start Zs - 0
- Length Xl - 1ft.
- Length Yl - 1ft.
- Length Zl - 30ft.
- Type - Hollow.
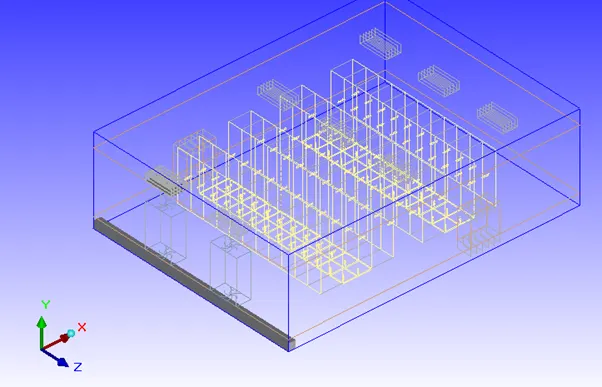
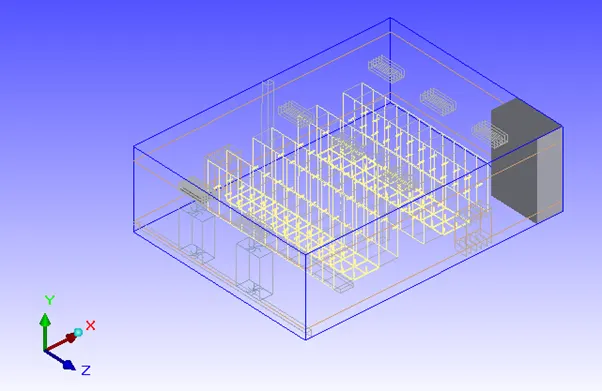
Pipe 2
- Group name - Blockage.
- Specified By - Start/length.
- Start Xs - 36ft.
- Start Ys - 0.
- Start Zs - 22ft.
- Length Xl - 4ft.
- Length Yl - 12ft.
- Length Zl - 8ft.
- Type - Hollow.
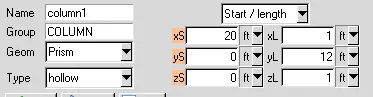
x) Column
- Group name - Blockage.
- Specified By - Start/length.
- Start Xs - 20ft.
- Start Ys - 0.
- Start Zs - 0.
- Length Xl - 1ft.
- Length Yl - 12ft.
- Length Zl - 1ft.
Copy the column & translate 20ft along Z.
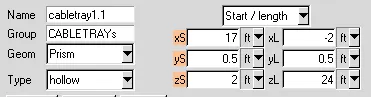
x) Cable trays
- Group name - Blockage.
- Specified By - Start/length.
- Start Xs - 11ft.
- Start Ys - 0.5ft.
- Start Zs - 2ft.
- Length Xl - -2ft.
- Length Yl - 0.5ft.
- Length Zl - 24ft.
Copy the column & translate 6ft along X.
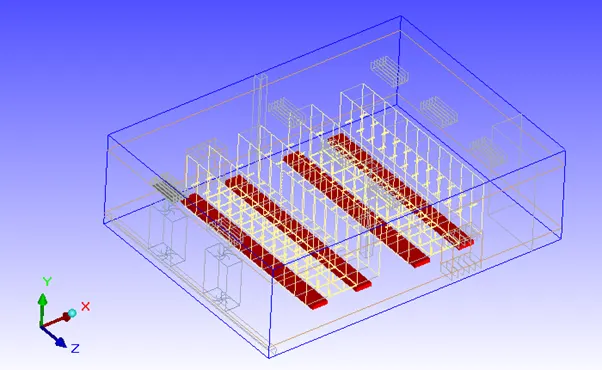
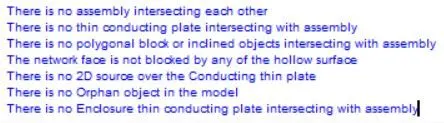
- Macros --> Productivity --> Validation --> Automatic case check tool - It checks the assembly interface between the various objects and assembly.
Mesh Control
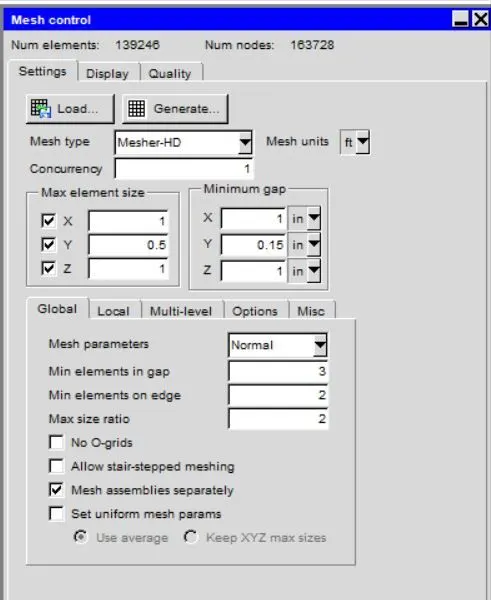
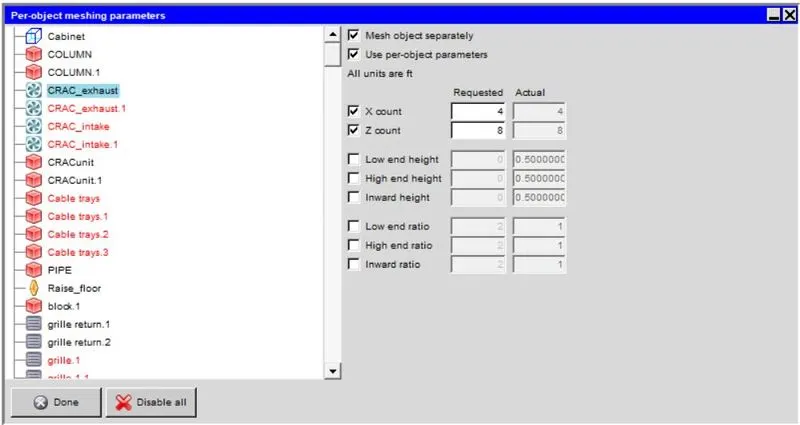
The mesh refinement of the bus bar are done by increasing the element count along the cross-section. Select CRAC components --> Set --> object mesh parameter & increase the count value.
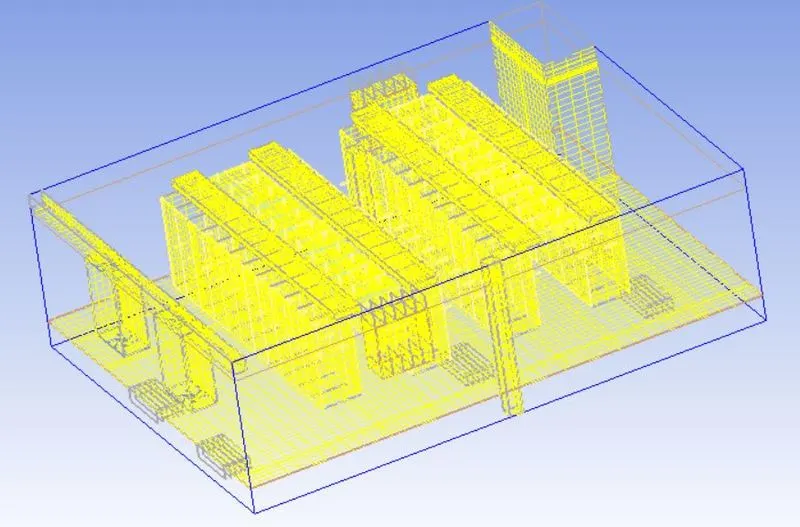
The Mesh for the three planes passing along the center of the control panel.
X Plane
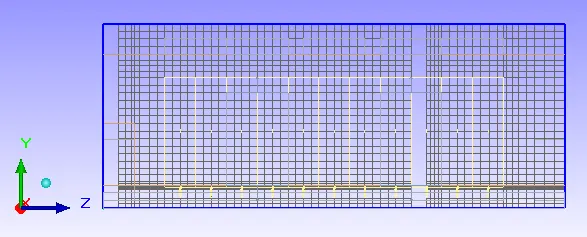
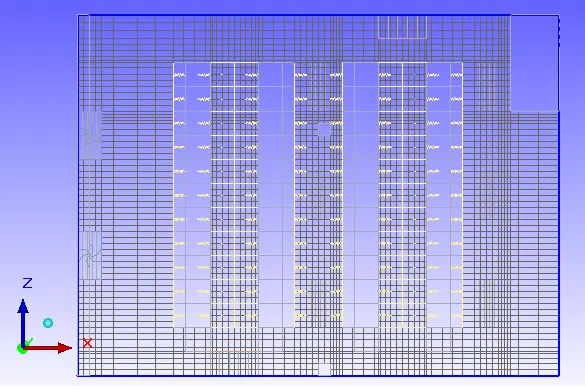
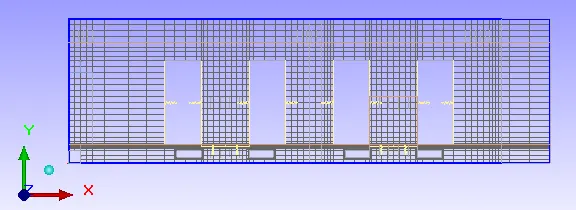
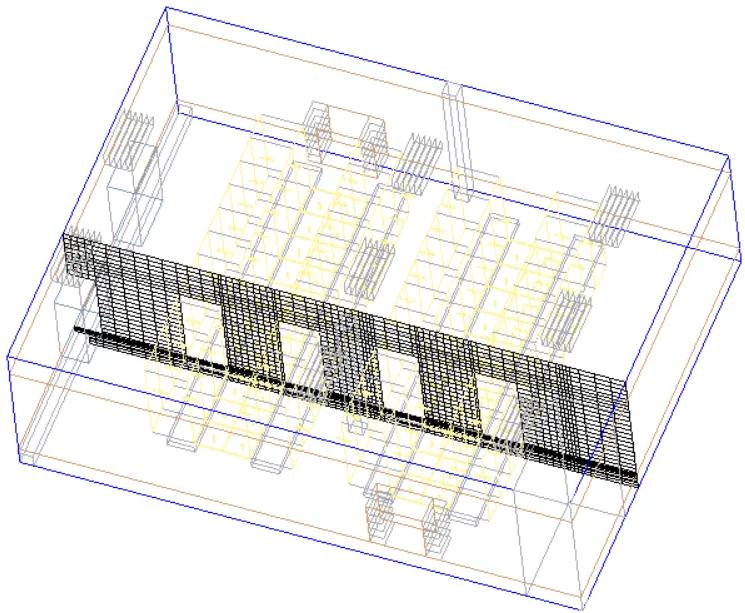
Surface mesh
Mesh Quality
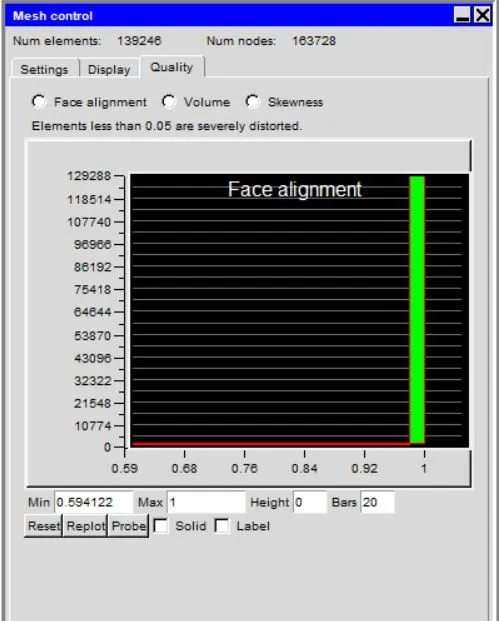
Face alignment
- It is the measure of mesh quality defined by face alignment index = C0C1.f
- C0 & C1 are the centroids of two adjacent elements and are normal vectors to the face between the two elements.
- Range of face alignment 0 (bad) to 1 (good) & value greater than 0.1 (preferred) & value greater than 0.15 provide better results.
- The min value of the model is 0.594 which is ideal for the results.
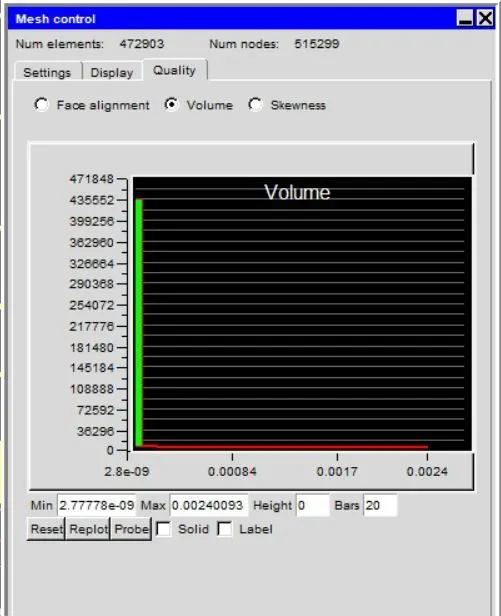
Volume
- The preferable volume of mesh to be greater than 1e-13 for single precision solver & greater than 1e-15 for double precision.
- Max / Min cell volume should be less than 10^7 for single precision & must be less than 10^12 for double precision since very small volume create divergence of the solution.
- The volume of the mesh is greater than 10^-13 & Max / Min cell ratio is around 8.642e5 which is in the required range & double precision is used for this model.
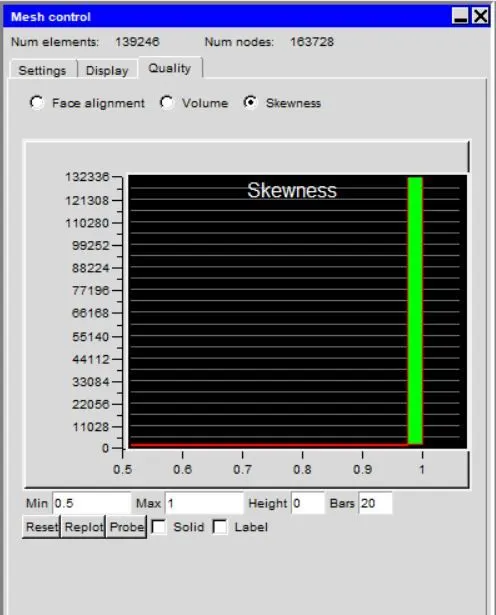
Skewness
- It determines how close to the ideal & is based on the equilateral volume. A value greater than 0.5 provides good cell quality.
- The min value of the skewness is 0.5 so it is ideal for the simulation.
Solver
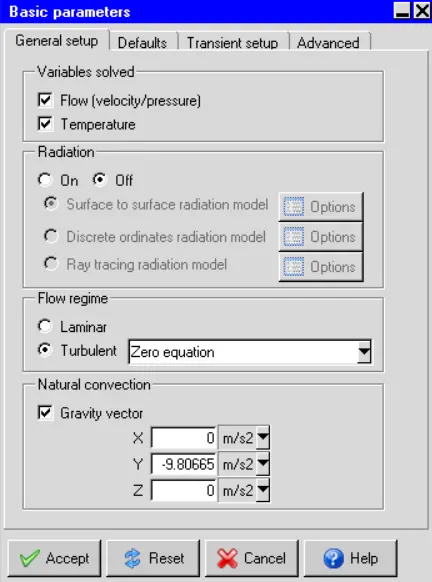
- In the basic parameters where we have given whether the solution runs for temperature, flow, and setting up for the initial temperature as well as radiation temperature, etc.
- Here we are solving both the flow and temperature variables for the modeled geometry.
- We are neglecting the radiation effect because we are interested in solving major heat transfer spots.
- The turbulent model we are calculating is Zero-equation.
- A turbulent flow regime has to be calculated with the gravity vector of -9.81 m/s in Y-direction in the natural convection space.
- Internal convection usually cannot be treated using simple boundary layer theory because the entire fluid in the enclosure engages in convection.
- When heat is added to a fluid and the fluid density varies with temperature, a flow can be induced due to the force of gravity acting on the density variations. Such buoyancy-driven flows are termed natural-convection (or mixed-convection) flows and can be modeled by ANSYS FLUENT.
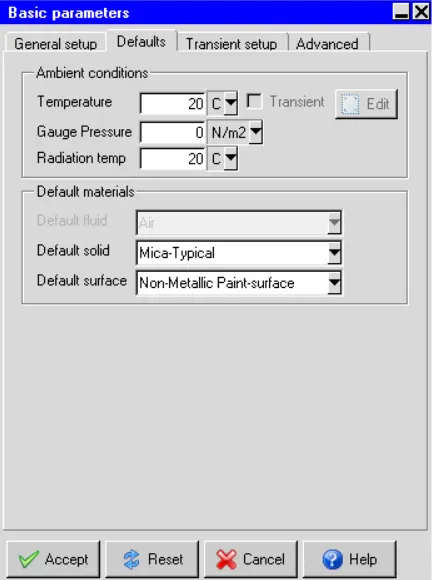
- The temperature conditions maintained inside are ambient in nature, which is 20 degrees centigrade.
- The solid materials used in the model are Mica-Typical.In the electrical industry the same as thermal insulation, and electrical insulators in electronic equipment.
- The surface material used is Paint-non metallic.
- Here we have enabled the species section and provided the H2O gas as a species inside the model of the data center.
General Setup
- Variables solved - flow and temperature.
- Radiation - Off.
- Flow regime - Turbulent - The zero equations are solved for the turbulent model.
Natural convection is considered for this model.
The gravity vector for the y-axis is set to -9.81 m/s2.
The default value of the parameters is set to default.
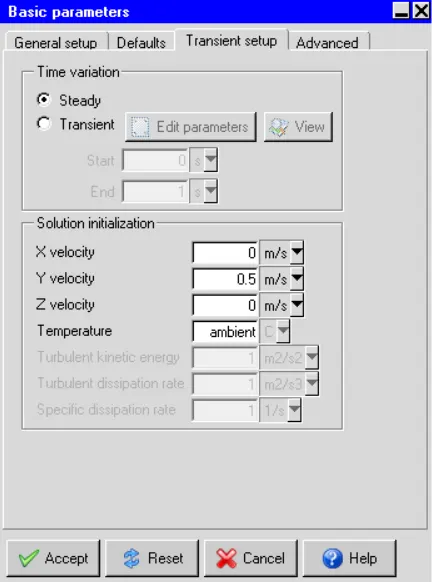
- Time variation - Steady
- Default solid - Mica typical.
- Default Surface - Paint non-metallic
Solution Initialization
- X velocity - 0.
- Y velocity - 0.5 m/s.
- Z velocity -0.
- Temperature - ambient.
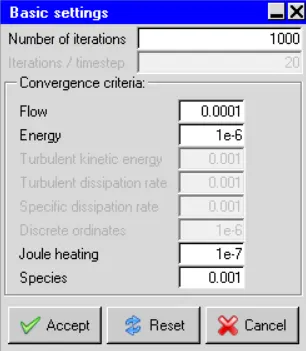
Basic settings
- No of iterations - 1000.
Convergence criteria
- Flow - 0.0001.
- Energy - 1e-10.
- Joule heating - 1e-7.
Parallel Settings
- Configuration - parallel.
- Parallel options - 4 processors.
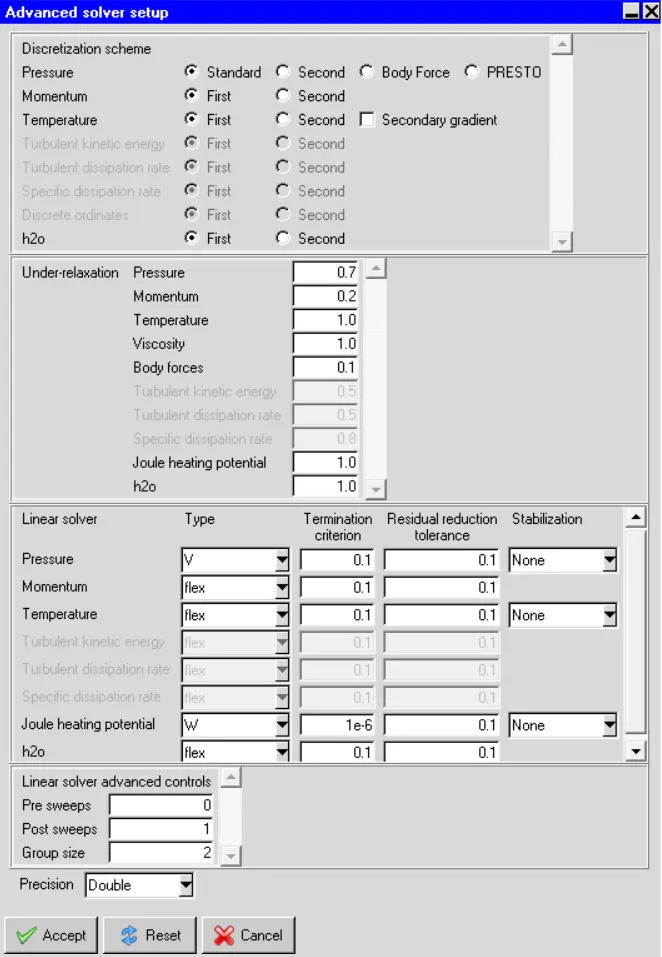
Advance Solver Setup
- Here in this panel, we give the inputs as the discretization schemes for the pressure, momentum, and temperature are of the first order.
- The double precision is given. Single precision means that the floating-point numbers will be represented in a 32-bit system whereas double-precision means that they will be represented in a 64-bit system. So Calculation in double precision will be more accurate.
- We have adjusted the under-relaxation factors of momentum and body force for the convergence criteria.
Results
The residuals for the following equations are plotted against the number of iterations:
- Continuity equation.
- X-momentum equation.
- Y-momentum equation.
- Z-momentum equation.
- Energy equation.
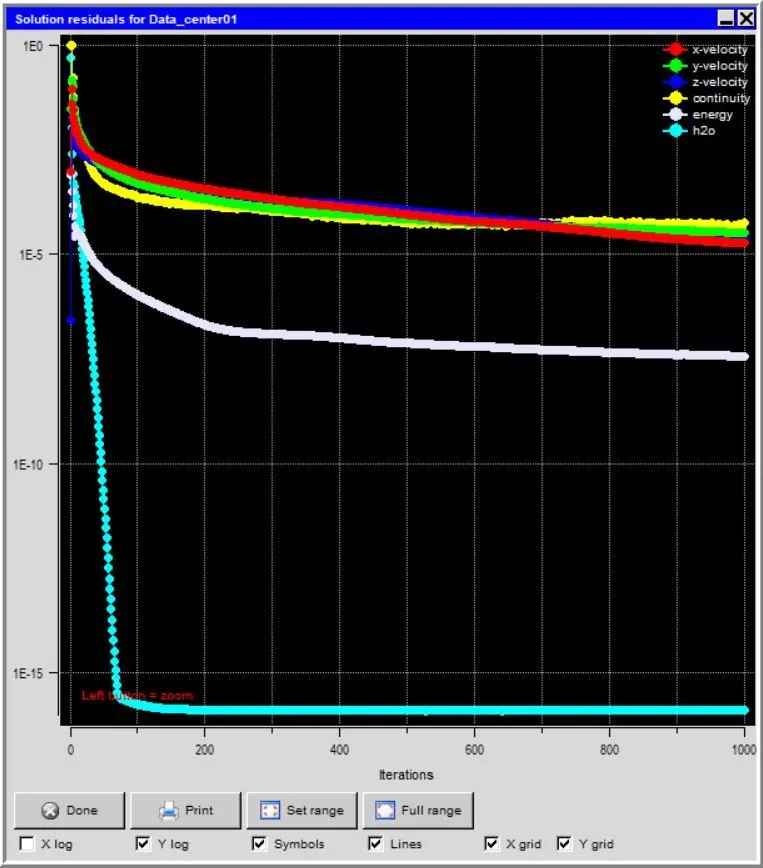
The solution converged around 1000 iterations and the solution has reached a steady state.
Monitor points
Temperature monitor points are created within the computational domain not only to monitor the steady-state temperatures of the key objects in the model, such as heat sources and heat sinks but also to inform the advent of a steady state. The image attached below shows the data recorded by the temperature monitor points plotted against the number of iterations.
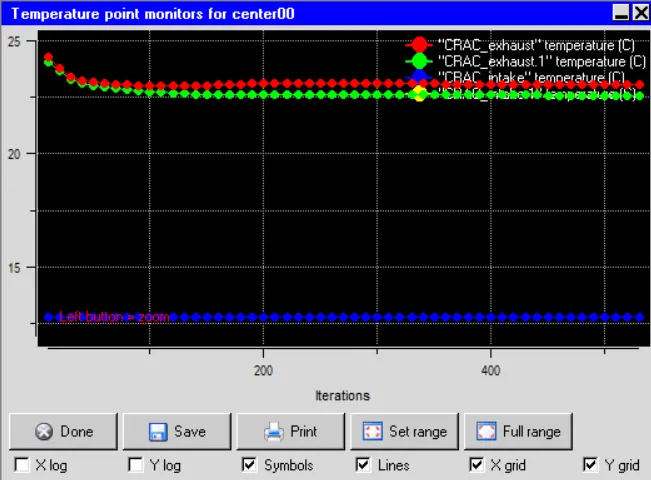
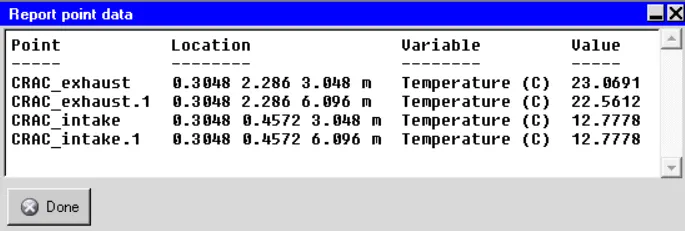
It can be seen that after 100 iterations there is no appreciable change in the recorded temperatures which indicates that the energy equation has possibly converged. According to the plot, the objects attain the following steady-state temperatures:
Results:
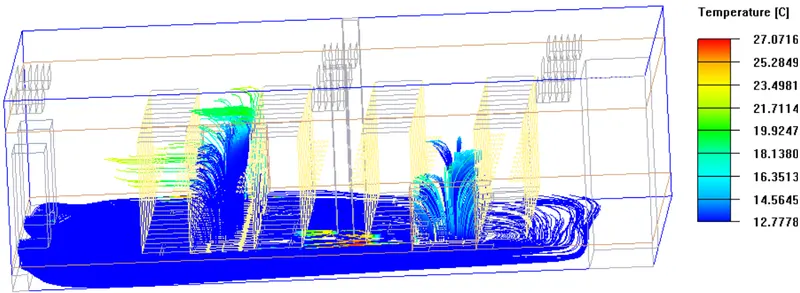
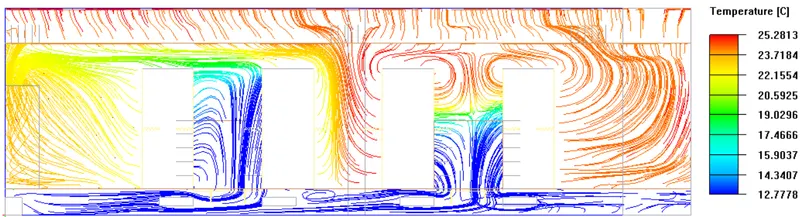
Temperature Contours:
- Filled colors, give a good visualization of the temperature, pressure, mass flow rate, etc.
- The color legends are used to show the temperature contour.
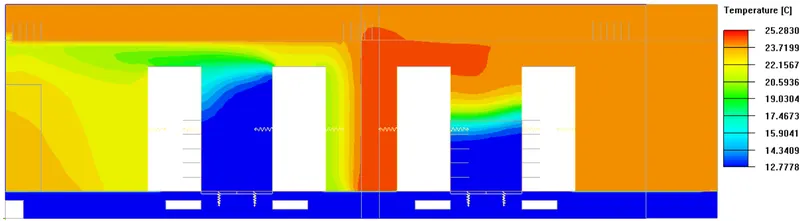
- The above contour shows the temperature behavior inside the modeled data centre.
- The inlet temperature from the CRAC units is 12.78 degrees centigrade. But due to the inside temperature or the server rack's temperature, the temperature hike is observed and raised up to 29 degrees centigrade.
- In the total of 4 server racks, we have given different heat fluxes. So that the temperature difference at the server racks has been observed.
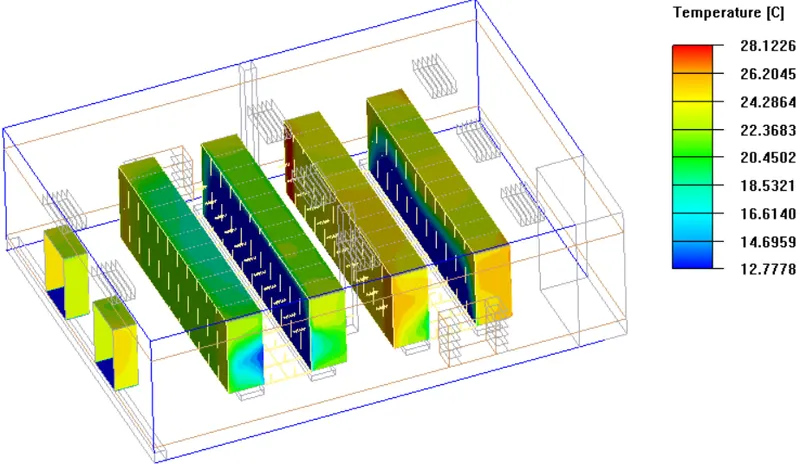
- The above picture is the Object face of some of the components we have modeled. The behavior of the temperature of the server racks has been demonstrated with the contour colors.
- Because server rack, 4 is far from the tiles, the highest temperature is recorded on one of the sides of the servers.
- Due to the difference in the heat flux of server racks, we have given 3000 Watt and 5000 watts for a couple of servers.
Velocity:
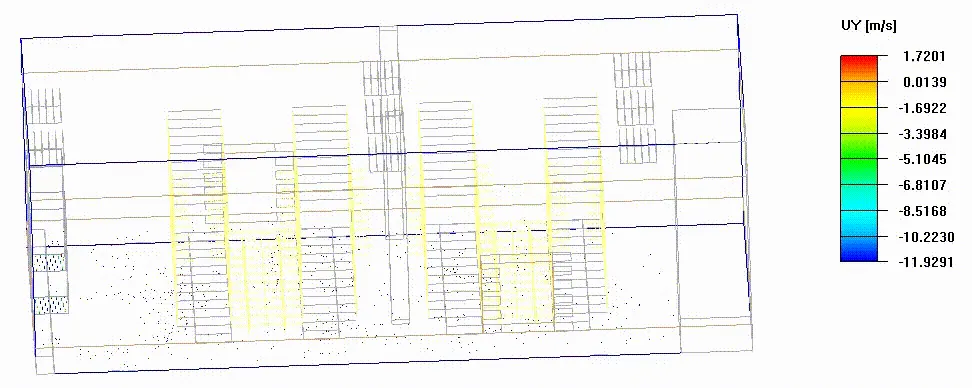
- Through CRAC units the air intake has happened and through the exhausts of CRAC warmed air is circulated and went outside.
- The intake velocity of 0.5 m/s is provided in the Y-direction for the circulation of air inside the modeled data center.
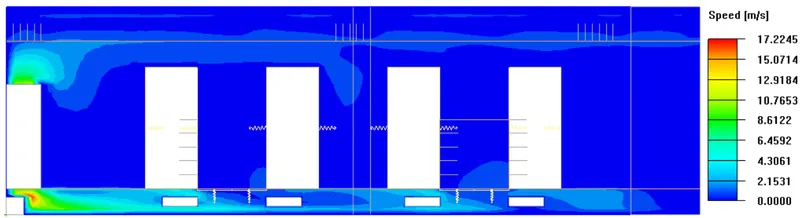
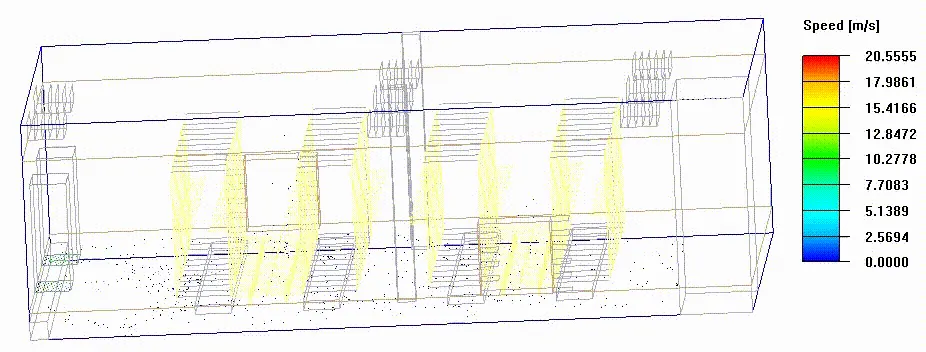
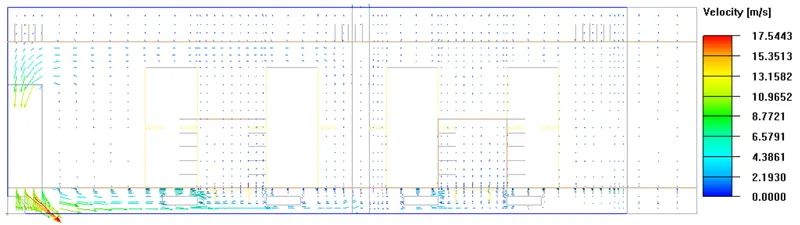
- The inlet velocity is given in the Y-direction with 0.5 m/s.
- The maximum velocity circulated and calculated as 21.3 m/s.
- The max. velocity attained at the location of CRAC unit intake, and from there the air is circulated into the entire data center with the dissipated velocity.
Conclusion:
- The Datacentre is modeled with the macros as mentioned in the challenge. Using macros, the components like PDUs, CRACs, server racks, etc are provided.
- Using the grouping concept, all the components have been merged into particular groups.
- Using object-specific meshing parameters, the meshing of components like computer room air conditioning units (CRACs), server cabinets, power distribution units (PDUs), and perforated floor tiles have meshed to maintain accuracy in the captured physics.
- Finally, to understand the flow of air and temperature stratification, the post-processing tools like contours, object faces, vectors, and particle traces have been used.