Braking
Braking
Objective:
- Defining driving cycle and calculating the energy required for braking.
- Explaining the reason behind electric motor not developing braking torque at high speed similar to starting.
- Creating MATLAB program plotting contour of given motor speed, torque and efficiency values.
Answer:
1. For a defined driving cycle, calculate the energy required for braking.
The equation for braking energy is given as;
`B.E = frac{1}{2}*m*v^2`
where,
`B.E` = Energy required for braking (kWH)
`m` = Gross Vehicle Weight (kg)
`v` = Velocity of the vehicle (`frac{m}{s^2}`)
Lets take the Drive Cycle for race track at Le Mans. During cornering and while taking turns the speed of the vehicle needs to be brought down using braking.
In the year 1966, Ken Miles created the record of fastest lap of 210 sec, driving Ford GT 40 at Circuit de la Sarthe.
The created Drive Cycle for Le Mans is;
https://docs.google.com/spreadsheets/d/1abtjbPDk3Emri0Uq0oj7pLYhh3PRtvBJB8CxtWwR1QA/edit?usp=sharing

Fig: Created Le Mans Drive Cycle
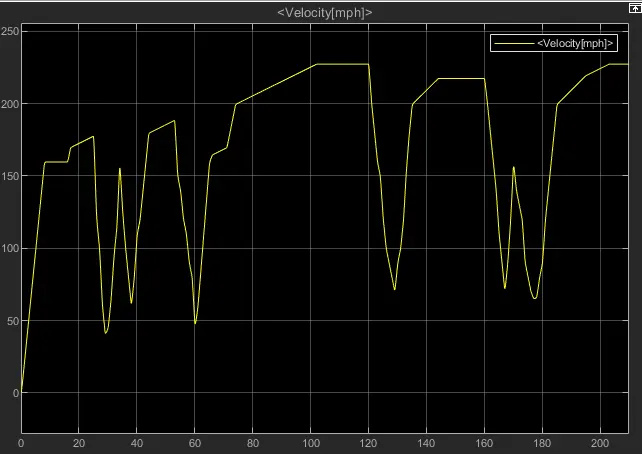
Fig: Drive Cycle of Le Mans
There are 6 instances where the vehicle required to brake during cornering and taking a turn.
The total weight of the vehicle is;
m = Kerb Weight + Weight of the driver = 1217 + 75 = 1292 kg.
At first instance, velocity was brought down to 40 mph from 178 mph.
`therefore` Velocity difference in first interval is 138 mph i.e 61.6915 m in 12 sec i.e 5.1513 m/s
At second instance, velocity was brought down to 60 mph from 160 mph.
`therefore` Velocity difference in second interval is 100 mph i.e 44.704 m in 6 sec i.e 7.45 m/s
At third instance, velocity was brought down to 45 mph from 189 mph.
`therefore` Velocity difference in third interval is 144 mph i.e 64.3738 m in 8 sec i.e 8.05 m/s
At fourth instance, velocity was brought down to 70 mph from 228 mph.
`therefore` Velocity difference in fourth interval is 158 mph i.e 70.6323 m in 8 sec i.e 8.83 m/s
At fifth instance, velocity was brought down to 70 mph from 218 mph.
`therefore` Velocity difference in fifth interval is 148 mph i.e 66.1619 m in 7 sec i.e 9.45 m/s
At sixth instance, velocity was brought down to 65 mph from 160 mph.
`therefore` Velocity difference in sixth interval is 95 mph i.e 42.4688 m in 6 sec 7.07 m/s
`B.E_1 = frac{1}{2}*1292*5.15^2 = 17133.535/60 = 285.55 = 0.285 kWH`
`B.E_2 = frac{1}{2}*1292*7.45^2 = 35854.615/60 = 597.57 = 0.597 kWH`
`B.E_3 = frac{1}{2}*1292*8.05^2 = 41862.415/60 = 697.71 = 0.698 kWH`
`B.E_4 = frac{1}{2}*1292*8.83^2 = 50367.91/60 = 839.47 = 0.839 kWH`
`B.E_5 = frac{1}{2}*1292*9.45^2 = 57689.415/60 = 961.49 = 0.961 kWH`
`B.E_6 = frac{1}{2}*1292*7.07^2 = 32290.25/60 = 538.17 = 0.538 kWH`
`therefore` Total B.E in one lap = `0.285 + 0.597 + 0.698 + 0.839 + 0.961 + 0.538 = 3.918 kWH`
The energy required for braking is 3.918 kWH.
2. Why electric motor can’t develop braking torque at high speed similar to starting? How electric and mechanical brakes are coordinated?
In Vehicle, braking is achieved by using Mechanical brake or Regenerative Brake. Regenerative braking is unique to EVs and enables the vehicle’s kinetic energy to be converted back to electrical energy during braking (deceleration or downhill running). The converted electrical energy is stored in energy storage devices such as batteries, to extend the driving range by up to 10%. If the regenerative braking power requirement is more than the charging limit of the battery or the regenerative capacity of the machine, the mechanical brake has to be applied along with ir. In practical, the combination of Mechanical brake and Regenerative Brake.
The Speed Torque Characteristic of DC motor is as follow;
Fig: Speed Torque Characteristic of Synchronous DC motor
The below is the Contour Speed Torque Characteristic of one of the DC motor.
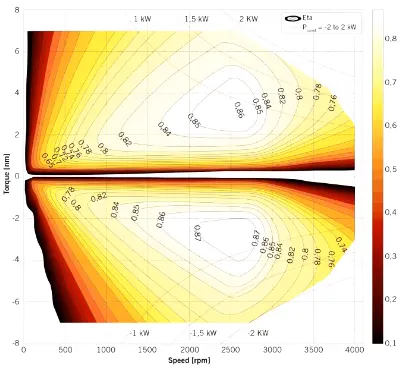
Fig: Contour Speed Torque Characteristic of DC motor
The plot shows Motor characteristic in two quadrant i.e. 1 and 2. In quadrant 2 the torque is negative. The characteristic of 1st and 2nd quadrant is almost similar. An EV accelerate to certain speed in certain time but the reverse of that cannot be achieved. As in constant torque region higher acceleration is possible and then vehicle reaches the point of constant power. This is where the acceleration is achieved. Its easier for motor to achieve acceleration in this manner. When it comes to braking, where the torque is negative. When this is replicated in the reverse direction, the braking torque required goes down as the vehicle is in the constant power region lower than the torque which was required during acceleration. So while braking the peak torque is less than the torque required during acceleration. Hence, peak acceleration and peak decceleration torque is not same.
Electric and Mechanical brakes are co-ordinated in the following fashion;
1. Series Brake Control Strategy:
In case of series brake, we apply Mechanical brake and Regenerative brake one after the another i.e applying one one brake at a time.
2. Parallel Brake Control Strategy:
In case of parallel brake, we apply Mechanical brake and Regenerative brake at a time i.e both brakes are applied at the same time.
Both Control Strategy is further classified for two way; either having comfort of the driver or achieving better energy efficiency. This both are not achieved at the same time for either of the brake control strategy. When more energy is required the comfort is compromised. For more comfort, the energy needs to be traded off.
Electric Driven Intelligent Brake:
Fig: Parts of EDIB of Nissan Leaf
One of the example of this strategy is Electric Driven Intelligent Brake (EDIB) employed by Nissan Leaf. The EDIB allows and controls optimization of the regenerative brake and regular friction brake (hydraulic brake).
Fig: Braking Combination Fig: Pedal operation force v/s Deceleration
After stepping on the brake pedal, the system produces natural and adequate braking force that corresponds to the operation. The amount of energy regeneration also needs to be increased as much as possible. EDIB controls the regenerative brake and friction brake to support both of these requirements. Further, it also controls the reactive force from the pedal in order to unify the feeling when stepping down on the pedal and the sense of deceleration.
It can be noted that the combination is the sum of friction brake and regenerative brake which is desired by the user. The magnitude of this brake can vary, but their sum will not vary, it will remain same.
3. Make a MATLAB program which plots contour of given motor speed, torque and efficiency values. Attach the code as a .m file attach a screenshot of all the plots.
The equations of types of losses that takes place in a motor are;
a. Copper Loss = `K_c*T^2`
b. Iron Loss = `K_i*omega`
c. Windage Loss = `K_w*omega^3`
d. Constant Loss in the motor = `C`
The MATLAB program to plot the efficiency contour of an Electric Motor is;
%A program to plot Efficiency Contour of Motor
clear all
close all
clc

%Creating Speed and Torque array
s = linspace(1,1000);
t = linspace(1,250);

%Constant values of Motor Losses
kc = 0.2;
ki = 0.008;
kw = 0.00001;
ConL = 20;

%Creating Meshgrid
[S,T] = meshgrid(s,t);
Outputpower = (S.*T);
CL = (T.^2)*kc;                                      %Copper Loss
IL = S*ki;                                           %Iron Loss
WL = (S.^3)*kw;                                      %Windage Loss
Inputpower = Outputpower + CL + IL + WL + ConL;      %Constant Loss
Z = Outputpower./Inputpower;

%Efficiency to plot the contour
V = [0.70, 0.80, 0.85, 0.90 0.91, 0.92, 0.925, 0.93];
box off
grid off
contour(S,T,Z,V);
xlabel('Speed (rad/s)');
ylabel('Torque (N.m)');
title('Efficiency Contour of Electric Motor');
hold on
The result is;
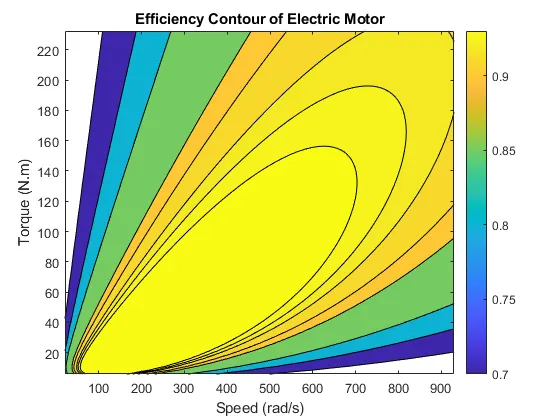
Fig: Efficiency Contour of Motor
From the above figure, it is evident that the higher efficiency is achieved in area with middling speed corresponding to middling torque.
Suppose, we check for 4 kW and 10 kW Output Power.
%Creating Contour for 4 kW and 10 kW Output Power
V = [8000,10000];
contour(S,T,Outputpower,V);
The result is;
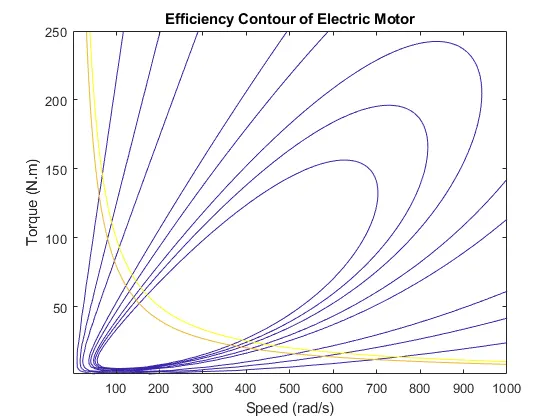
Fig: Efficiency contour graph for 4 kW, 10 kW output power
From the above figure, it is clear that the high efficiency is achieved at low speed and low torque in the speed range of 200 rad/s to 300 rad/s corresponding to torque between 20 N.m to 40 N.m.