Week-11 Challenge: Braking
ANS1:
FORMULAE USED:
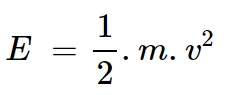
or, 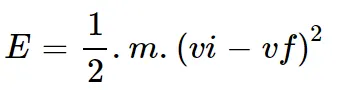 [Where, m – mass of the vehicle in (Kg)
vi – initial speed of the vehicle in m/s
vf – final speed of the vehicle in m/s
E - kinetik energy, ]
Form the drive cycle 15 breaking points were obtained. The mass is set at a constant 1800. The energy required for breaking is given below,
| no.of breaking | initial speed (Vi) m/s | final speed (Vf) m/s | mass (Kg) | breaking energy (E) |
| 1 | 10 | 9 | 1800 | 900 |
| 2 | 10.3 | 10.1 | 1800 | 36 |
| 3 | 12 | 8.5 | 1800 | 11025 |
| 4 | 15 | 10.5 | 1800 | 18225 |
| 5 | 16.2 | 14.1 | 1800 | 3969 |
| 6 | 18 | 16.2 | 1800 | 2916 |
| 7 | 17.5 | 12.6 | 1800 | 21609 |
| 8 | 16.4 | 12.6 | 1800 | 12996 |
| 9 | 16.9 | 11.2 | 1800 | 29241 |
| 10 | 19.4 | 14.8 | 1800 | 19044 |
| 11 | 20.5 | 18.9 | 1800 | 2304 |
| 12 | 20.9 | 12.8 | 1800 | 59049 |
| 13 | 15.2 | 14.9 | 1800 | 81 |
| 14 | 14.6 | 10.8 | 1800 | 12996 |
| 15 | 20 | 16.4 | 1800 | 11664 |
| 206055 (total energy) |
The total energy used for 15 time braking is 206055 Joule.
ANS2:
Braking coordination: Braking is very frequent in electric drives to stop a motor in a reasonably short time. There are two types of braking ,
- Mechanical Braking
- Electrical Braking
Mechanical Braking Cordination:
The motor in this case is stopped due to friction between the moving part of the motor and the brake shoe that is stored energy is dissipated as heat by a brake shoe or brake lining which rubs against a brake shoe or brake lining which rubs against a brake drum. it is basically in 3 types ,
- Drum Brakes: A drum brake is a brake in which the friction is caused by a set of shoes or pads that press againt a rotating drum-shaped part called a brake drum.
- Disc Brakes : The disc brake is a device for slowing or stopping the rotation of a wheel while it is in motion. This is connected to the wheel or the axle . To stop the wheel, friction material in the form of brake pads is forced hydraulically , pneumatically or electromagnetically against both sides of the disc. Friction causes the disc and attached wheel to slow or stop.
- Engine Brakes: A compression engine brake is a device that can convert a diesel engine into an air compressor, a power absorbing device. These devices are used in trucking applications to provide a means for retarding the vehicle, supplementing the normal vehicle braking system. The retarding operation is under full control of the vehicle operator and can be used simultaneously with the normal service brakes.
- Exhaust Brakes: An exhaust brake works by restricting the flow of exhaust gases through the engine.
Electrical Braking Cordination:
The kinetic energy of the moving parts that is motor is converted into electrical energy which is consumed in a resistance as heat or alternatively it is returned to the supply source. During braking operation a motor has to function as a generator. The motor can be held at stand still. In other words the electric braking cannot hold the motor at rest. Thus it becomes essential to provide mechanical brakes in addition to electric braking. It is of three types,
- Plugging: This is a simple method of electric braking and consists in reversing the connections of the armature of the motor so as to reverse its direction of rotation which will oppose the original direction of rotation of the motor and will bring it to zero speed when mechanical brakes can be applied. DC motors , Induction motors and Synchronous motors are the best examples.
-
Rheostatic Braking: In this method of braking, the motor is disconnected from the supply and run as generator driven by the remaining kinetic energy of the equipment that is the energy stored in motor and load which are to be braked. DC motors , Induction motors and Synchronous motors are the best examples.
- Regenerativbe Braking: In this type of braking the motor is not disconnected from the supply but remains connected to it and its feeds back the braking energy or its kinetic energy to the supply system. This method is better than the first and second methods of braking since no energy is wasted and rather it is supplied back to the system. DC motors and Induction motors are the best examples.
Why electric motor can’t develop braking torque at high speed similar to starting?
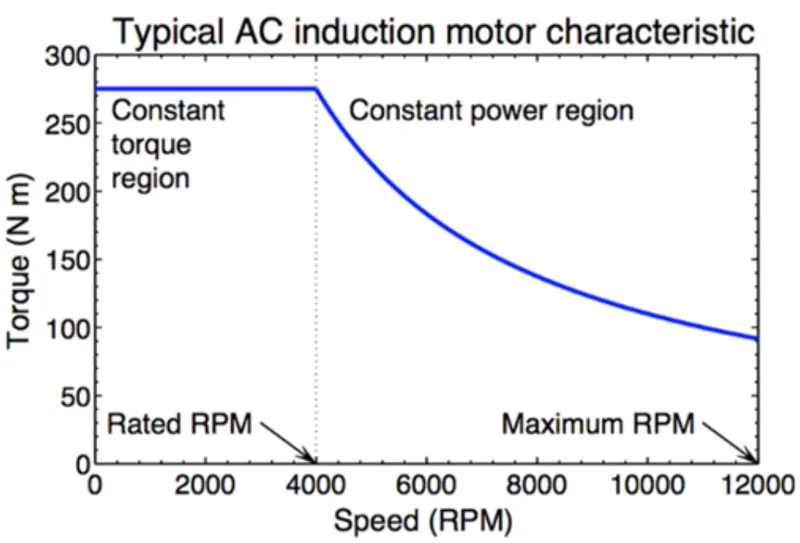
- At the start the motor achieves peak torque till reaches a certain motor speed range from where it will rapidly drop. The reason due to the drop in torque is due to the motor shaft reaching critical speed the area where the peak torque is constant is known as the peak constant torque region of the motor.
- The region where the torque decreases is known as the constant power region as the Power generated by the motor will be at its peak. Since the torque produced at the constant power region is very low it is not possible to develop enough braking torque in this region.
- The braking torque produced increases as the speed decreases.
ANS3:
USEFULL TERMS:
- Motor speed: The speed of a motor, measured in revolutions per minute (rpm), defines a motor's ability to spin at a rate per unit time
- Motor torque: The torque of a motor, measured in foot-pounds (ft-lb), is a rotational characteristic of the motor that is the algebraic product of force multiplied by distance.
- Motor efeciency: The ratio between power output (mechanical) and power input (electrical).
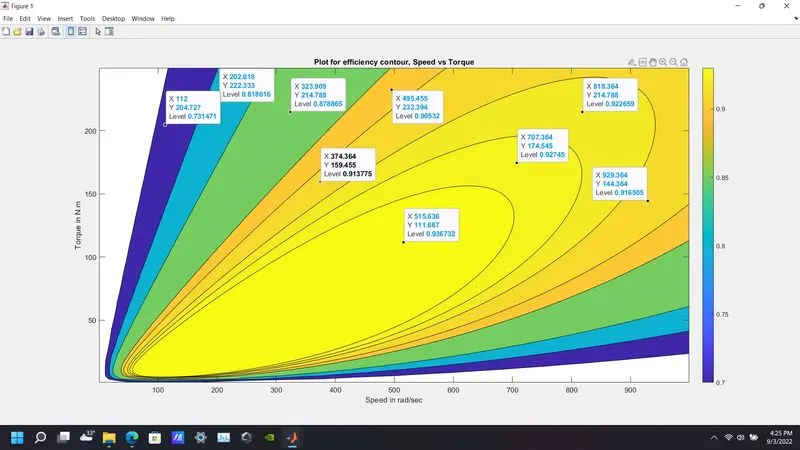
- Contour plot: It is a graphical technique for representing a 3-dimensional surface by plotting constant z slices, called contours, on a 2-dimensional format. That is, given a value for z, lines are drawn for connecting the (x,y) coordinates where that z value occurs. The contour plot is an alternative to a 3-D surface plot.
MATLAB SCRIPT: Explain within script.
clear all
close all
% A program for plotting efficiency contours for electric motors
% The x-axis corresponds to motor speed (w)
% The y-axis corresponds to torque (T)
% First, set up arrays for range.
x = linspace(1, 1000); % Speed of motor in rad/s
y = linspace(1, 250); % Torque produced by motor in N.m
% Allocate motor loss constant
kc = 0.2; % For copper losses
ki = 0.008; % For iron losses
kw = 0.00001; % For windage losses
ConL = 20; % For constant motor losses
% Now making mesh
[X,Y] = meshgrid(x,y);
% To calculate output power
Pout = (X.*Y); %Power = Torque x Speed
% To find losses
B = (Y.^2)*kc; % Equation to find copper losses
C = X.*ki; % Equation to find Iron losses
D = (X.^3)*kw; % Equation to find windage losses
% Relationship between Input Power and Output Power
Pin = Pout + B + C + D + ConL;
% To calculate the effieciency
n = Pout./Pin;
% We now set the efficiencies for which a contour will be plotted
V = [0.70, 0.80, 0.85, 0.90, 0.91, 0.92, 0.925, 0.93];
box off
grid off
contourf(X,Y,n,V);
colorbar;
xlabel('Speed in rad/sec');
ylabel('Torque in N.m');
hold on
% Now plot a contour of the power output
% The array Output Power has already been calcuated.
% We draw contours at 3 and 5 kW.
title('Plot for efficiency contour, Speed vs Torque')
CONTOUR PLOT: