Week-11 Challenge: Braking
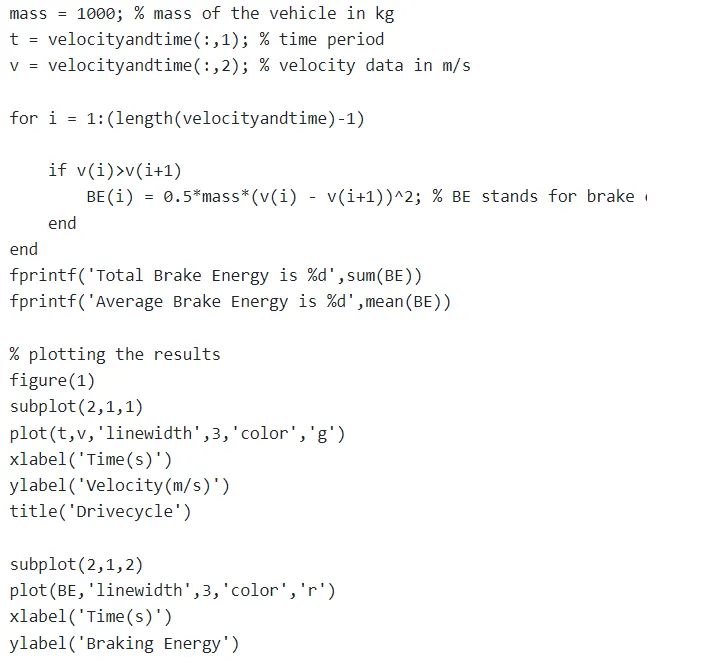
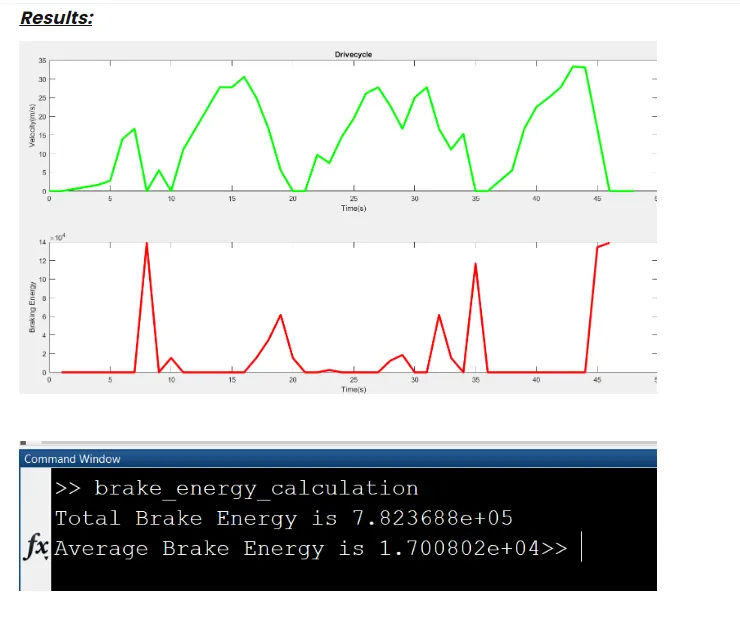
- For a defined driving cycle, calculate the energy required for braking.
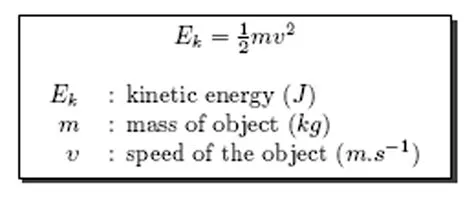
we use this formula to calculate energy required for braking
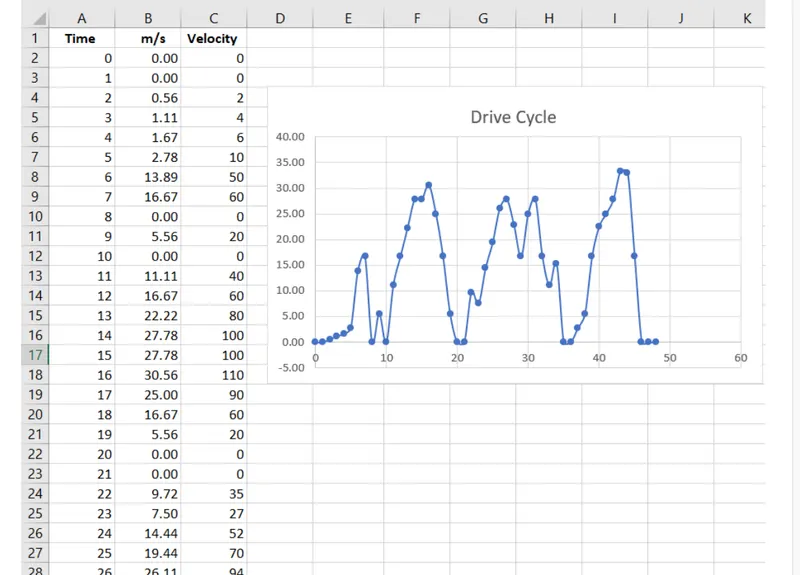
we need to create a excel sheet for a drive cycle-
2.Why electric motor can’t develop braking torque at high speed similar to starting? How electric and mechanical brakes are coordinated?
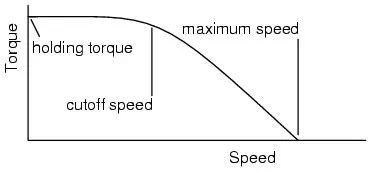
According the graphs attached above -
we have two region, constant Torque and constant power region .
For electric motor , a high torque is available at starting , which is rated torque of motor . motor occurs maximum torque until it reach at base speed or max speed or we can say certain speed range after base speed torque will going to start decrease.The area where peak torque is constant called the constant torque region and the region where torque start decreases is known as the constant power region.
hence in constant power region at high speed there is very less torque , its not possible to develop high braking torque in tis region. if speed will decrease then only the condition when torque increases.
or
power formula --
power = torque * speed
we cannot inecrease torque and speed together becaues if we increase both then the power will also increasess rapidly then its drain the battery very fastly..
How electric and mechanical brakes are coordinated?
- In order to stop the system in cases of emergency.
- In order to ensure that the system remains stationary when not in operation.
clear all
close all
clc
speed= linspace (1,1500);
torque= linspace(1,350);
Kc=0.2;
Ki= 0.008;
Kw=0.00001;
con =20;
[X,Y]= meshgrid(speed,torque);
% calculating output power = torque*speed
Outputpower = (X.*Y);
%Calculating copper losses
B= (Y.^2)*Kc;
%Calculating iron losses
C=X*Ki;
%Calculating windage  losses
D= (X.^3)*Kw;
Inputpower = (Outputpower +B+C+D+ con);
% Calculating efficiency (Z)
Z= Outputpower./Inputpower;
% the efficiencies for which the contour  will be plotted
V= [0.7,0.8,0.85,0.90,0.91,0.92,0.925,0.93];
box off
grid off
contourf(X,Y,Z,V);
xlabel=('speed');
ylabel= ('Torque');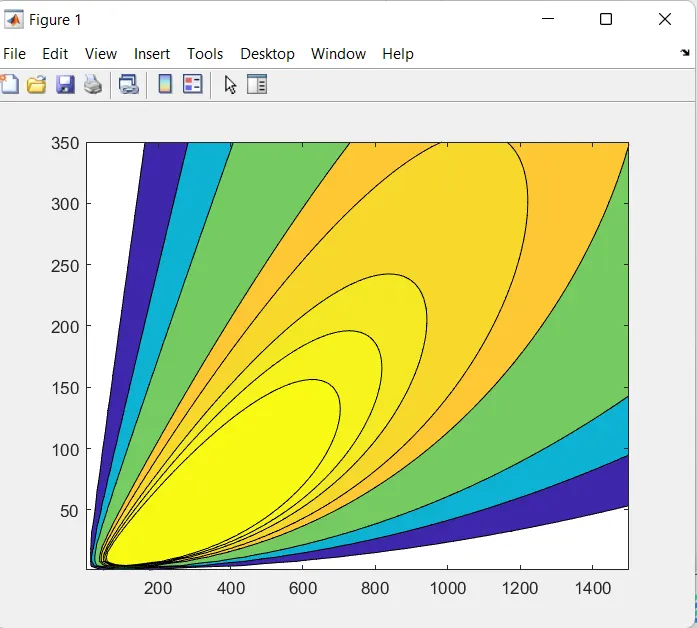
From the countor plot the observations are -
contour output plot is a group of efficiencies where inner most will have highest efficiency and the height is maximum as we keeep on going outside or outward the height reduces and efficiency is reduces